
This publication is a Science for Policy report by the Joint Research Centre (JRC), the European Commission’s science
and knowledge service. It aims to provide evidence-based scientific support to the European policymaking process.
The scientific output expressed does not imply a policy position of the European Commission. Neither the European
Commission nor any person acting on behalf of the Commission is responsible for the use that might be made of this
publication.
JRC Science Hub
https://ec.europa.eu/jrc
JRC 112622
EUR 29333 EN
Print
ISBN 978-92-79-92961-8
ISSN 1018-5593
doi:10.2760/565135
PDF
ISBN 978-92-79-92960-1
ISSN 1831-9424
doi:10.2760/63833
Luxembourg: Publications Office of the European Union, 2018
© European Union, 2018
Reuse is authorised provided the source is acknowledged. The reuse policy of European Commission documents is regulated by Decision 2011/833/EU
(OJ L 330, 14.12.2011, p. 39).
For any use or reproduction of photos or other material that is not under the EU copyright, permission must be sought
directly from the copyright holders.
How to cite this report: Migali, S., Natale, F., Tintori, G., Kalantaryan, S., Grubanov-Boskovic, S., Scipioni, M.,
Farinosi, F., Cattaneo, C., Benandi, B., Follador, M., Bidoglio, G., McMahon, S. and Barbas, T., International Migration
Drivers, EUR 29333 EN, Publications Office of the European Union, Luxembourg, 2018, ISBN 978-92-79-92960-1
(main report online),978-92-79-92961-8 (main report print), doi:10.2760/63833 (main report
online),10.2760/565135 (main report print), JRC112622
All images © European Union 2018
Title International Migration Drivers. A quantitative assessment of the structural factors shaping migration
Abstract
The International Migration Drivers report quantifies the relative importance of the drivers of migration at international
level in a comprehensive way by income levels of countries of origin. Different channels of migration (voluntary migration
flows between 1980 and 2017, asylum seekers, residence permits) are analysed separately. The drivers consider both
structural characteristics of countries and individual characteristics of persons planning and preparing to migrate. The
study of the drivers of past migrations is used to formulate better informed migration scenarios for the future with a
medium to long term perspective. In addition, findings of the report are key to understanding the root causes of migration
addressed by the European Agenda on Migration and the upcoming Global Compact for Migration.
Contents
Acknowledgements ........................................................................................................................................... 4
Executive summary............................................................................................................................................ 5
Introduction ..................................................................................................................................................... 10
Chapter 1. Theories and empirical analyses of the drivers of migration ........................................................ 12
Chapter 2. Trends and patterns of international migration and intentions to migrate .................................. 19
Chapter 3. International Migration Drivers: an empirical investigation ......................................................... 35
Chapter 4. The effects of migration policies on migration flows .................................................................... 49
Chapter 5 Climate change and migration ........................................................................................................ 61
Chapter 6 Likely development of future migration ......................................................................................... 71
Bibliography ..................................................................................................................................................... 85
Annex to Chapter 3 - Methodology ................................................................................................................. 97
Annex to Chapter 3 - Data ............................................................................................................................. 106
Annex to Chapter 5 - Literature on the impacts of climate change on migration ........................................ 109
Acknowledgements
The realisation of this publication has been a collective effort of members of the Unit Migration and
Demography of the Joint Research Centre. The work has been co-ordinated and edited by Silvia Migali and
Fabrizio Natale. The executive summary was authored by Simon McMahon and Thomas Barbas, Chapter 1
was authored by Guido Tintori, Chapter 2 by Sona Kalantaryan and Sara Grubanov-Boskovic, Chapter 3 by
Silvia Migali, Chapter 4 by Marco Scipioni, and Chapter 6 by Fabrizio Natale.
The Chapter 5 on climate change was authored by: Fabio Farinosi (JRC), Cristina Cattaneo (Fondazione Enrico
Mattei, Milano), Barbara Bendandi (UNCCD Bonn), Marco Follador (JRC) and Giovanni Bidoglio (JRC). Climate
hazards data used for the analysis were kindly provided by Alessandro Dosio (JRC) and Gustavo Naumann
(JRC).
We would like to express our sincere thanks to Erofili Grapsa (JRC), Rainer Münz (European Political Strategy
Centre), Ronald Skeldon (University of Sussex), Anna Schmidt (DEVCO), Alice Szczepanikova (JRC) and Michele
Tuccio (OECD) for offering valuable feedback on the report.
We also owe sincere gratitude to Simon McMahon, Thomas Barbas and Marion Westra van Holthe who
provided useful comments at various stages of the drafting of the report.

EXECUTIVE SUMMARY| 5
Executive summary
The question of why people migrate has been central to migration research for many decades. It has been
approached through different disciplinary lenses and analytical approaches, raising an awareness of the
drivers of international migration flows between countries (the macro-level) and of migration decision-
making by individuals (the micro-level) as well as of the complexity of the phenomenon.
Understanding patterns and drivers of migration has also become a central concern in politics and
policymaking. In recent years, both the European Union and the United Nations have striven to address the
international governance of human mobility. Specifically, the EU Agenda on Migration and the UN Global
Compact for Safe, Orderly and Regular Migration have explicitly stated the need to address what are variably
named as the root causes or drivers of migration.
Human mobility has a long history and is likely to continue into the future. Global migration has remained
proportional to the growth of the world population, with the migration rate fluctuating around 3% since the
1960s. Evidence also suggests that although many people express a wish to migrate, only a few undertake
the necessary steps to prepare to do so, with even fewer actually migrating at all. Nevertheless, the total
number of people around the world who migrate to another country is increasing. Changes in the scale and
direction of migration flows have led to the emergence of new destination hubs such as Europe, the Arab
Gulf and parts of Asia. Crises have been declared as new migration and displacement patterns arise.
In light of its significance to current and future policymaking, this report provides quantitative evidence to
better understand and anticipate what drives international migration. In doing so, it contributes to
formulating better-informed migration scenarios for the future. The report considers both the structural
characteristics of countries of origin and destination of migrants and the individual characteristics of people
considering or preparing to migrate. The findings reveal that although immediate challenges need to be
addressed quickly and effectively when they arise, short-term responses to migration policymaking rarely
consider the underlying structural factors which drive global migration patterns. As a result, a comprehensive
and long-term approach is indispensable for migration policymaking.
This report represents a step towards better understanding what shapes international migration and
translating that knowledge into a resource to support policymaking. However, our understanding of
international migration as part of a continuum between different possible forms of human mobility is still
limited. We can expect that development will increase human mobility at large and not necessarily in the
form of permanent international migration as experienced in the past. Better evidence will be important if
we are to be able to anticipate upcoming trends and prepare effectively for living in a future in which
international migration will continue to be a global issue.
A guide to the International Migration Drivers
The International Migration Drivers (IMD) report is built around the quantitative analysis of the variables that
explain international migration. These variables include the characteristics of a country of origin which may
affect levels of emigration, bilateral relations between countries such as trade relations which may affect the
direction of migration, and the features of destination countries which either attract or discourage
immigration to them.
Through statistical analysis of the best available data, the IMD report indicates the importance of different
variables for explaining types of migration. It shows which variables have a greater or lower relative
importance in determining international migration flows. It also shows whether those variables are
associated with higher or lower levels of migration. If a variable has a negative sign it means that an increase

EXECUTIVE SUMMARY| 6
in this factor is associated with a decrease in migration, whereas a positive sign implies that an increase in
this factor is associated with higher levels of migration. Finally, it also identifies the individual characteristics
of people who are more likely to express an intention to move to another country.
Four sets of analyses are presented in the report, which refer to the following different dimensions of
migration. First, the analysis examines general migration movements at the global level and differentiated
by income levels of the countries of origin. Second, it examines the scale of migration through different legal
channels to enter and stay in the EU, concentrating specifically on family, work and education residence
permits. Third, it focuses on the factors influencing forced migration around the world through an
examination of asylum applications.
Finally, the intentions to migrate of individuals are examined at the global level and differentiated by income
levels of countries of origin.
Key findings and policy implications
In its different parts, the IMD study sheds light on a number of important policy relevant questions.
Which drivers are most significant for international migration?
In general, the study confirms that the key drivers of international migration are mainly structural:
economic development in countries of origin, migrants' social networks and demographic change.
These variables are often interconnected, and reflect general stages of socio-economic development.
For instance, low GDP and high fertility levels all describe an early stage of socio-economic
development.
Other variables such as geographic and cultural distance between countries, changes in GDP levels
in destination countries and the level of education of the population in the country of origin offer
weaker explanations of why people migrate.
How does economic development affect migration?
The report highlights a complex, non-linear relationship between economic development and
migration. In general, migration first increases and then decreases with a country's economic
development. This is consistent with the mobility transition and migration hump theories which
describe an inverse U-shaped relation between migration and development.
This non-linear relationship is shown by the fact that in middle income countries, rising GDP per
capita is associated with higher migration levels whereas in high income countries, higher GDP per
capita is associated with lower migration levels. The lack of a significant relation in the case of low
income countries shows that in early stages of development also small changes in GDP play only a
minor role in affecting individual decisions to migrate. However, unlike the overall relationship
between economic development and migration, lower GDP per capita is associated with higher levels
of people seeking asylum. As a result, poverty is not simply a constraint hindering migration.
How does demography affect migration?
The report indicates that in low and middle countries high fertility rates do not result in higher
likelihood for migration. This could be attributed to the positive association between high fertility
rates and poor economic conditions which represent hindering factors for migration (see point
above).

EXECUTIVE SUMMARY| 7
However, younger people are more likely to express an intention to migrate and to act on that
intention by preparing to move to another country. Current high fertility rates will produce a 'youth
bulge' which is more likely to migrate internationally than current generations.
What drivers affect migration to the EU?
The presence of communities of people with a migration background in destination countries is the
strongest driver of migration to the EU through all legal channels.
Family reunification is by definition, dependent on the presence of family members already in the
EU. As a result, the importance of networks was to be expected and has been confirmed in the
analysis.
The presence of previous migrants from the same origin country is also the most significant driver of
labour migration to the EU, even though its relevance is lower than in the case of family migration.
Favourable labour market conditions in destination countries in the EU28 are also associated with a
higher proportion of new residence permits for work-related reasons.
Migration to the EU for education purposes is also associated with the presence of previous migrant
communities in destination countries, but this is not the only driver. Higher unemployment in
destination countries and larger geographical distances from the EU also have an influence and tend
to be associated with lower levels of migration for education.
What are the main factors driving people move and to apply for asylum?
It is to be expected that conflicts, state fragility and exposure to armed conflicts with high intensity
(either in terms of geographic spread or of casualties) result in higher numbers of asylum seekers in
the countries included in the analysis. This is indeed the case, but other drivers are also shown to be
significant as well.
Poverty in countries of origin is also an important driver of people seeking asylum. Higher levels of
poverty are associated with higher levels of asylum applications. This is not wholly unexpected, as
cases of conflict and state fragility can arise, cause and exacerbate situations of poverty.
The presence in the destination country of previous migrant communities is among the most relevant
pull factors for where people file for asylum. This is because members of the same community who
are already established in the host country can reduce the risks and the cost of flight and
incorporation after arrival, providing a shortcut for decision-making in situations of stress.
Other factors, such as favourable economic conditions at destination, geographic vicinity and
network effects are less significant drivers.
Why is there a gap between people's desire to migrate and their ability to do so?
There is a consistent gap between those wishing to move abroad and those actually preparing to
make an international journey. While more than 20% of the population expresses a desire for
international migration, less than 1% actually prepares to migrate. As a result, a wish to migrate is
not a reliable enough indicator to inform policymakers about future migration or the characteristics
of future migrants.
The socio-economic characteristics of those preparing to migrate in middle and high income
countries confirm the non-linear relation between income and ability to migrate described at macro

EXECUTIVE SUMMARY| 8
level. In middle income countries higher individual income fosters preparation for migration while in
rich countries the relation is inverse and in low income countries not statistically significant.
The findings also suggest that, at individual level, the youngest, male, foreign-born, more connected
abroad and more educated are more likely to prepare to move. Regardless of income level, the older
the individuals, the lower their likelihood to express the wish to migrate.
However, varied patterns are noticeable across different countries. In low income countries, people
aged 25 to 29 are most likely to be preparing to migrate. In middle income countries, people aged 20
to 40 are approximately 50 per cent more likely to prepare to migrate compared to the younger
group (aged 15 to 19).
To what extent are policies effective at shaping migration?
Despite the recent developments and improvements of data and indexes to measure policies,
daunting challenges remain ahead to provide quantitative global answers regarding the effectiveness
of policies.
The existing studies considered in this report tend to conclude that policies, albeit important, have a
less prominent role affecting the overall scale of migration when compared to other migration
determinants, such as economic drivers, social networks, cultural and geographical proximity.
Findings collected by comprehensive indexes point out that policies act primarily as a device for
shaping migration flows by selecting who can enter and reside in a country. In general and based on
a long-term perspective, entry and integration policies have become less restrictive, particularly for
high and low skilled workers, students and refugees. Nevertheless, border controls, exit policies and
measures against irregular migration have become more restrictive and this has influenced how and
where people move.
What is the relationship between climate change and international migration?
Worldwide, exposure to adverse climatic events is expected to increase in the future. However, it is
difficult to find a solid, direct causal correlation between climate change and international migration.
According to the study findings, the regions in which the combination of population and extreme
events is expected to substantially increase in the coming decades are: Northern, Eastern, and
Western Africa, while Central Africa is expected to be more subject to heatwaves than droughts;
Southern and Eastern Asia are expected to be particularly affected by drought events, while the
South-Eastern and Western Asian regions are more exposed to heatwaves; Central and South
America and Southern Europe are also projected to experience an increasing exposure of population
to climate extremes.
Slow-onset events linked with increasing temperature, reduced precipitation, drought events, and
land degradation were found to be relevant in determining migration flows out of rural areas,
especially in the least developed countries. Fast-onset climate related events such as floods are found
to affect communities by forcing them to relocate temporarily in the surrounding regions.
The response of the population exposed to adverse climatic events will depend on people's
adaptability to new conditions, the quality of institutions and the implementation of strategies aimed
at pursuing sustainable development.

EXECUTIVE SUMMARY| 9
These findings suggest that regional and national institutions should multiply their efforts to
implement strategies to minimize the vulnerability to environmental risks, boost resilience and
coping capacity.
Likely developments of future migrations
The key findings of this study have several implications for how we understand international migration. They
help us to anticipate how migration potential could translate into actual migration.
Based on what is observed in the past, we can expect that improving economic conditions, demographic
changes and network effects will continue to increase the potential for international migration. Higher levels
of international migration should be expected in the future, especially from developing countries.
When looking at specific countries, most international migration is likely to derive from middle income
countries and be directed towards high income countries. When looking at the level of individuals, the report
suggests that young, educated, highly connected individuals who are searching for job opportunities are
those who are more likely to prepare to move.
If policies are to address the structural factors driving international migration, such as poverty,
unemployment and demographic trends, then a long-term approach is vital. In the short-term policymakers
could, however, seek to shape migration by providing legal channels which facilitate selectivity and optimise
the overall benefits it brings.
Increasing development in low income countries will bring to a reduction of fertility rates and therefore to a
decrease of the absolute numbers of migrants in the long term, but in the medium term there will be more
people likely to migrate due to an increase in individual income.
While demographic and development trajectories indicate that the migration potential will increase, other
inherent frictions such as geography and regulations which have kept global migration relatively stable over
recent decades, may continue to apply. In addition, the recent path of globalisation increasingly characterised
by the transfer of knowledge and capital more than of labour indicates that globalisation by itself is not
necessarily incompatible with a scenario of moderate migration.

INTRODUCTION| 10
Introduction
The question why do people migrate has been central to migration research for many decades. Social
scientists have addressed it from several angles and disciplines. They have developed theories to attempt to
explain the dynamics of migration. They have also sought empirical evidence of the drivers of international
migrations between countries (macro-level) and of individual migration decision-making (micro-level). The
expansion of the research field has not only deepened our understanding of the fundamentals of migration,
but also raised an awareness of the complexity of the phenomenon. The convergence of different disciplines
in the field of migration studies reiterates the idea that it is not possible to view the dynamics behind motives
and channels of migration through the lens of only one all-encompassing theory.
But policymaking needs concise answers to handle this complexity. Recently, both the EU Agenda on
migration and the Global Compact for Safe, Orderly and Regular Migration, explicitly stated the need to
improve the management of migration by addressing the ‘adverse drivers and structural factors that hinder
people from building and maintaining sustainable livelihoods in their countries of origin, and so compel them
to seek a future’. Despite using different terms such as drivers, root causes, determinants and push and pull
factors, the rationale behind these statements is the same: the management of migration requires a deep
understanding of what determines migration in the first place.
Such a deep understanding is absolutely necessary to address as-yet unanswered but fundamentally
important policy questions. Which migration flows should we expect in the future? Will climate change
increase international migration? Do immigration restrictions reduce migration flows or simply divert them
towards irregular channels? Will migration from low income countries increase or decrease with
development aid? Is there a 'chain effect' linked to family reunification? Should we expect many more
migrations from developing countries considering the expanding population and the trends for reduction of
poverty?
This report strives to build a bridge between the complexity emerging from research and the need for
digestible answers for policy. To do so, we address the questions mentioned above with a quantitative
approach. We take complexity into account by exploring how multiple drivers of migration change in relation
to development stages of countries and different dimensions of migration. Specifically, we carry out a
quantitative analysis of the variables that explain international migration for different dimensions of
migration. These variables include the characteristics of a country of origin which may affect levels of
emigration, bilateral relations between countries which may affect the direction of migration, and the
features of destination countries which either attract or discourage immigration to them.
The results presented in Chapter 3 are developed from different sets of cross-country and individual-level
empirical analyses. Essentially, they confirm what is available in the socio-economic literature on migration
drivers. Most importantly, they help to establish anchoring points built upon empirical evidence to support
the discussions about the future of migration. Some of these anchoring points show counterintuitive
relations such as a non-linear relation between income level in countries of origin and likelihood for
migration. Some others clearly indicate that the same driver may have completely different and sometimes
diverging effects depending on the form of migration considered.

INTRODUCTION| 11
A wide collection of international statistics about migration and development indicators is used to fit and test
the models developed in this study
1
. Through the systematic exploration of this data we have been able to
not only draw useful conclusions but also identify limitations in the available data, shortcomings from using
a purely quantitative approach and gaps which remain unexplained. What is needed, therefore, is the
incorporation of more nuanced qualitative analyses and forward-looking foresight exercises. In this sense, it
should be remembered that the quantitative approach adopted in this study does not provide an exhaustive
explanation about all drivers of migration but rather provides a thorough exploration of the best evidence
that can be extracted from currently available statistics at an international level.
The report is structured as follows.
Chapter 1 gives a brief critical overview of main theories of migration. This chapter aims at giving a flavour of
the evolution of theories across time and disciplines. It shows that the approach adopted in our empirical
analysis, relying on migration transition theory, is a useful way of viewing drivers of migration but is just one
of many other possible perspectives.
Chapter 2 provides a descriptive analysis of migration trends on the basis of the datasets used in the empirical
analyses. Specifically, this includes general statistics on stocks and flows of migration, statistics on asylum
seekers, EU residence permits broken down by reason of entry and individual intentions to migrate on the
basis of the Gallup World Poll survey.
Chapter 3 constitutes the main part of the report. It shows the results of the empirical analysis of the drivers
of four dimensions of migration, focusing on (i) general migration from low, middle and high income countries
(ii) different channels to enter and stay in the EU (such as education, work and family) (iii) asylum applications
(iv) individual intentions to migrate, i.e. desire and preparation to move abroad, from low, middle and high
income countries.
Chapter 4 offers a qualitative analysis of the influence of migration policies changes on migration flows. The
chapter not only reviews the existing literature on the topic, but also discusses the findings from several
projects which have mapped and coded migration policies at international level.
Chapter 5 reviews the literature on the role of climate change on migration. Additionally, it provides
estimates of the population exposed to climate events by combining spatially detailed forecasts for
population with forecasts on changes in drought and temperature.
Chapter 6 concludes the report by describing the implications for the future of migration emerging from an
analysis of the drivers of the past.
1
The main sources of migration data used in this report are represented by: UNDESA statistics on the stock of migrants by country of birth and
destination (1990-2017), World Bank statistics on the stock of migrants by country of birth and destination (1960,1970,1980), a data set of net
migration flows at five years intervals between world countries estimated from a demographic accounting exercise (1965-2015) (Abel 2017); UNHCR
statistics on monthly asylum applications (1999-2017) and on the annual stock of refugees (1960-2016); EUROSTAT statistics on first residence permits
(2008-2016), GALLUP World Poll for individual intentions to migrate (2010-2015). In addition to the migration data a wide collection of variables was
used to explore the role of drivers. Most of these variables are coming from the World Bank World Development Indicators. Further data sources
include: UN COMTRADE for trade; IIASA and UNDESA for demographic forecasts; DEMIG and IMPIC for migration policies; CEPII for geographical
variables; Uppsala Conflict Data Program for conflict data; Polity IV Project for Democracy index, Gibney et al. (2017) for Political Terror Scale data,
SABRE for international air passengers’ data; Global Carbon Project (Murakami and Yamagata 2016) for spatially detailed population projections and
HELIX Project (Dosio et al. 2018; Naumann et al. 2018) for climate change. A more detailed description of the variables representing the migration
drivers is included in the methodological Annex to Chapter 3. In order to merge different data sets all variables have been mapped to the international
classification of countries according to the ISO 3166 standard; this may entail the loss of data for nationalities and countries which are reported in the
original data sources using different official codes and naming conventions and some minor discrepancies in respect of aggregate figures reported
elsewhere.

CHAPTER 1. THEORIES AND EMPIRICAL ANALYSES OF THE DRIVERS OF MIGRATION| 12
Chapter 1. Theories and empirical analyses of the drivers of migration
by
Guido Tintori
This chapter critically reviews the main theories of international migration and explains their relations to the
IMD analytical framework.
To strengthen the global governance of international migration, it is considered key to gain a deeper
understanding of its main drivers. The increasing demand and tendency to use quantitative evidence in
migration-related political discourses and policy making needs to be accompanied by systematic theorising.
Researchers, stakeholders and policymakers are all part and parcel of a collective endeavour to build a
community of knowledge that is able to make sense of the world complexity and devise fully-fledged informed
actions.

CHAPTER 1. THEORIES AND EMPIRICAL ANALYSES OF THE DRIVERS OF MIGRATION| 13
Introduction
The need to understand the drivers of migration, particularly in relation to why, when, where and how people
migrate, has become increasingly central to current political and public debates. Empirical investigation
enables us to collect information and evidence which puts our knowledge on a solid grounding. The IMD
analysis is a tool for doing so, by summarising multiple types of information into a set of values. Yet, it is only
with theorising that it becomes possible to rationalise complexity, understand its patterned regularities,
make sense of it and, ultimately, devise an informed plan of actions.
This chapter offers a critical overview of the major theories of migration to illustrate how and to what avail
the IMD analysis fruitfully engages with the theory of transition applied to migration and development, in
order to address the complex and multifaceted relationship between development differentials and
migration patterns (Skeldon 2012). The remainder of the chapter briefly touches upon the question of
migration-related data availability, accuracy and quality.
The role of the international community in the governance of international migration
Immigration policies have gained centre-stage in the politics of many countries worldwide, under the claim
that the size of the global migrant population has been growing significantly in recent times, thus prompting
a pressing need for a better regulation of flows. The governance of international migration has been
paramount to supranational institutions too, such as the EU and the United Nations. Recently, both have
prioritised the issue of how to enhance the management of population mobility.
For example, the EU responded to the ‘refugees and migrant crisis’ of 2014-2016 with the European Agenda
on Migration
2
. The Agenda, adopted in May 2015, aims at developing a holistic approach to human mobility
and at providing the EU Member States with tools to better manage migration in the short, as well as
medium-long term, in all its multifaceted aspects, from border control and legal integration to framework
partnerships with several sending countries. Concurrently, in September 2015, the 193 member states of the
UN committed to the 2030 Agenda for Sustainable Development
3
. The Agenda declares the goal of facilitating
'orderly, safe, regular and responsible migration and mobility of people, including through the
implementation of planned and well-managed migration policies’. This objective was further elaborated one
year later in the New York Declaration for Refugees and Migrants
4
. The Declaration sets in motion a step-by-
step procedure towards the adoption of a Global Compact for Safe, Orderly and Regular Migration that will
culminate with the Intergovernmental conference on international migration to be held in Morocco at the
end of 2018. Meanwhile, the operational contents of the Global Compact have been publicly discussed and
refined. The final draft of the Global Compact
5
, which has been released in July, insists particularly on the
need ‘to strengthen our knowledge and analysis of migration, as shared understandings will improve
policies’. To this end, the draft deems as essential ‘improving and investing in the collection, analysis and
dissemination of accurate, reliable, comparable data, disaggregated by sex, age, migration status and other
relevant characteristics […]. We must collect and disseminate quality data’
The agendas of both the EU and the UN ultimately share a series of common traits: they strive for setting up
a governance of international migration in which migration policies would be able to plan and manage the
2
Com(2015) 240 final.
3
Resolution adopted by the General Assembly on 25 September 2015, A/70/L.1
4
New York Declaration for Refugees and Migrants A/71/L.1
5
Global Compact for Safe, Orderly and Regular Migration, Final Draft, 11 July 2018.

CHAPTER 1. THEORIES AND EMPIRICAL ANALYSES OF THE DRIVERS OF MIGRATION| 14
flows effectively; they express the need for better migration-related data and knowledge to inform the
policy-making process.
The governance of international migration put into perspective
The United Nations Department of Economic and Social Affairs (UNDESA) estimated that the number of
international migrants
6
worldwide has reached 258 million in 2017, up from 173 million in 2000. In relative
terms, the international migration stock is currently calculated to be 3.4% of the world’s population. This
figure had remained constantly around 2.8 and 2.9% between 1990 and 2005. It reached the current level in
2015, after a decade in which the percentage of migrant stock grew at a faster pace, especially between 2005
and 2010. Having said that, data needs to be put in some perspective.
First off, the reference data on international migrants at global level concerns stocks and estimates of annual
flows derived from sophisticated calculations on longitudinal variations of such stocks (Abel 2017). Yet,
variations in stock do not depend entirely on people actually migrating, but could be contingent, among other
factors, on demographic dynamics as well. Secondly, recent scholarship has convincingly challenged the
popular perceptions that international migration is dramatically accelerating and increasing. As a matter of
fact, the stock of global emigrants has been constantly fluctuating around 3% since the 1960s. In addition,
scholars have shown that historical levels of international migration before the modern era are less distant
from those of the present day than conventional wisdom holds (Lucassen and Lucassen 2009; Pomeranz
2000). Geographical mobility thus emerges as a constant trait of the human presence on the planet (Manning
2005; Page Moch 1992, 2007). It is also not the first time that the international community has mobilised in
response to what has been perceived as a migration crisis. It happened, for example, in the 1920s and 1990s.
On both occasions the ‘basis for the regulation of migration by international convention and to facilitate
cooperation of the administrative authorities of different countries’ (Kraly and Gnanasekaran 1987, 969) was
identified in internationally comparable migration statistics and better shared knowledge (CGE 1925;
Fassmann, Reeger, and Sievers 2009; S. F. Martin 2015; Weiner 1995). This is not to say that there have not
been changes in recent patterns of global migration. The most important of these have, in fact, been
directional and led to the emergence of new destination hubs such as Europe, the Gulf and some parts of
Asia (Berg and Besharov 2016; Czaika and de Haas 2014; De Haas et al. 2018; P. Martin 2014).
Public awareness that migration drivers and processes are extremely complex is expanding. While it is true
that an all-encompassing theory of migration has not been developed (Brettell and Hollifield 2000; Castles
and Miller 2003), the field of migration studies has nonetheless gone a long way in developing both theories
and empirical analysis that can be instrumental to enhancing our understanding of the phenomenon.
Migration theories: origins
The genesis of a theory addressing the reason why and when people migrate is considered to be the work of
19th century British geographer Ravenstein (Ravenstein 1885), who hypothesised the existence of laws
regulating the mobility behaviour of people in relation to two geographical points, an origin and a destination.
Building upon Ravenstein’s laws, economists and sociologists further developed their theoretical
6
UNDESA bases its estimates upon official statistics provided by destination countries on the foreign-born population - or foreign citizens when the
former is not available - living in the country at a given time. It should be noted that the standard definition adopted by most administrations to count
an individual as an international migrant refers to a person who moves to a country other than that of their usual residence for a period of at least a
year (12 months). (UNDESA, United Nations Recommendations on International Migration Statistics, Rev. 1, 1998: 9-10. Regulation (EC) No. 862/2007
of the European Parliament and of the Council of 11 July 2007 on Community statistics on migration and international protection and repealing Council
Regulation (EEC) No 311/76 on the compilation of statistics on foreign workers, art. 2(a), 2(b)).

CHAPTER 1. THEORIES AND EMPIRICAL ANALYSES OF THE DRIVERS OF MIGRATION| 15
assumptions and consolidated the idea that migration is a function of economic (Harris and Todaro 1970;
Jerome 1926; Passaris 1989) or demographic (e.g. E. S. Lee 1966; Zipf 1946) spatial disequilibria.
These contributions to migration theory, developed mostly to explain internal migration, constitute the
bedrock upon which the now well-known push-pull model was built. In its classical variant, the push-pull
model conceptually applies Newton’s law of gravity and rules of attraction between two bodies to migration
patterns. Its main underpinning assumption is that migrants are pushed out of low income, highly populated
areas or countries and pulled towards more affluent and less populated areas or countries, and will continue
to do so until economic and demographic stability between the areas is reached.
The shortcomings of this theoretical framework are manifold, as became evident with observations of real-
world migratory patterns. First, demographic reasons and poverty alone are not sufficient conditions to
determine migration (Bodvarsson and Van den Berg 2013, 8–9; UNDP 2009). Second, the model looks at
migration in static terms, neglecting that it is a societal process that affects the conditions and the
environments in which it takes place. Lastly, it suffers from an ecological fallacy, since it is 'confounding
macro-level migration determinants (e.g., population growth, environmental degradation, climate change or
variability) with individual migration motives’ (De Haas 2010, 4).
In an attempt to address these issues, neo-classical migration theories considered wage differentials as the
main cause of international migrations. The revised theory uses the structure of labour markets and income
distributions in countries of origin and destination as its main explanatory lens. In this context, neo-classical
theorists see migrants as rational players of the international labour market, who select their destinations
according to income-maximization criteria (G. J. Borjas 1989). In addition, the new economics of labour
migration incorporated the societal dimension of migration by including in the analytical framework meso-
level determinants such as household strategy and decision-making, as well as the existence of migration
chains and diaspora networks (Bodvarsson and Van den Berg 2013, 36–37; Stark 1991). Despite the
corrections, the theory was still unable to explain several empirically observed regularities and patterns of
international mobility, from circular migration, to the selectivity process of migrants and the absence of
migration in the presence of textbook pre-conditions, to mention just a few.
Migration theories: embracing globalisation and complexity
Viewing the modern world as a process of increasing structural interdependence of countries and societies,
social scientists proposed a Migration systems theory. Both Wallerstein’s world system (Wallerstein 1974)
and Zelinsky’s mobility transition theories (Zelinsky 1971) set off the debate about the relationship between
globalisation processes and migration. According to these approaches, migration is induced by the expansion
of capitalist markets and production systems into peripheral societies. Investments dislocate predominantly
rural local populations. Internal (i.e. towards urban centres) and international mobility follows, in the
counter-direction to the flow of capital and goods (Saskia Sassen 1988; Skeldon 1997). Migration systems
theory therefore considers migration as a function of modernisation and globalisation, arguing that mobility
is generally triggered by the existence of prior and structural links between sending and receiving countries
based on colonization, political influence, trade, investment or cultural ties (Castles and Miller 2014).
Further refinement in the interpretive power of these theories was introduced by Massey (Massey 1990),
who integrated them with the concept of cumulative causation, relying on Myrdal (Myrdal 1957), to explain
the factors that might turn migration into a self-sustaining and self-perpetuating phenomenon, once the
structural determinants that prompted it in the first place no longer exert their force. These included the
establishment of diaspora networks, counter-flows of remittances, segmented labour markets with a
structural demand for unskilled labour, relative deprivation and the diffusion of a migration culture.

CHAPTER 1. THEORIES AND EMPIRICAL ANALYSES OF THE DRIVERS OF MIGRATION| 16
Migration systems and transition theories represent a seminal contribution to the field by embedding both
structure and complexity in their models. However, as pointed out by de Haas, they are fundamentally
descriptive, have a limited capacity ‘to specify the causal mechanisms underlying the correlations they
describe’ and ‘a fundamentally limited concept of agency’ (de Haas 2010: verbatim). In this interpretive
framework, in fact, migrants often figure as passive actors that mechanically obey push and pull forces or
choose to move due to simple calculations of individual utility maximisation.
A first amendment to these limitations came thanks to a burgeoning scholarship that aimed to disentangle
the patterned relationship between stages of development and migration behaviour. Surveys analysed the
medium- and long-term interactions between migration and social and economic processes. Often known as
‘augmented gravity model’ in the economic literature, this approach mends the ecological fallacy of the
original gravity model. In fact, these multivariate quantitative studies drew on datasets covering as much of
a global dimension as possible, comparative dimensions, or the different levels where decisions to migrate
were made (Bertoli and Docquier 2016; Bodvarsson and Van den Berg 2013; Clark, Hatton, and Williamson
2007; Clemens 2014a; De Haas 2010; Docquier, Peri, and Ruyssen 2014; Hatton and Williamson 2005; Mayda
2010).
To a great extent, the analysis described in this report participates in this effort of consolidating the empirical
evidence on the determinants of international migration. As it is detailed in chapter 3, the IMD report yields
particular insights on whether and in which conditions development is related to migration, in what forms
and at what stages.
The second influential development in migration scholarship derives from studies focused on the concept of
agency. A theory of the determinants of migration requires a better understanding of what a migrant’s
motives are. A reappraisal of the migration system and transition theories should address how the individual,
even personal, dimensions of aspiration, desire and emotion intersect with meso-structures, such as social
relations and migration infrastructures, as well as macro-structures, such as large scale demographic forces
and economic settings, interstate relationships, policies (Bakewell 2010; Benson and O’Reilly 2009; Boccagni
and Baldassar 2015; Carling and Collins 2018; Carling and Schewel 2018; Collins 2018; Scheibelhofer 2018;
Xiang and Lindquist 2014).
In this respect too, the IMD report enhances the understanding on the interaction between capabilities
(structural/institutional) and aspirations (individual/personal) as factors modulating human mobility, thanks
to an econometric analysis of the rich data that the Gallup’s World Poll gathered from a sample of the global
population on the desire to migrate (Esipova, Srinivasan, and Ray 2016).
Bridging the gap between theory and empirical work
In a seminal article of 1993, Massey and others observed that ‘the theoretical base for understanding
[international migration] remained weak’. In fact, they remarked how there was ‘no single, coherent theory
[…], only a fragmented set of theories that have developed largely in isolation from one another, sometimes
but not always segmented by disciplinary boundaries.’ They argued that the ‘complex, multifaceted nature
[of migratory processes] required a sophisticated theory that incorporates a variety of perspectives, levels
and assumptions’ (Massey et al. 1993).
Twenty years later, economists Bodvarsson and Van den Berg reinforced Massey's critique. They argued that
there was still little convergence across academic disciplines on a single model of migration theory and that
the ‘greatest challenge to migration theorists is the organization of all hypothetically relevant factors into
one coherent theoretical framework that will specify their interaction with each other in empirically testable
form and thereby serve as a guide to future research’ (Bodvarsson and Van den Berg 2013, 27). Indeed, the

CHAPTER 1. THEORIES AND EMPIRICAL ANALYSES OF THE DRIVERS OF MIGRATION| 17
only generalising theory that explains why people migrate is an application of the human capital model
(Sjaastad 1962) that asserts that, for most people, migration is an investment decision undertaken when its
expected benefits exceed its expected costs.
Figure 1 The immigration decision. (Bodvarsson and Van den Berg 2013: 6)
However, more recently migration studies have shown encouraging signs of convergence, cross-fertilisation
and efforts to bridge the gap between theory and empirical work. More and more scholars across disciplines
have approached their work sharing the view, based on solid empirical evidence, that people migrate for a
variety of reasons (economic, political, social, cultural, religious, psychological, emotional, environmental),
that they need to possess at least some form of capital (human, social or material) and that they need to deal
with structural elements that enable or constrain their decisions.
This convergence is reflected in a few semantic changes that have characterised the scientific languages of
social scientists and economists alike. The former has proposed the phrase 'push-pull plus', while the latter
have adopted the definition of 'augmented gravity model', as ways of incorporating complexity into their
theoretical frameworks. In addition, ‘drivers’ has almost definitively replaced ‘root causes’ and even
‘determinants’ as the term of choice describing the factors that lead people to move from one place to
another (Beine, Bertoli, and Fernández-Huertas Moraga 2016; Van Hear, Bakewell, and Long 2018). This
avoids suggesting any preconceived inference of causality and mechanistic concept of agency.
Lastly, this general acceptance of complexity in explaining people’s motivations to migrate led to reformulate
research questions differently. The task is then to focus less on causality and try to understand when and
why the various drivers, at different level of aggregation, are more important and influential than others.
Consequently, it is also crucial to comprehend which drivers are more susceptible to change through external
intervention (Van Hear, Bakewell and Long 2018).
Conclusion
Common wisdom holds that data helps manage complexity. The statement is certainly valid as far as
international migration is concerned. However, migration-related datasets present specific peculiarities. The
availability of quality data, hence the knowledge that can be drawn from it, is highly asymmetrical in terms
of geographical coverage and skewed in terms of the types of migration they are able to capture.
Sophisticated collection of empirical data on migration began in the contexts of Eighteenth Century

CHAPTER 1. THEORIES AND EMPIRICAL ANALYSES OF THE DRIVERS OF MIGRATION| 18
urbanisation and increasing mobility within European states, Nineteenth Century transatlantic mass
migrations and Twentieth Century northern Chinese migrations to Manchuria (McKeown, 2004). An early
major statistical achievement was also the international collection of comparative data gathered in the two-
volume International Migrations of Wilcox and Ferenczi (Wilcox 1929). The authors’ definition of
international migrants still holds today as all persons changing residence across state borders with the
intention to reside abroad for over a year. What also still holds today, to some extent, is that they
endeavoured to consolidate data from countries of departure, of transit, and of destination, but they had to
yield to structural gaps concerning some areas of the world.
We have never before been able to harness as much quantitative data describing the world we live in as
today. Yet, we are in the paradoxical situation. On one hand, in most OECD countries the possibility of
statistical empirical studies is unprecedented and the main need is to systematise and make sense of the
amount of information that has been collected. On the other hand, the chance of carrying out quantitative
studies of worldwide migration are crucially hampered by persistent gaps – especially on short-term mobility
and return flows - and problematic data quality in most sending and transit countries. Often, these countries
lack the infrastructure to collect data. In addition, despite some progress, greater international cooperation
to improve migration-related data harmonisation and data governance remains elusive (S. F. Martin 2015).
Problems created by gaps or a lack of accurate data on international migration flows inevitably require the
solution to ‘recruit more quality researchers to solve them’ (Sargan 2003, 428; Abel 2017). To this end, the
IMD report sticks rigorously to the tradition of analyses of statistical models that go through the fundamental
exercise of a thorough sensitivity analysis.
To strengthen the global governance of migration, improved data collection is certainly necessary. Yet, it goes
hand in hand with the capacity to interpret, present and read data in a critical and knowledgeable manner.
The IMD report aims to be a valuable contribution to this goal.

CHAPTER 2. TRENDS AND PATTERNS OF INTERNATIONAL MIGRATION AND INTENTIONS TO MIGRATE| 19
Chapter 2. Trends and patterns of international migration and intentions
to migrate
by
Sara Grubanov-Boskovic and Sona Kalantaryan
This chapter maps the evolution of trends and patterns of human mobility over recent decades. In addition to
following a more conventional geographic approach, it presents human mobility within and between country
groups defined on the basis of income level. After discussing the global trends of international migration we
use information on residence permits by reason (family, work, education) available for the EU to better
understand the legal channels used by migrants to move abroad. The focus is then restricted to asylum seekers
and refugees at the international level. In the last part of the chapter we move from the actual move measured
through flows and stocks information to the intention to migrate. Finally, we provide a comparison between
the desire and preparation at global level as well as across large geographic areas and income group
countries.

CHAPTER 2. TRENDS AND PATTERNS OF INTERNATIONAL MIGRATION AND INTENTIONS TO MIGRATE| 20
Introduction
This chapter gives an overview of the migration data used in the empirical analysis in Chapter 3. First, we
examine the evolution of worldwide trends and patterns of international migration over recent decades
(1960-2015). Then we further zoom in on the EU, specifically the detailed information on legal entrance
channels of migrants to EU such as family, work, education. The information on entry channels is followed
by a snapshot of forced migration based on asylum and refugee related statistics at the global level. In the
last part of the chapter we move from migration stocks and flows to migration aspirations. This is achieved
by complementing global figures of international migration with survey data on peoples' intentions to
migrate. This change of perspective allows us not only to understand why people want to migrate, but also
who is more likely to act and physically move abroad.
Wherever possible the trends are presented from two perspectives. The first refers to migration between
and within large geographic areas. The second refers to the approach adopted in this study – migration within
and between groups of countries defined on the basis of income level
7
.
Main trends of international migration
The proportion of the total global population that has migrated has remained stable over time
The total number of migrants worldwide increased from 91.5 million in 1950 to 258 million in 2017 (Figure
2, left chart). But despite this absolute growth, in relative terms the proportion of migrants in the global
population remained quite stable. At global level, international migrants have consistently represented
around 3% of the total population. There has been a slow but steady increase from the mid-1990s, but the
proportion is currently still only 3.3%.
The contribution of geographic areas to the increase of migrant population varies significantly both
in terms of sending and receiving countries
In the 1960s Europe was the region of origin for half of the world migrant population (46.4 million people).
Asian became the most common place of origin from the mid-1980s and currently account for 42.8% of the
total stock of international migrants (105.7 million). Africa and Latin America currently account for
approximately 15% of the total stock of migrants each, but have demonstrated the sharpest increase in the
stock of emigrants since the 1960s: the stock of migrants from Latin America increased almost ten times
(from 3.8 to 37.7 million) while the one from Africa is now four times bigger. Oceania and Northern America
were traditionally, and have remained, the continents with the most modest contribution to the global stock
of migrants; only 2.5% of the total stock of migrants (6.3 million) comes from these two continents.
7
The classification of countries by income groups is discussed in detail in the Methodological Annex of Chapter 3.

CHAPTER 2. TRENDS AND PATTERNS OF INTERNATIONAL MIGRATION AND INTENTIONS TO MIGRATE| 21
Figure 2 Evolution of the stock of emigrants by continent of origin in absolute numbers (left) and as percentage of the population at
the origin (right). Source: own elaboration based on UNDESA and WB.
The picture changes if we look at the stock of emigrants as a percentage of the total population in the country
of origin (Figure 2, right chart). In this case Europe has held the leading position through the whole period
considered; almost 8% of its population lived abroad in 1960 and 2017, although there was some decline
observed in between. The most significant increase was observed for Latin America as the percentage of its
population residing abroad increased from 1.7 to 6.2 in 2010. It then remained stable afterwards, likely as a
result of economic crises and tightening migration policies in the majority of destinations. The proportion of
the Latin American and Oceanian populations which lived abroad stayed below the world average in the mid-
Twentieth Century, rose slightly in the 1970s and then kept growing after.
Dismantling the popular belief: the percentage of Africans abroad is currently below the global
average
The proportion of Africans abroad is almost constantly in line with the world trends. Today, it is currently
below global levels, at 3.1% of the continent's population. This challenges popular assumptions about an
'African exodus' (Natale, Migali, and Münz 2018). The percentage of Northern Americans and Asians residing
abroad stayed below the world average for the whole period of interest, and currently respectively constitute
1.2 and 2.3% of their overall populations.
Not only origin: Africa hosts more than 20 million international migrants
All the continents experienced an increase in the stock of immigrants over the considered period. The stock
of international migrants in Europe has been growing constantly from the beginning of the period with some
acceleration by 2000 and slowdown during the recent economic crisis. It currently stands at the pre-economic
crisis level of 76.7 million.
Africa currently hosts 21.7 million migrants and the largest share represent intra-African migration
movements. This indicates that Africa is not simply a continent of origin for people who move away.

CHAPTER 2. TRENDS AND PATTERNS OF INTERNATIONAL MIGRATION AND INTENTIONS TO MIGRATE| 22
The evolution of the stock of immigrants in Asia went through a more modest path; it reached the one of
Europe by 2015 and followed closely then after. These two continents together host 60% of the world stock
of immigrants. The stock of immigrants in Northern America has quadrupled since the 1960s, reaching 55.3
million in 2017. The remaining two continents, Latin America and Oceania, host international migrant
populations of a more modest size, with 9.2 and 8.4 million respectively. Together, these account for 7% of
the global stock of international migrants.
The highest share of migrants stays in the same continent of origin
Some interesting patterns can be found in the evolution of the stock of international migrants between
continents in 1960 and 2017 (Figure 3). In 1960 most international migrants stayed within their own
continent. For instance, the vast majority of African (77%) and Asian (86%) emigrants were residing in their
continents of origin. This pattern holds over time for all continents.
An exception is the case of emigrants from the American continent. The highest share of emigrants from
Latin America resides in Northern America. At the same time, Northern American emigrants reported high
number of emigrants to Latin America and, more recently, also to Europe.
Figure 3 Breakdown of the stock of migrants for each continent of origin (100%) across continents of destination (colours) in 2017 and
1960. Source: own elaboration based on UNDESA and WB.

CHAPTER 2. TRENDS AND PATTERNS OF INTERNATIONAL MIGRATION AND INTENTIONS TO MIGRATE| 23
Whereas data on stocks tells us how many international migrants reside in a country, data on flows tells us
how many have moved to that country over a particular time frame. As a result, it allows to measure the
changing impact of different drivers more accurately.
The global flow of international migrants has doubled over time to total approximately 7.3 million people per
year who migrate from one country to another. In the mid-1960s, Europe was the continent with the largest
annual flow of emigrants (1.4 million). More than half of these remained within the continent (811,000
people or 23% of the total). As a result, intra-European migration flows were one of the major migration
patterns of that period. The second largest flow observed was the annual flow of Asian migrants heading for
another Asian country. This accounted for 18% of global flows (620,000 people)
8
.
Although migration flows within continents have remained a distinct feature of international migration, the
patterns have changed significantly. This is the case both in terms of size and routes. By 2015, the total
migration flows from Europe to the rest of the world had decreased to 1 million (14% of the total). Intra-
European flows also decreased by 9%, going against the trend seen across the rest of the world. The flow of
Asian migrants has quadrupled from the 1960s to the present day, reaching four million per year by 2015. A
large part of these flows has taken place within Asia, totalling 2.44 million or 34% of the global annual total.
Though modest in absolute terms, changes along certain routes were also particularly prominent: flows from
Africa to North America increased ten times, from Asia to Oceania and North America were eight and seven
times larger and, finally, flows within Oceania were six times larger by 2015.
The changing patterns of migration dynamics are even more evident if data on flows is examined for
individual countries. Figure 4 presents the top ten corridors between countries of origin and destination for
1965 and 2015
9
. These top ten corridors have accounted for one fifth of all global migration flows. Yet, nine
out of ten of the country pairs in the corridors have changed. The only corridor that has remained from 1965
to 2015 is that of migration from Mexico to the USA.
8
It is important to note that one part of these intra-European and intra-Asian migration in mid-1960s was actually a form of internal mobility taking
place within the boundaries of former USSR, Yugoslavia and Czechoslovakia.
9
The corridors Russia- Kazakhstan, Russia-Ukraine and Russia-Uzbekistan configured as a form of intra-USSR mobility in 1965.

CHAPTER 2. TRENDS AND PATTERNS OF INTERNATIONAL MIGRATION AND INTENTIONS TO MIGRATE| 24
Figure 4 Annual Flows migrants between top ten country of origin destination pairs. 1965 vs. 2015. Source: own elaboration based on
Abel (2017). Note: AFG-Afghanistan, ARE-United Arab Emirates, BGD-Bangladesh, CHN-China, DEU-Germany, DZA-Algeria, FRA-
France, IND-India, ITA-Italy, JOR-Jordan, JPN-Japan, KAZ-Kazakhstan, KOR-South Korea, LBN-Lebanon, MEX-Mexico, PAK-Pakistan,
RUS-Russia, SDN-Sudan, SSD-South Sudan, SYR-Syria, TUR-Turkey, UKR-Ukraine, USA-United States, UZB-Uzbekistan.
Migrants tend to move to countries belonging to the same or higher income group
One of the main motivations people have for migrating is to improve their living conditions. Looking at
patterns of migration between countries with different levels of economic development can reveal patterns
in addition to those already found elsewhere.
Among all migration corridors, the high income countries generated the largest migration flows in the 1960s.
These flows (in terms of absolute numbers) remained stable since then, at approximately 1.8 million people
per year. From the mid-1970s, flows from middle income countries also increased. In the early 1990s these
became larger than flows from high income countries, and have been ever since. In 2010 these flows reached
their highest level of 4.6 million people per year. As a result, the stock of emigrants from middle income
countries also increased, going from 38.8 to 117.4 million. Despite a significant increase from 350 thousand
to 1.88 million per year, flows from low income countries stayed below the levels of those from middle and
high income countries.
Flows from middle to high income countries has more than tripled
International migration in the mid-1960s was characterised by two distinct migration patterns: from high
income to high income countries and from middle income to high income countries. The former remained
fairly constant, registering only a slight decrease from 1.5 to 1.6 million. In contrast, the latter has more than
tripled, exceeding 3 million in 2015. The highest figure documented was for 2010 when the annual flow from
middle to high income countries reached 4 million.
The evolution of these flows between different income group countries confirms the pattern observed by in
absolute global numbers.

CHAPTER 2. TRENDS AND PATTERNS OF INTERNATIONAL MIGRATION AND INTENTIONS TO MIGRATE| 25
Figure 5 Distribution of migration flows across income groups in relative terms in respect of the total in each year. Source: own
elaboration based on Abel (2017).
As Figure 5 shows, the majority of international migration has throughout the Twentieth and Twenty-First
Centuries been directed at high income countries. In 1965, over two-thirds (68%) of international migration
was to high income countries. By 2015 this had risen to 74% of all global migration flows. However, whereas
most people moving to high income countries in 1965 had originated in other high income countries by 2015
this had changed, with movements from middle income countries being more common (representing 42.3%
of the total). Throughout this time migration from low income to middle or high income countries has been
consistently low.
Comparing the size of migration flows to the population size of countries of origin and destination also
enables us to evaluate the intensity of these flows beyond absolute numbers.
On average about 0.1% of world population emigrates every year. This figure, while stable over time, varies
significantly across different country groups. As a proportion of the total population, emigration from middle
income countries has tended to be lower than that from low or high income ones. Annually, less than 0.1%
of the population in middle income countries has emigrated. The proportion of the population of high income
countries which emigrates also decreased over time.
Since the 1970s, annual emigration from low income countries represented a higher proportion of the total
population than in the other two categories, although this has decreased over recent years to only 0.14% in
2015.
Immigration flows toward middle income countries have been relatively stable over time, while flows
towards high income countries have been highest throughout nearly all of the period examined.

CHAPTER 2. TRENDS AND PATTERNS OF INTERNATIONAL MIGRATION AND INTENTIONS TO MIGRATE| 26
Main trends of migration in the EU
The high level of aggregation of international statistics on migration does not allow to differentiate the figures
on flows on the basis of the channels of migration. However, a breakdown among different types of migration
is possible by considering immigration flows to the EU28. In specific, EUROSTAT data on first residence
permits provide information on a bilateral level on four channels (or reasons) of legal entry to the EU28 used
by migrants: family, education, work and other reasons. This data offer figures on first residence permits,
that is any new authorizations issued to a non-EU citizen allowing to legally reside in the European Member
State (MS) issuing it
10
. The data on first residence permits with a validity of at least 12 months are the most
suitable for studying the long-term migration inflows.
As previously described, since 1960 the European continent has had a major role both as continent sending
a relevant number of migrants as well as receiving them. The largest part of these flows concern directly the
EU28. Indeed, the EU28 alone reported a rise in the total number of immigrants (from 28 million in 1960 to
37 million in 2017). The increase in emigration from the EU28 was even higher (from 16 million in 1960 to 55
million in 2017). Today, the EU28 area hosts around 15% of total migrant population while being, at the same
time, the area that sends 22% of international emigrants.
Swift return to the pre-crisis level of legal migration inflows
With the global crisis about to reach the EU in 2008, Member States issued 2 million first residence permits
to non-EU citizens with a duration of longer than 12 months (Figure 6). As the effects of the global crisis
became harsher for the European economy, the legal inflows to the EU started to diminish, reaching their
lowest figure in 2012 when only 1.3 million first permits were issued. In conclusion, during the first five years
of the crisis the number of new authorizations for non-EU citizens to reside in the EU28 decreased by 39%.
Figure 6 First residence permits by type in EU28, 2008-2016. Source: own elaboration based on EUROSTAT.
10
Excluding therefore inflows of undocumented migrants from our analysis.

CHAPTER 2. TRENDS AND PATTERNS OF INTERNATIONAL MIGRATION AND INTENTIONS TO MIGRATE| 27
This downward trend, however, inverts from 2012 onwards as EU MS start issuing a growing number of new
residence permits. In 2016 the number of first residence permits reached 1.97 million, similar to the figure
reported in 2008 pre-crisis period. At the same time, the composition of these inflows has changed notably.
Family ties as main reason of migrating to the EU
The downward and upward trends that marked immigration in the pre- and post-2012 period brought about
another change, a partial shift in the type of migration channels employed by foreigners to enter the EU.
Family formation or reunification is the most relevant channel of entry to the EU throughout the entire
period, used by approximately one third of all non-EU immigrants. In 2016, 628,000 non-EU immigrants were
legally admitted to the EU on the grounds of family reunifications, representing 32% of all types of first
residence permits. At the same time, immigration for reasons of employment went through a major
transformation. Indeed, a steep decline in the number of work-related first permits began in 2010 as the
global crisis intensified, raising concerns about government solvency of some EU MS. Nevertheless, even
when EU economies started showing signs of recovery, the new authorizations to reside on employment
grounds continued to shrink. Work was the least deployed entry channel to the EU which accounted for only
13.2% of all first permits in 2016. On the contrary, the relevance of education-related inflows grew. Since
2011 education has become a more relevant entry channel than employment. Specifically, from 2013 student
immigration has risen, reaching the share of 21.3% of all first residence permits in 2016.
The category ‘other’ grounds emerges as an important channel of entry which in 2016 absorbed one third of
all first permits. This category however embeds a statistical issue linked to the fact that this is a highly
heterogeneous group which includes first permits for international protection, refugees, subsidiary
protection, unaccompanied minors, victims of human trafficking, pensioners and other residence-only
categories. While recognizing the weight of this group in the overall evolution of inflows, it is not possible at
this stage to draw any firm conclusions given the unclear and comparable statistical definition of this group.
The distribution of first residence permits issued on family grounds across MS (Figure 7) reveals that the
largest number were issued by 6 EU MS: France, Germany, Italy, Spain, Sweden and the United Kingdom. This
general pattern remained largely unchanged over time, although the relative weight of some MS did vary.
For example, there was reduction of family reunifications reported in the United Kingdom, while in Germany
the family reunification became a more relevant as channel of entry as its figures doubled going from 46,000
in 2008 up to 95,500 in 2016.
A more diversified picture emerges when looking at the breakdown of residence permits for family reasons
by country of origin (i.e. citizenship).

CHAPTER 2. TRENDS AND PATTERNS OF INTERNATIONAL MIGRATION AND INTENTIONS TO MIGRATE| 28
Figure 7 Distribution of first residence permits for family reasons by EU MS of destination (left) and by country of origin
11
(right).
Source: own elaboration based on EUROSTAT.
Since 2008, the highest share of family-related first permits were issued to Moroccans
12
(on average 10% of
all first permits issued on family grounds). The main EU destination of Moroccan family-related flows are the
South European MS, namely Spain, followed by France and Italy. Also migrants originating from India,
Ukraine, China and Albania are among nationalities that over time have had the highest shares (that have
remained very stable) in the overall number of first residence permits issued for family reasons in EU. Finally,
there is the case of Syrian immigrants: from a very low number of Syrians entering the EU for family reasons
before their share grew, in a very short time, to a relevant share 6% in 2016. The MS which have hosted the
greatest number of family-related inflows of Syrians are Germany and Sweden.
The inflow of migrants from 6 main countries of origin (Morocco, Syria, India, Ukraine, China and Albania)
accounted for around 30% of the overall number of first permits issued on family grounds during the
reference period. The remaining 70% is comprised of migrant inflows from – on average – 140 different non-
EU countries. Within this latter group, nationals from Algeria, Brazil, Pakistan, Russia, Turkey and the USA
received between 2.5-3.5% of the overall number first permits for family reunification in 2016.
Declining importance of work as an entry channel to the EU
The evolution of work-related inflows underwent significant changes. Over the nine-year period examined,
the number of first residence permits for employment (or remunerated activities) was cut by half, going from
half a million non-EU workers entering the EU in 2008 to some 260,000 in 2016.
11
Given the high number of different nationalities entering the EU, for the purposes of visual clarity the right graphs in Figure 7, Figure 8, and Figure
9 plot separately i) each non-EU nationality which received more than 3.5% of the total of first permits in 2016; ii) a group of non-EU nationalities
which received between 2.5% and 3.5% of the overall authorizations respectively; and iii) a group of non-EU nationalities whose share was lower than
2.5%.
12
Only in 2016, around 75% of all inflows from Morocco was for family reasons.

CHAPTER 2. TRENDS AND PATTERNS OF INTERNATIONAL MIGRATION AND INTENTIONS TO MIGRATE| 29
This decline in inflows directed at EU labour markets also showed a change in the distributional pattern of
first permits among MS (Figure 8). Firstly, it is noticeable that the period 2008-2011 was characterized by a
prevalence of new work authorizations issued by the United Kingdom, Italy and Spain that represented 78%
of all work-related permits. In the following years, the share of first permits for work issued by Italy and Spain
began to reduce. A drastic decline can be seen in the Italian case where the inflow of migrant workers went
from representing 42% of all work-related entries to the EU in 2010 to effectively disappearing in 2016 with
less than 1%. At the same time, Poland and the Czech Republic became increasingly important destination
for non-EU workers reaching 10% and 8% of all first permits for work respectively in 2016. Other countries,
such as Germany
13
and France also increased slightly their relative weight in EU work-related inflows
reporting, however, shares below 10%.
Figure 8 Distribution of first residence permits for work reasons by EU MS of destination (left) and by country of origin (right). Source:
own elaboration based on EUROSTAT.
On the other hand, the national composition of workers that migrated to the EU during the 2008-2016 period
did not undergo any major changes. Since 2008, the share of Ukrainian, Indian and US American workers
entering the EU has been increasing. In 2016, these three nationalities were the major non-EU groups
receiving first work permits. The relative importance of work channel for Ukrainians has grown since 2014
with flows directed mainly to Poland and to the Czech Republic. An interesting case is also that of workers
arriving from the USA whose relative share has shown a considerable increase since 2008, reaching 10% in
2016.
The high share of migrant workers arriving from India, Ukraine and the USA are followed by high inflows from
Australia, Russia and China. Throughout the considered timeframe, the share in the overall number of work-
related first permits of these 6 nationalities grew significantly increasing from 35% in 2008 to 50% in 2016.
The remaining share of first permits for work was issued to a high number of different nationalities, on
13
It should be pointed out that Germany issued also a relevant number of first permits under ‘other’ reasons. Only in 2016 the number of such
permits issued by Germany reached 200,000.

CHAPTER 2. TRENDS AND PATTERNS OF INTERNATIONAL MIGRATION AND INTENTIONS TO MIGRATE| 30
average around 140. Among this latter group, nationals from Brazil, Morocco and the Philippines obtained
between 2.5-3.5% of work-related first residence permits in 2016.
United Kingdom and France are the most attractive destinations for international students
Since 2013, the number of international students coming to the EU has increased sharply. Between 2013 and
2016 the number of first residence permits for education purposes went from 234,000 to 420,000. This
growth interrupted a period of relative stagnation (2008-2011) and decline (2011-2013) in attracting non-EU
nationals to study in the EU. The European student market is mainly dominated by the attraction power of
the United Kingdom, making it the main destination of education-related inflows in the EU. This does not
come as a surprise, given that the United Kingdom, together with the USA, affirmed itself globally as the most
attractive destination for international students. United Kingdom hosted on average 63.8% of all non-EU
student inflows in the period 2008-2016, followed by France’s average share of 16.8%. The weight of the
remaining 26 MS did not exceed one quarter of all education-related inflows.
Figure 9 Distribution of first residence permits for education reasons by EU MS of destination (left) and by country of origin (right).
Source: own elaboration based on EUROSTAT.
The distribution of student permits by nationality of the beneficiaries points to three main origin countries:
China, USA and India. Chinese, Americans and Indians accounted between 35-40% of the total number of
international students in the EU since 2008. In particular, the Chinese are the most numerous entering the
EU for education purpose despite the fluctuating shares in the overall number of first permits. Chinese
students opt to study mainly in the United Kingdom and, to a much smaller extent, in France. At the same
time, the number of USA students entering the EU – and mainly the United Kingdom - has increased notably
since 2015. The remaining large share (around 60%) of education-related first permits were issued, on
average, to some 142 different non-EU nationalities. In specific, Japanese, Russians and the nationals of the
UAE held between 2.5-3.5% of education-related first residence permits in 2016.

CHAPTER 2. TRENDS AND PATTERNS OF INTERNATIONAL MIGRATION AND INTENTIONS TO MIGRATE| 31
Asylum seekers represent a growing share of migrant stocks and flows
Migration is not always the result of a voluntary decision to move abroad to improve living conditions, get a
degree from a foreign university, join a family member, or to work abroad. Hundreds of thousands individuals
annually are forced to leave their homelands fleeing military conflicts or persecutions. The number of
refugees has increased by a factor of ten over the considered period: from 170,000 in 1960 to 17.9 million in
2016.
The chart in Figure 10 demonstrates the evolution of the stock of refugees in absolute terms relative to the
total stock of international migrants. While quite modest in the mid-60s, the number of refugees started to
grow rapidly, reaching 14.7 million in the 1990s. After a decline between the 1990s and turn of the
millennium, the number of refugees started to grow again, exceeding 15 million in 2015. The share of
refugees in the total stock of migrants peaked in 1990 and 2015. The chart on the right shows that between
2000 and 2017 the share of asylum seekers in the total flow increased over time, and in 2015 accounted for
approximately one fifth of the total flow.
Figure 10 Refugees and asylum seekers in absolute and relative terms in respect of migration stocks and flows
14
. Source: own
elaboration based on UNHCR, UNDESA, WB, and Abel (2017).
Two decades ago, the majority of asylum seekers were heading towards North America. The continent has
conceded its leading position, first to Africa and then to Europe. The recent refugee crisis altered the
destination of flows, making Europe the continent where the largest number of asylum applications are
registered. Europe is currently receiving almost half of total asylum applicants (42.3%in 2016), followed by
Africa, Asia and Northern America, each receiving 17-18% each. The majority of the current flow of asylum
seekers comes from Asia (52.0%), followed by Africa (31.0%) and Latin America (12.6%). While more than
half of African asylum seekers remain within the continent (54.3%), one third of them reaches Europe. Exactly
14
The figure reports for the sample of country pairs for which information on refugees and asylum seekers is available and it is therefore not
representative of all the stock and flows.

CHAPTER 2. TRENDS AND PATTERNS OF INTERNATIONAL MIGRATION AND INTENTIONS TO MIGRATE| 32
the opposite is observed for Asia - more than half of Asian asylum seekers reach Europe (53.1%) and one
third remains within the continent. The vast majority of Latin American asylum seekers lodge their application
in North America. Overall, Europe is currently an important destination mostly for African and Asian asylum
seekers.
Asylum seekers head toward destinations offering better economic opportunities
As in the case of migration in general, humanitarian migrants tend to seek asylum in countries offering similar
or better economic conditions.
High income countries were and continue to be the main destination for asylum seekers. In 2016, the vast
majority of asylum seekers from high (94.1%) middle (70.0%) and low (41.83%) income countries applied for
asylum in a high income country. Middle income countries received smaller share of asylum seekers from
middle (29.6%) and low (46.8%) income countries. Only, 11.6% of refugees from low income countries
applied for asylum status in a low income country.
Individual intentions to migrate
The discussion above relies on aggregate data and presents a snapshot of migrant population across large
geographic areas and income group countries. It is based on actual moves measured through flows and stocks
information. In other words, we observe ex-post the intentions to migrate once these materialise in
aggregated migration flows. Though remaining an important source of information data on stocks and flows,
they do not allow us to measure the intentions to migrate in origin countries, and hence anticipate the
characteristics of potential migrants. In this respect, the Gallup survey provides an opportunity to measure
both the desire and preparation to migrate worldwide.
In this survey, there are two questions used to measure the desire and preparation for migration:
Migration desire: Ideally, if you had the opportunity, would you like to move permanently to another country,
or would you prefer to continue living in this country?
Migration preparation: Have you done any preparation for this move?
15
.
Figure 11 presents the share of population that expresses the desire to migrate (Migration desire) and the
share of those who undertook concrete actions to fulfil these desires (Migration preparation). Both indicators
are presented first by large geographic areas and then by country classification adopted in this study: high,
middle and low income countries.
15
Asked only of those who are planning to move to another country in the next 12 months.

CHAPTER 2. TRENDS AND PATTERNS OF INTERNATIONAL MIGRATION AND INTENTIONS TO MIGRATE| 33
Figure 11 Intentions to migrate by large geographic areas and income groups. Average for 2010-2015. Source: own elaboration based
on Gallup World Poll.
At global level 21.4% of the surveyed population expresses willingness to migrate, but only 1.1% actually
prepares to do so. The desire to migrate is highest in Africa and Latin America - more than a quarter of
respondents would like to move permanently to another country. These continents have the highest share
of those who are also willing to undertake concrete actions to fulfil this desire (1.7% of total surveyed
population and 6.4% of those who desire to migrate). The share of those willing to migrate is lowest in North
American and Oceania (10 and 11%). However, among those who express willingness to migrate in Oceania,
the share of those who are preparing to migrate is the highest (7.7%). The percentage of those who actually
migrate is highest for Oceania too: the annual emigration flow is equivalent to approximately 0.18% of its
population. For comparison, the annual emigration flows for Africa and Europe are 0.12 and 0.14% of the
respective populations.
The share of those who would like to migrate is highest for low income countries and lowest for high income
countries, 18 and 27% respectively. For all three groups of countries, the share of those who expressed their
desire to migrate is significantly higher than the share of those who are preparing to migrate. In high income
countries, only 4% of those who wished to migrate are actually preparing to do so. The figure is higher for
middle and low income countries 6%. Low income countries in addition to having the highest share of those
who would like to and prepare to migrate, have the highest emigration rate. The annual emigration flow is
equivalent to approximately 0.14% of the population, compared to 0.09% for middle and high income
countries.
Conclusion
The descriptive analysis presented in this chapter reveals several patterns of international migration.
First, although the total number of international migrants increased significantly over the recent decades, at
the global level the percentage of population living abroad remained relatively stable oscillating around 3%.

CHAPTER 2. TRENDS AND PATTERNS OF INTERNATIONAL MIGRATION AND INTENTIONS TO MIGRATE| 34
This points to the fact that the increase in the number of migrants is explained by the demography
(population growth) and not by an increase in intensity.
Second, international migrants tend to stay within their continent of origin. Intracontinental flows were and
remain predominant in international migration accounting for more than half of global numbers.
Third, migration towards wealthier economies was prevailing both in 60s and in more recent period. Only
negligible part of international migrants resided in countries from a lower income group. In the recent period
this pattern has been further reinforced. This is true also for humanitarian migrants. Those fleeing conflicts
and persecutions seek asylum in countries offering similar or better economic conditions.
Fourth, the descriptive analysis of EU first residence permits demonstrates how work, education and family
reunification related migration respond differently to economic crisis in destination countries. In specific,
since 2008 - the first year for which the data is available - immigration for work reasons has reported a decline
without showing relevant signs of recovery yet. This downward trend in work-related immigration was
followed by a partial change of main destination countries and it affected foreign workers coming from both
middle and high income countries. On the other side, family-related inflows appeared to be more resilient to
economic shocks. Family reunification affirmed itself as the prevalent type of immigration and it appears to
be especially relevant for inflows originating from middle income countries. Finally, immigration for
education purposes appears to be largely determined by the attracting power that countries have on the
international student market.
While many wish to migrate only few are undertaking concrete action to fulfil this desire and even fewer
actually migrate. At global level the annual migration flow is equivalent to 0.10% of world population. This
figure while constant over time varies significantly across continents and income groups.
While providing a detailed description of trends and patterns of international migration the chapter does not
analyse its drivers. The following chapter presents an in-depth analysis of drivers of international migration.

CHAPTER 2. TRENDS AND PATTERNS OF INTERNATIONAL MIGRATION AND INTENTIONS TO MIGRATE| 35
Chapter 3. International Migration Drivers: an empirical investigation
by
Silvia Migali
This chapter provides an empirical investigation of the drivers of international migration, for different
dimensions of migration. The first part of the chapter offers a brief overview of the drivers of international
migration considered in the empirical analysis, drawn from existing economic research from recent decades.
It then relates these to the ultimate objectives of the study. When analysing migration movements at the
country-level (i.e. between countries), the aim is to provide an indication of direction of the relationship
between migration and the drivers, and to assess the relative importance of the drivers. When zooming in on
individual intentions to migrate, the aim is to highlight the demographic and socio-economic characteristics
making individuals likely to express an intention to migrate. The second part of the chapter shows the results
of the empirical analysis of the drivers for different dimensions of migration, concentrating specifically on (i)
general international migration movements, by income level of the country of origin over the period 1980-
2015 (ii) different legal channels of migration of Third Country Nationals (TCNs) to the EU28, from 2009 to
2016; (iii) asylum applications, covering the years 1999-2016; (iv) individual intentions to migrate, focusing
on 2010-2015.

CHAPTER 2. TRENDS AND PATTERNS OF INTERNATIONAL MIGRATION AND INTENTIONS TO MIGRATE| 36
Introduction
Answering the question of what drives international migration is a complex task. Even if the answer may
appear straightforward (i.e. that people move to seek better life opportunities elsewhere), the scientific
community has struggled to reach consensus on ways of understanding the drivers of international migration
for decades
16
.
In this context, the aim of the IMD report is to provide empirical evidence on the drivers of different
dimensions of international migration. The analyses presented in this study provide policymakers with an
analytical framework that pulls together and makes sense of most of the existing data on migration. Most
importantly, and as it will be discussed in Chapter 6, it provides the basis for forward-looking considerations
on the likely evolution of future migration patterns.
The first part of this chapter is dedicated to an overview of the drivers of international migration. The second
part illustrates and discusses the results of the empirical analyses.
What drives international migration?
The structural drivers of migration: economic factors and beyond
The drivers of migration include several characteristics of the migrants’ countries of origin and destination
17
that either facilitate or discourage international migration movements between them. These variables
include the characteristics of a country of origin which may affect levels of emigration, bilateral relations
between countries which may affect the direction of migration, and the features of destination countries
which either attract or discourage immigration to them. The choice of the variables used in the empirical
analyses of this report is inspired and motivated by economic research from the last decade
18
. In particular,
we focus on the structural factors of the countries of origin and destination, such as their socio-economic
and demographic characteristics. However, the choice of the drivers was also affected by technical
considerations, in particular data availability and quality. As a result, data gaps across countries and time
meant that some variables could not be considered.
First, the empirical analysis comprises a set of economic characteristics capturing the economic development
of a country as well as its labour market conditions. Differences in economic opportunities between the origin
and the destination countries are crucial drivers of international migration movements (Ortega and Peri
2013). More precisely, they include GDP per capita and its growth, as well as unemployment rates
19
(Beine,
Bourgeon, and Bricongne 2017; Mayda 2010; Ortega and Peri 2013; Migali 2018).
Second, the existence of networks is commonly considered one of the most relevant facilitators of
international migration (Beine, Docquier, and Özden 2011; McKenzie and Rapoport 2010; Pedersen,
Pytlikova, and Smith 2008). A proxy for networks is the presence in the destination country of immigrants
from the same origin.
16
For a discussion on the academic research on migration theories and drivers, see Chapter 1.
17
Or sending and host countries, respectively.
18
For a review, see for instance, (Ferrie and Hatton 2015; de Haas et al. 2018).
19
Further details om the variables are given in the Data Annex.

CHAPTER 2. TRENDS AND PATTERNS OF INTERNATIONAL MIGRATION AND INTENTIONS TO MIGRATE| 37
Third, education levels in the country of origin are also factors shaping international migration patterns
20
(Dao et al. 2018; Docquier and Rapoport 2012; Grogger and Hanson 2011). Overall, emigrants tend to be
among the most educated and the youngest individuals in the adult population. This report uses government
expenditure on education as a proxy for the education level in the country of origin
21
. To measure the
dynamics of the population in the country of origin and its relation with emigration, total fertility rates are
used
22
.
Fourth, the empirical analysis also takes into account trade relations between the origin and destination
countries (Campaniello 2014; Lanati and Venturini 2018), as well as geographic and cultural factors such as
the physical distance between origin and destination countries, their colonial ties, and the fact of sharing the
language (Adserà and Pytliková 2015; Belot and Ederveen 2012; Lanati and Venturini 2018).
Fifth, when analysing the factors driving people to seek asylum, our study considers the presence of state
fragility and the occurrence of armed conflicts and violence (Hatton 2004; Hatton 2009; Hatton 2016;
Morrison-Métois 2017; Melander and Öberg 2007; Neumayer 2004).
Finally, our analysis also includes factors relating to country of origin, country of destination, and continuities
over time. In other words, in addition to the variables described above we control for the characteristics of
sending and receiving countries which do not change over time and the shocks common to all countries in a
given period.
It should be noted that, due to different scale and focus of analyses, different drivers are considered when
focusing on intentions to migrate. These are: individual demographic characteristics, including age, gender,
marital and family status, being a migrant, and having international connections of friends and family abroad
(Docquier, Peri, and Ruyssen 2014; Dao et al. 2018; Manchin and Orazbayev 2016; Bertoli and Ruyssen 2016);
individual socio-economic characteristics, including education level (Borjas 1987; Grogger and Hanson 2011),
labour market status and wealth.
Dimensions of migration, country and individual perspectives
The analysis centres on four dimensions of migration
23
. Empirical analyses are carried out separately for each.
The first three sets adopt the country perspective. This focuses on migration flows between given countries
of origin and given destinations
24
. The last instead focuses on the individual perspectives, by analysing the
drivers of individual intentions to migrate.
20
It should be remarked that, for simplicity’s sake, this report does not look specifically at the migration of the high-skilled individuals nor at the
related brain-drain and brain-circulation phenomena.
21
Other education-related statistics, such as enrolment rates in tertiary education, would be better proxy for the country education level. However,
those variables cannot be used in a global level study due to data limitations.
22
It should be noted that the economic, demographic and education factors are interrelated. Indeed, they capture different stages of economic
development. For instance, high education levels correlate with low fertility, which in turn tend to be associated to economic development. This
implies that the results from the empirical analysis may not be able to clearly distinguish between them. In the same vein, variables related to the
urbanization level of the country of origin are highly correlated to the demographic ones. Hence, demographic and urbanization related drivers should
not be included in the same models.
23
The distinction among dimensions of migration is mainly data-driven. As it will be further discussed in Chapter 6, the distinction among general
migration, regular channels to migrate, asylum related migration does not necessarily mirror the real motivations behind the migration decision.
24
Due to data constraints, it is not possible to adopt more disaggregated geographical areas as unit of analysis of migration movements (such as
migration from rural areas, cities, or regions).

CHAPTER 2. TRENDS AND PATTERNS OF INTERNATIONAL MIGRATION AND INTENTIONS TO MIGRATE| 38
Specifically, the first analysis focuses on the drivers of general migration flows
25
, for all the countries in the
world for which data is available. Importantly, we distinguish between several stages of economic
development. To do so, the countries of origin are grouped according to their income level. The choice of
income level groups is motivated not only by theoretical considerations
26
, but also by practical needs.
Policymakers who seek to anticipate the possible evolution of migration movements from a given origin
country should not disregard its actual economic development. The second analysis zooms in on the drivers
of the legal channels used by Third Country Nationals to the EU. Recent data on residence permits
27
allow us
to distinguish between different channels to enter and stay in the EU. These are residence permits granted
for family formation and reunification, work, and education-related reasons. The third set takes asylum
applications as a proxy for an analysis of the drivers of forced migration.
The empirical analyses for the three dimensions of migration are based on a so-called augmented gravity
model. This is commonly used in migration studies to estimate the drivers of migration from historical data
(the details on the models are given in the Methodological Annex). The gravity models offer multiple angles
on international migration. First, they measure the relative importance of push factors, the characteristics of
a country of origin (such as its demographic and economic conditions) affecting migration out of the country.
Second, they look at the pull factors, which are features of the destination countries which either attract or
discourage immigration, such as their economic and labour market situation. Third, they include bilateral
drivers like trade relations between the origin and destination countries.
Our approach enables us to provide information on both the relative importance of each driver and the
direction of its influence on migration (defined as its sign). The relative importance refers to the ranking of
the drivers considered for each dimension of migration, showing which are more and which are less relevant
in each case. The sign refers to the positive or negative relationship between the driver and migration
movements. In other words, a negative sign is associated with decreasing levels of migration and a positive
sign with increasing levels of migration.
It should be noted, however, that the analysis does not take into account the effects of policy changes and
climate variations on international migration movements. This is due to several reasons, in particular the
complexity of measuring policy effects and climate changes, as well as a lack of comprehensive data across
countries and time. This constrains the possibility of taking them into account
28
. Existing studies tend to look
at the effects of policy and climate changes as drivers of migration by focusing either on limited groups of
countries or on specific policies
29
. To do so here would go against our aim of having truly global coverage.
Additional difficulties also arise in the case of policy changes. The implementation of a new policy may be the
result of increased migration flows to a country. This entails a reverse effect, where the policy is a response
rather than a driver of migration. Because of these methodological and conceptual difficulties, Chapter 4 and
Chapter 5 will complement the empirical analysis with a more comprehensive investigation of the effects of
policy and climate changes on international migration movements.
25
This set based on estimates of migration flows provided by (Abel 2017). Migration flows are derived from World Bank and UNDESA data on the
stocks of immigrant population by country of origin.
26
For a discussion, see Chapter 1.
27
The Data Annex provides more details on Eurostat data on residence permits.
28
However, the effect on migration of country-specific climatic and policy characteristics that have not changed over time is controlled for in the
empirical analyses.
29
See, for instance, Ortega and Peri (2013), for the effects of policies; Beine and Parsons (2015) for climate change. Additional references are given
in Chapter 4 and Chapter 5.

CHAPTER 2. TRENDS AND PATTERNS OF INTERNATIONAL MIGRATION AND INTENTIONS TO MIGRATE| 39
The last set of analyses explores the individual dimension of migration. It is based on a global survey of
intentions to migrate
30
. As for the case of general international migration movements, we distinguish
between several stages of economic development. To do so, the countries of origin of the survey respondents
are grouped according to the same income level groups adopted in the analysis of general migration. The
empirical analysis of individual intentions to migrate is derived from a range of models different from those
used for the country-level analyses (for the explanation, see the Methodological Annex). Hence, they provide
slightly different information than the previous ones. Their aim is to highlight the demographic and socio-
economic characteristics making individuals likely to express an intention to migrate. To do so, they give the
odds of the intention to migrate of individuals that belong to a particular demographic or socio-economic
group (e.g. the tertiary educated) when compared to the odds of the intention to migrate of individuals
belonging to a comparison group (e.g. the primary educated).
The limitations of our empirical approach stem from two issues. First, the relationships underlying the results
should be interpreted as correlations, rather than as causal relationships. Feedback (or reverse) effects
between migration movements and drivers cannot be excluded. For example, we consider trade relationships
as determinants of migration
31
. However, migration movements between countries also trigger trade
relations between them
32
. A second issue stems from the fact that some of the possible migration drivers are
not considered in our analysis due to data limitations or conceptual issues. For instance, our analysis does
not investigate the role of official development assistance (ODA) among the determinants of migration. There
is currently no clear-cut evidence or consensus on the effects of ODA on international migration
33
. A focus
on country-specific case studies would be more appropriate to assess the effect of receiving development
assistance on individual decisions to migrate than the cross-country international perspective that we have
adopted here.
Drivers of general international migration
The first set of analyses focuses on the drivers of international migration movements in general. Specifically,
it is based on estimates of migration flows over 5 year periods derived from World Bank and UNDESA
migration stock data (Abel 2017). The analysis considers 143 countries of origin, which are grouped according
to their income level (low, middle, high income), as well as 165 destinations. The income level classification
used in this report situates relationships between drivers and changes in migration in the context of the
economic development of origin countries
34
. The period covered in the analysis is 1980-2015. The gravity
models used for the empirical analysis are presented in the Methodological Annex. Figure 12 below shows
the results from the models.
30
Specifically, this set of analyses uses the Gallup World Poll Survey data. A brief description of intentions to migrate based on Gallup is provided in
Chapter 2.
31
Similar arguments can be done for the role of remittances which may constitute both an outcome and a facilitator of immigration.
32
See, for instance, Egger, von Ehrlich, and Nelson 2012. However, this issue is mitigated by using past values of the drivers (such as past volumes of
trades) which are not affected by current migration movements.
33
Indeed, ODA may alleviate poverty thus enabling people to migrate (Clemens and Postel 2017). On the contrary, according to Lanati and Thiele
(2017), emigration tends to diminish from countries receiving assistance.
34
The income level classification used in this report and the list of countries included in each of the groups are provided in the Methodological Annex.

CHAPTER 2. TRENDS AND PATTERNS OF INTERNATIONAL MIGRATION AND INTENTIONS TO MIGRATE| 40
Figure 12 Drivers of general international migration. Notes. The chart shows the drivers of general international migration
movements. The drivers are provided for three groups of origin countries- low, middle and high income. The bars are the standardized
regression coefficients from the gravity model. The colour of the bars indicates the direction of the relation between the driver and
migration. The length of the bars indicates the relative importance of the driver.
Low income countries of origin
For this group of countries, the presence of previous migrant communities in the host country is the most
relevant driver. These are the so-called network effects. They can foster migration in different ways, such as
reducing the costs of moving to a new country (both monetary and non-monetary), providing support to
newly arrived migrants (such as finding accommodation), and easing the integration process in the labour
market (Rapoport 2016; Beine, Docquier, & Özden, 2011).
High total fertility rates in countries of origin are associated with low emigration. The negative association
between the total fertility rates and emigration means that a reduction in fertility is associated with an
increase in emigration. This result can be explained by the fact that countries with relatively high fertility are
generally those in the first phase of demographic transition and with lower socio-economic development (R.
Lee 2003). A decline in fertility is usually accompanied by increasing education levels and economic
development. This, in turn allows more people to have the economic means to move to another country.
Low GDP per capita, low education levels and high fertility levels in countries of origin all describe an early
stage of socio-economic development. Due to the inter-connectedness of these variables, it is difficult to fully
disentangle the relationships between them through our model. This may explain why GDP per-capita at
origin is not statistically significant and the importance of education is relatively small when compared to
other studies in the literature (Grogger & Hanson, 2011; Dao, Docquier, Parsons, & Peri, 2018). GDP per

CHAPTER 2. TRENDS AND PATTERNS OF INTERNATIONAL MIGRATION AND INTENTIONS TO MIGRATE| 41
capita and education may be shown to have negligible influence on migration flows, as their effect could be
partly captured by the fertility rate.
Favourable economic conditions in destination countries attract migration from low income countries. The
analyses also take into account geographical and cultural factors (the table with the all these factors included
in the model is in the Methodological Annex). In particular, the existence of bilateral trade relations
35
between them is positively associated with international migration, while the geographical distance deters
movements.
Middle income countries of origin
Network effects, as well as economic factors, are the main drivers of migration out of the middle income
countries. The positive sign of GDP indicates that improving economic conditions in middle income countries
of origin are associated with increasing emigration from that country. This is consistent with theories on
mobility transitions and the 'migration hump' which describe an inverse U-shaped relation between
migration and development. In other words, migration first increases and then decreases with economic
development (Clemens 2014b; Zelinsky 1971; Skeldon 2012). As for low income countries, fertility at origin
is negatively associated with emigration (i.e. higher fertility levels are associated with less international
migration). However, the importance of this in middle income countries is less than in low income countries.
This indicates that the relationship between fertility and migration becomes less significant as a country's
wealth increases
36
. From the perspective of countries of destination, it should be noted that economic growth
tends to lead to higher levels of immigration.
Despite being recognised in the literature among the most relevant explanations of migration
37
, the relative
importance of education is relatively small. Given the relationship between GDP per capita and education,
the GDP might, at least in part, capture the positive association between education and migration.
High income countries of origin
Networks and economic conditions are the most relevant drivers of migration from high income countries.
In contrast to the other country groups, the relationship between GDP per capita at origin and migration is
negative. Better economic conditions in sending countries are associated with lower emigration. This further
supports the inverse U-shaped relation between development and migration mentioned above. Changes in
the fertility rate are not statistically significant in high income countries, especially those in the second
demographic transition with relatively low and stable fertility rates. Positive economic conditions in the
destination country, though relatively less important when compared to other drivers, tend to attract
migration from high income countries.
Different channels for migrating to the EU: family, work and education
The second set of analyses zooms in on the drivers of different channels of migration of Third Country
Nationals to the EU, in particular permits for family formation and reunification, work and education.
Specifically, it is based on Eurostat annual data on residence permits for the EU28 Member States. The
analysis includes more than 140 countries of origin as well as the EU28 Member States as destinations. The
35
Importantly, the relation between trade and migration should be interpreted as correlation, rather than as causal effects. The direction on the
correlation is still unclear: some papers find that migration fosters trade (see, among the others, Egger, von Ehrlich, & Nelson (2012) while more
recent contributions find that are instead trade relationships that increase migration Lanati and Venturini (2018).
36
This is consistent with further JRC analyses (Grapsa 2018).
37
See, for instance, Docquier and Rapoport (2012).

CHAPTER 2. TRENDS AND PATTERNS OF INTERNATIONAL MIGRATION AND INTENTIONS TO MIGRATE| 42
gravity models used for the empirical analysis are presented in the Methodological Annex. Figure 13 below
shows the results from the model.
Figure 13 Drivers of channels of migration to the EU: family, work and education. Notes. The chart shows the drivers of different
channels of migration to the EU. The bars are the standardized regression coefficients from the gravity model. The colour of the bars
indicates the direction of the relation between the driver and migration. The length of the bars indicates the relative importance of
the driver.
This set of analyses suggests that the influence of the drivers varies according to the legal channels through
which people migrate to the EU
38
.
Family migration
Family reunification is by definition, dependent on the presence of family members already in the EU. As
should be expected, the family channel is driven by the presence of previous migrant communities from the
same origin in the destination country. Moreover, it should also be noted that GDP per-capita in countries of
origin is also positively associated with the decision to migrate to the EU for family related reasons.
Work-related migration
The presence of previous migrants from the same origin country is also the most significant driver of labour
migration to the EU, even though its relevance is lower than in the case of family migration. The empirical
analysis does not capture any significant relationship between economic conditions in countries of origin and
people migrating with work-related residence permits (unemployment rates in destination countries actually
38
The effect of policy changes on the different channels of migration to the EU is also investigated by using alternative specifications of the model.
The alternative models are briefly discussed in the Methodological Annex.
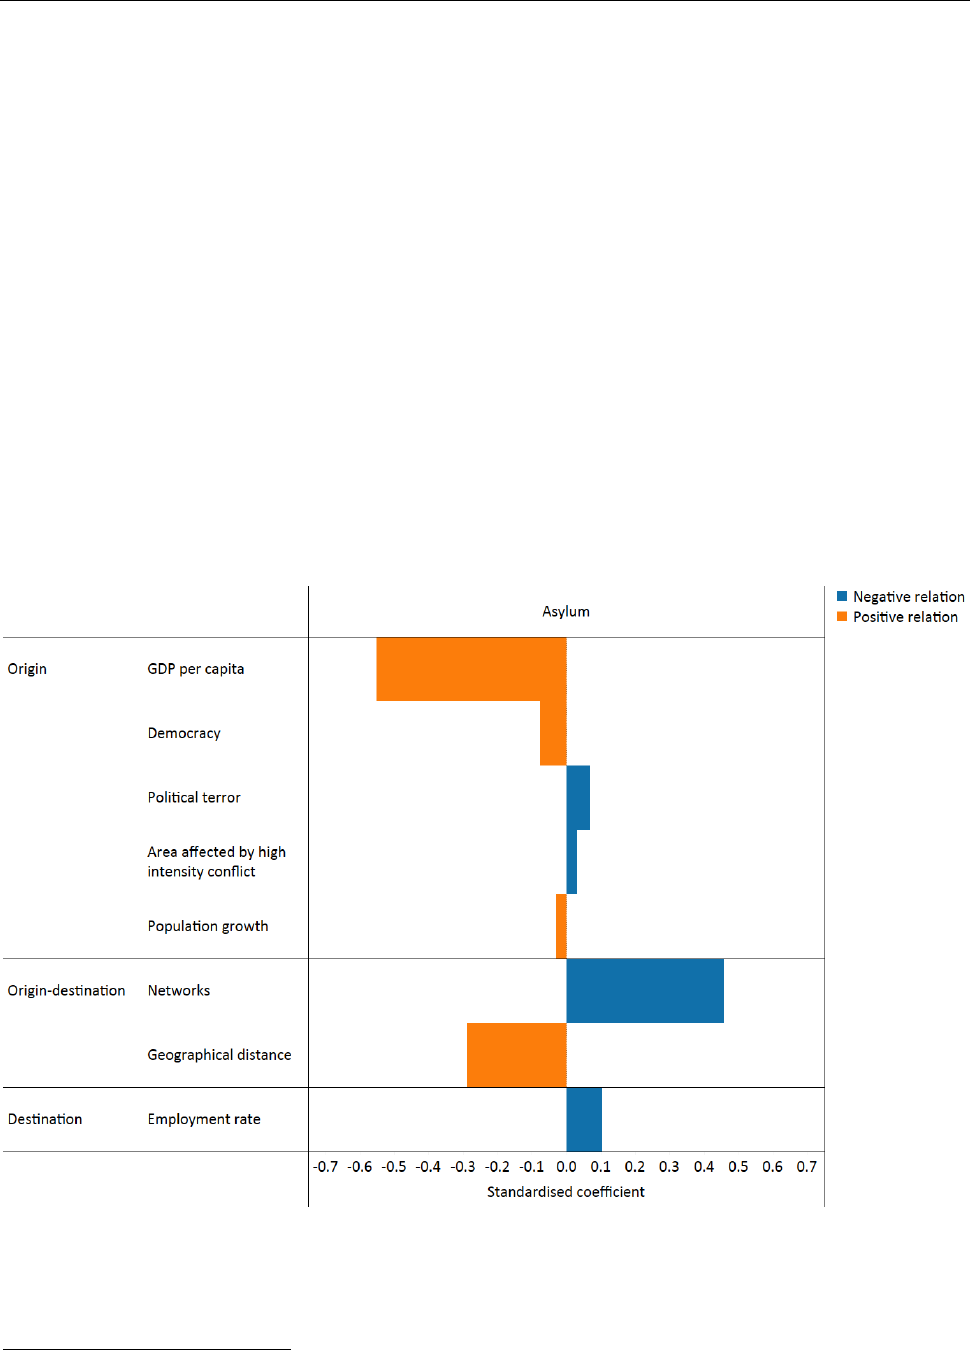
CHAPTER 2. TRENDS AND PATTERNS OF INTERNATIONAL MIGRATION AND INTENTIONS TO MIGRATE| 43
have a negative sign), but does find that favourable labour market conditions in destination countries in EU
are associated with a higher proportion of new residence permits for work-related reasons. This also means,
inversely, that relatively high unemployment levels in potential destinations discourage migration. The
geographical distance between the origin and the destination country remains a factor hindering the
movement of workers.
Migration for education
Migration to the EU for education purposes is also associated with the presence of previous migrant
communities in destination countries
39
. However, this is not the only driver. As with work-related migration,
the unemployment rate in the destination country and the geographical distance between countries of origin
and destination negatively correlate with new residence permits for educational reasons.
Drivers of asylum applications
The third set of models analyses the factors leading people to seek asylum outside of their country of origin.
The analysis is based on UNHCR data on first asylum applications from about 140 countries lodged in both
European and non-European countries over the period 1999-2016. The gravity model is presented in the
Methodological Annex, Figure 14 shows the results.
Figure 14 Drivers of asylum applications. Notes. The chart shows the drivers of asylum applications. The bars are the standardized
regression coefficients from the gravity model. The colour of the bars indicates the direction of the relation between the driver and
migration.
39
This is in line with the literature on the drivers of student immigration to OECD countries (Beine, Noël, and Ragot 2014).

CHAPTER 2. TRENDS AND PATTERNS OF INTERNATIONAL MIGRATION AND INTENTIONS TO MIGRATE| 44
Importantly, the analysis includes a range of variables that attempt to measure the intensity of armed
conflicts and their geographical scope
40
. In addition, and most importantly, we also try to capture state
fragility and violence, as well as the presence of political instability in non-conflict affected areas. Attempting
to measure different dimensions of state fragility and violence is fraught with complexity in accordance with
empirical research on asylum
41
. They are often not directly related to recognised armed conflicts, consistent
data on them is lacking and collecting new data is challenging. Nevertheless, our model is able to incorporate
different forms of state fragility, in particular the intensity of terror and human rights abuse committed by
the state (Political Terror Scale) and an indicator for the democracy. When interpreting the results of this
model, it should be noted that the relative importance of the drivers should be assessed only for the
continuous variables (such as GDP, percentage of area affected by conflict, networks). The categorical
variables (i.e. the indicators of political terror scale and democracy) are hardly comparable to the continuous
ones.
The results confirm that the presence of high intensity conflicts as well as the geographical scope of high
intensity conflicts are relevant drivers of new asylum applications
42
. State fragility in the country of origin not
necessarily related to armed conflicts also creates the conditions for people to move to another country and
seek asylum.
The above results were to be expected, but it should be noted that other drivers were also shown to be
significant as well. Economic factors, especially the conditions in countries of origin, were also found to be
relevant drivers of asylum applications. The results indicate a negative relationship between GDP in the
country of origin and asylum applications (i.e. lower GDP levels are associated with higher levels of people
seeking asylum). This suggests that decisions to seek asylum are also influenced by unfavourable economic
conditions and poverty as well as facing situations of danger. This can be explained by the way that economic
and armed-conflict, as well as economic and state fragility are highly interrelated factors. Prolonged violence
and state-based armed conflicts produce poverty. Hence, the negative association between the economic
conditions in countries of origin and asylum claims may be conflated by the fact that GDP captures most of
their ‘combined’ effects.
As for the previous sets of models, the presence in the destination country of previous migrant communities
is also among the most relevant pull factors for people seeking asylum. Members of the same community
already established in the host country can reduce the risks and the cost of migration by offering support to
the newly arrived.
Drivers of individual intentions to migrate
This section focuses on the individual dimension of international migration. It shows the drivers of individual
intentions to migrate, defined as both expressing a desire to move abroad and undergoing actual
preparations for moving. The results are based on the Gallup World Poll Survey (see Chapter 2 for a
description), for the period 2010-2015. They include more than 140 countries that are grouped according to
our income level classification. Further details on the model are provided in the Methodological Annex.
40
We follow the definition of conflict and conflict intensity used by the Uppsala Conflict Data Program. The definitions of the other variables are given
in the Data Annex. Further details will be also provided by additional JRC analyses (Conte and Migali n.d.).
41
See, for instance, (Davenport, Moore, and Poe 2003; Hatton 2016).
42
This is consistent with the literature (Neumayer, 2004; Thielemann, 2004; Timothy J. Hatton, 2009b; Timothy J. Hatton 2016).

CHAPTER 2. TRENDS AND PATTERNS OF INTERNATIONAL MIGRATION AND INTENTIONS TO MIGRATE| 45
Migration desire
The desire to move to a different country can be interpreted as being dissatisfied with life or a simple wish
to access better opportunities elsewhere (Carling and Collins 2018). As shown in Chapter 2, low and middle
income countries have the highest proportion of the population that wishes to move abroad.
Figure 15 Drivers of migration intentions: migration wish. The bars indicate the odds ratios. The odds ratio is the odds of the wish to
migrate given the fact that an individual belongs to a particular group (e.g. males), compared to the odds of the wish to migrate of
an individual in the comparison group (e.g. females). An odds ratio greater than 1 (blue bars) means that an individual in the
considered group has higher odds of the wish to migrate than the one in the comparison group. Odds ratios smaller than 1 (orange
bars) indicate lower odds.
The profile of those wishing to migrate
Regardless of the income level of the respondents, the older the individuals, the lower their likelihood to
express a wish to migrate (Figure 15). The youngest (those aged 15-19), are most likely to want to move away
from their place of birth. Males are also more likely than female to express a wish to move abroad. Single
individuals, as well as those having children are more likely to wish to migrate when compared to married
individuals and to those with no children, respectively. As also clearly emerges from the previous sets of
models, having international connections, like parents or friends, strongly influences the desire to move
abroad. Moreover, immigrants in the origin country are more likely to express their wish to move abroad
compared to individuals born there.
High-skilled individuals holding either secondary or tertiary education are more likely to express a wish to
migrate than those who have only completed primary education. The unemployed tend to desire more than

CHAPTER 2. TRENDS AND PATTERNS OF INTERNATIONAL MIGRATION AND INTENTIONS TO MIGRATE| 46
the employed to move to another country, while individuals out of the workforce
43
are less likely to wish to
move.
The desire to move abroad is also related to individual wealth, economic and material conditions. The chart
above shows income quintiles that measure the relative wealth in countries of different income categories
(that is, an individual’s wealth compared to that of others
44
). Importantly, for low income countries, wealth
is not statistically related to a wish to migrate. This means that we cannot conclude anything on whether the
richest individuals in the population are more or less likely to express the desire to move abroad compared
to the poorest. In middle income countries, individuals in the third, fourth and fifth income quintiles have
approximately 5% lower odds than the poorest ones (i.e. those in the bottom quintile) to express a wish to
migrate. In high income countries, the relationship between income and desire to migrate becomes stronger
and more relevant than for other groups of countries. Indeed, the wealthier the individuals, the less their
wish to move abroad. This relationship becomes progressively stronger for richer individuals. Indeed, those
in the second income quintile have a 9% lower likelihood of wishing to migrate than those at the bottom. The
richest individuals are approximately 14% less likely to wish to migrate than those in the bottom quintile.
Additional analyses carried out by the JRC (Migali and Scipioni 2018) suggest that both general life satisfaction
and contentment with one’s own economic and material conditions tend to decrease the probability of
expressing a desire to migrate.
This set of models at the individual-level suggests that the wish to migrate cannot be used to inform policy
makers about the size of potential migration and the characteristics of future migrants. Indeed, while more
than 20% of the population expresses the desire to make an international journey, less than 1% actually does
migrate. Furthermore, our analysis also suggests that the desire to move abroad represents individual
aspirations to improve one’s own conditions due to life dissatisfaction, rather than a concrete intention to
migrate. Indeed, our findings point towards an inverse relationship between the wish to migrate and
individual income. Additionally, in high income countries, the less wealthy individuals have higher likelihood
to desire to move for an international journey.
Migration preparation
As already observed in Chapter 2, there is a consistent gap between wishing to move and actually undertaking
the move abroad. Those taking steps to prepare for their international migration journey are consistently
less than those expressing a general desire to move abroad. The highest values of migration preparation can
be observed in low and middle income countries.
43
Individuals out of the workforce are those not looking for a job (inactive). The definitions of Gallup variables are given in the Data Annex.
44
Individual income quintiles are defined by Gallup on annual (per-capita) individual income (expressed in international dollars). It should be remarked
that income quintiles provide a comparison of each individual wealth position within the same country. This measure is more appropriate to make
comparison within each of the three income groups (low, middle, high) rather than between them (indeed, this measure does not provide information,
for instance, on how the level of the richest individuals in low income countries compared to the level of wealth of those in the bottom quintile for
the group of middle income countries.)

CHAPTER 2. TRENDS AND PATTERNS OF INTERNATIONAL MIGRATION AND INTENTIONS TO MIGRATE| 47
Figure 16 Drivers of migration intentions: migration preparation. The bars indicate the odds ratios. The odds ratio is the odds of the
migration preparation given the fact that an individual belongs to a particular group (e.g. males), compared to the odds of the
migration preparation of an individual in the comparison group (e.g. females). An odds ratio greater than 1 (blue bars) means that an
individual in the considered group has higher odds of the migration preparation than the one in the comparison group. Odds ratios
smaller than 1 (orange bars) indicate lower odds.
The profile of those preparing to migrate
In contrast to those simply wishing to migrate, people who are preparing to move abroad tend to be older
(Figure 16). In low income countries, people aged from 25 to 29 have a higher probability of preparing to
migrate than those aged 15 to 19. In middle income countries, those aged 20 to 40 have on average 50%
higher probability of preparing to migrate. In high income countries, people aged 20 to 24 are more likely to
prepare to migrate.
Being male is associated with a higher likelihood of preparing to move abroad. Similarly, being single and
being already a migrant are associated with a greater probability to prepare to act on the decision to move
abroad than being married or native born. Importantly, having a network of relatives and friends abroad is a
strong driver for potential migration, for all groups of countries. This is consistent with the previous drivers
of general migration movements between countries.
The unemployed are more likely to make the decision to move abroad when compared to those already
employed. Highly educated individuals also tend to be more likely to prepare to move than those holding
lower levels of education. Overall, these results confirm a non-linear relationship between income and
migration preparation. Indeed, in low income countries, the relative wealth of individuals is not statistically
related to a tendency to prepare for migration. In high income countries, the wealthiest individuals are also
the least likely to prepare to migrate, whereas in middle income countries, people in the bottom quintile are
the most likely to migrate, followed by those in the top quintiles (the 4th and the 5th). Most importantly, and

CHAPTER 2. TRENDS AND PATTERNS OF INTERNATIONAL MIGRATION AND INTENTIONS TO MIGRATE| 48
in line with the previously discussed migration hump theory, in middle income countries only the richer
individuals have the means to afford the migration journey, hence they have the highest likelihood of moving
abroad.
Differently from the wish to migrate, additional analyses show that there is no clear relation between general
life satisfaction, contentment with one’s own economic and material conditions and the migration
preparation. This suggests that the more certain that someone's intentions to migrate become, then the less
important their individual perceptions are. Instead, the standard socio-demographic characteristics become
stronger explanations of their migration decisions.
To anticipate the characteristics of potential migrants, policymakers would better look at the drivers of
migration preparation rather than at the ones of migration desire.
It should also be noted that the drivers of individual intentions to migrate broadly mirror the relevance of
the drivers for total migration movements at the macro-level. Networks and education are the most relevant
drivers of potential migration. These results confirm that, in middle income countries, individuals having the
material and economic means to move abroad are more likely to do so. In high income countries, however,
the richest are the least likely to prepare to migrate, while in low income countries the relationship between
individual wealth and migration preparation is less clear.
Conclusion
The analysis of the migration drivers has resulted in the following main messages:
Structural factors in the country of origin- economic, networks, demographic- are the main drivers of
international migration, when compared to the other drivers considered in our analyses.
Our analyses have confirmed the non-linear relation between economic development and migration:
emigration first increases, before decreasing with economic development. This further supports the most
recent existing empirical evidence (Dao et al. 2018) that mobility transition theories provide lens to interpret
international migration movements in the long-run.
The drivers of the legal channels of migration confirm that structural factors- networks and economic
conditions at origin and destination- exert different influence on the different legal channels of migration to
the EU. Importantly, the network effects are crucial for the family channel.
Our report has confirmed that armed-conflicts, state fragility as well as economic conditions are relevant
drivers of people moving internationally to seek asylum.
When focusing on individual intentions to migrate, the results highlight a consistent gap between people
generally wishing to move abroad and those who actually prepare for an international journey. Those
preparing to migrate tend to be young, male, highly-educated. Having connections abroad, a migrant
background, and economic means all facilitate international migration movements (mirroring the country-
level migration drivers).

CHAPTER 4. THE EFFECTS OF MIGRATION POLICIES ON MIGRATION FLOWS| 49
Chapter 4. The effects of migration policies on migration flows
by
Marco Scipioni
Governments and international organisations have increasingly regulated migration in the post-WWII era.
The effectiveness of this regulatory activity, however, has been met with scepticism by both academics and
public opinion more broadly. Indeed, it is only recently that serious efforts at quantifying and comparing
migration policies have emerged in the form of indexes. These initiatives are essential for a project like IMD
report to provide a global assessment of drivers that shape migration. While representing a significant
advance in the debate, including these indexes in an extensive quantitative analysis still face considerable
challenges. Issues of data availability, representativeness, and methodological and theoretical hurdles more
broadly, including establishing the direction of causality, are yet to be dealt with satisfactorily. Considering
these limitations, this chapter first looks at overall trends in migration policies, as gauged by the recent
academic literature on migration policy indexes. It then moves to survey what the literature assesses as being
the main effect of policies on flows and stocks.

CHAPTER 4. THE EFFECTS OF MIGRATION POLICIES ON MIGRATION FLOWS| 50
Introduction
The main purpose of the IMD report is to offer a global analysis of the determinants of international
migration. In the previous chapters this report has summarised the main theories seeking to explain
migration and quantitatively explored past and recent trends in international migration. Because of a
combination of factors (inter alia, data constraints, methodological issues), however, the empirical analyses
presented in Chapter 3 do not take into account the role of policies in explaining international migration
movements. That said, from both a policy and academic viewpoint, it is important to have a more
comprehensive investigation of the link between policies and migration to better inform the reading of the
IMD report. Indeed, the literature on migration and policymaking alike have historically paid great attention
to the role of policies in shaping migration flows and stocks.
This chapter does not bring new evidence to the debate regarding the role of policies in shaping migration,
but summarises the main insights from the existing literature. It first looks at overall trends in migration
policies, as gauged by the recent academic literature on migration policy indexes. It then moves to survey
what the literature assesses as the main effect of policies on flows and stocks. In doing so, as just mentioned,
this chapter heavily relies on findings emerging from recent scholarship coding migration policies. Amongst
others, one key limitation of this literature is the geographical coverage, meaning that mainly OECD countries
are considered. As a consequence, policy developments occurring in non-OECD countries are not considered
here
45
.
Overall, the literature finds limited effects of policies on migration flows when other factors such as
economic, cultural, social, and geographical ones are considered. Indeed, several key contributions have
questioned, mainly from qualitative perspectives, the effectiveness of migration policies to reach their
declared outcomes at all (Castles 2004; Czaika and De Haas 2013; Hollifield, Martin, and Orrenius 2014).
Knowledge gaps
In past decades a burgeoning literature has focused on or included in their analyses the role of policies in
shaping migration policies (Docquier, Peri, and Ruyssen 2014; Gest and Boucher 2018; Helbling and Leblang
2018; Hooghe et al. 2008; Ortega and Peri 2009; Peri, Shih, and Sparber 2015). Policies included in these
studies are not only immigration (or admission) and immigrant (or integration) ones
46
, but other state policies
as well, such as the welfare policies of destination countries (Giulietti 2014; Razin and Sadka 2014). Because
of space constraints, this chapter focuses exclusively on migration policies. However, the reader should be
aware that these other state policies do matter in shaping both migration legislation and outcomes. The
definition of migration policies, as suggested by the DEMIG project, can be summarised as ‘rules (i.e., laws,
regulations, and measures) that national states define and implement with the (often only implicitly stated)
objective of affecting the volume, origin, direction, and internal composition of immigration flows’ (Czaika
and De Haas 2013, 489).
45
The reader should be aware that this selection is likely to make a difference in assessing whether policies are effective of not. Famously, Hollifield
(2006) identified a ‘paradox’ for liberal states in meeting the conflicting objectives of controlling immigration on the hand, and securing economic
growth and open political institutions on the other. This implies that illiberal states may not face the same difficulties in accomplishing their policies.
46
In the academic literature, a distinction is frequently made between immigration policies – i.e. the rules governing the admission of individuals – and immigrant policies
i.e. those governing the integration of immigrants in destination countries once they are admitted.

CHAPTER 4. THE EFFECTS OF MIGRATION POLICIES ON MIGRATION FLOWS| 51
When carrying out a quantitative analysis as in the case of the IMD report, using migration policy indexes
may become problematic as they are limited in their geographical and time coverage. In other words, there
is simply not enough fuel to run the models. This is clear from Figure 17 below, which shows the data
limitation for any global attempt to explain migration flows posed by these policy indexes, as in the case of
the IMD. Migration policy indexes are also centred on OECD countries
47
, meaning that other entire regions
(e.g. Africa, Latin America) are left uncharted.
In addition to this limitation, the research design of the IMD project does capture institutional and other
factors that tend not to change over time. However, the limitations of such research design are that policy
changes remain outside the remit of analysis. On the other hand, the very interpretation of policy changes is
challenging. Indeed, distinguishing between whether a policy change caused a certain outcome (e.g. a change
in flow, or a change in the composition of a flow) or, on the contrary, whether that particular outcome was
the very cause that brought about that policy change, is something that can only be tackled through a
different kind of research design. Research which has explicitly set out to uncover causal links has so far been
small-scale and based on different methods (Peri, Shih, and Sparber 2015; for a recent overview of the
debate, see Bjerre 2017). In other words, a methodology and research design which could uncover causal
claims about the role of policies would have to be quite different from that adopted by this report.
Measuring migration policies
In the last decade, several indexes have been created to measure migration policies. These indexes are
essential to map and understand the direction that policy trends have taken at the global, regional, and
country level. Methodologically, most indexes assume that the policies can be categorised based on their
liberal or restrictive nature
48
, meaning whether they aim to restrict or enlarge immigrants’ rights. Developing
these indexes entail a resource-intensive coding of laws and policies, which are converted into numerical
scores. In turn, these scores can then be aggregated through, inter alia, time, space, or policy categories to
capture trends along these dimensions. Table 1 lists some of the main indexes developed so far.
Table 1. Some recent migration policy indexes
Index
List of policy dimensions
Focus
Time
coverage
Country coverage
MIPEX
49
1) Labour Market Mobility; 2)
Family Reunion; 3) Education; 4)
Political Participation; 5) Long-
term Residence; 7) Access to
Nationality; 8) Anti-
discrimination and Health
Integration
2015
38: Australia, Austria, Belgium, Bulgaria, Canada,
Croatia, Republic of Cyprus, Czech Republic,
Denmark, Estonia, Finland, France, Germany,
Greece, Hungary, Iceland, Ireland, Italy, Japan,
Latvia, Lithuania, Luxembourg, Malta, Netherlands,
New Zealand, Norway, Poland, Portugal, Romania,
South Korea, Slovakia, Slovenia, Spain, Sweden,
Switzerland, Turkey, United Kingdom, United States
of America.
DEMIG
50
1) Border and Land control; 2)
Legal Entry and Stay; 3)
Integration; 4) Exit
Admission
&
Integration
1945-2014
45: Argentina, Australia, Austria, Belgium, Brazil,
Canada, Chile, China, Czech Republic,
Czechoslovakia, Denmark, Finland, France,
47
A noteworthy exception is DEMIG.
48
That said, some indexes take a different path. For instance, the Migration Governance Index focuses more on institutional capacity.
49
Huddleston, Thomas; Bilgili, Ozge; Joki, Anne-Linde and Vankova, Zvezda (2015) Migrant Integration Policy Index 2015.
50
de Haas, Hein, Katharina Natter, and Simona Vezzoli (2015). ‘Conceptualizing and measuring migration policy change’, Comparative Migration
Studies, 3:1, 1-21

CHAPTER 4. THE EFFECTS OF MIGRATION POLICIES ON MIGRATION FLOWS| 52
Germany, German Democratic Republic, Greece,
Hungary, Iceland, India, Indonesia, Ireland, Israel,
Italy, Japan, Korea, Luxembourg, Mexico, Morocco,
Netherlands, New Zealand, Norway, Poland,
Portugal, Russia, Slovakia, Slovenia, South Africa,
Spain, Sweden, Switzerland, Turkey, Ukraine, United
Kingdom, United States of America, and Yugoslavia.
MGI
51
1) institutional capacity, 2)
migrant rights, 3) safe and
orderly migration, 4) labour
migration management, and 5)
regional and international co-
operation and other
partnerships
Admission
&
Integration
&
Institutional
capacity
2015-2016
15: Bahrain, Bangladesh, Canada, Costa Rica,
Germany, Ghana, Italy, Mexico, Moldova, Morocco,
The Philippines, South Africa, South Korea, Sweden,
Turkey
IMPIC
52
1) labour migration; 2) family
reunification; 3) refugees and
asylum; 4) co-ethnics
Admission
1980-2010
33: Austria, Australia, Belgium, Canada, Switzerland,
Chile, Czech Republic, Germany, Denmark, EU,
Estonia, Spain, Finland, France, United Kingdom,
Greece, Hungary, Ireland, Israel, Iceland, Italy,
Japan, South Korea, Luxembourg, Mexico,
Netherlands, Norway, New Zealand, Poland,
Portugal, Sweden, Slovakia, Turkey, United States of
America.
IMPALA
53
1) economic migration; 2) family
reunification; 3) asylum and
humanitarian migration; 4) and
student migration; 5)
acquisition of citizenship
Admission
&
Integration
1999-2008
9: Australia, France, Germany, Luxembourg, the
Netherlands, Spain, Switzerland, UK, US
Unfortunately, the coverage in terms of both time and geography is fragmented. The JRC has carried out a
survey of existing migration policy indexes, and found that most indexes focus on OECD countries
54
(Figure
17). These indexes cover the traditional distinction in migration studies between the so-called ‘nations of
immigrants’ (e.g. US, Canada, Australia), established ‘countries of immigration’ (e.g. Germany, UK, France),
and recent countries of immigration (e.g. Italy, Spain) (Hollifield, Martin, and Orrenius 2014; OECD and EU
2015). This distinction between nations of immigrants and other countries is still analytically useful when it
comes to migration policy, in areas as diverse as, for instance, integration policy (OECD and EU 2015), highly-
skilled migration (Geis, Uebelmesser, and Werding 2011), or resettlement (Castles, Vasta, and Ozkul 2014;
Reitz 2014). However, a significant gap is that many countries in specific continents are covered by few, if
any, indexes (this is most apparent in Africa, as shown in Figure 17). Approximately, these indexes cover
policies since the 1980s, and have either a sector specific focus (e.g. labour migration, asylum), or are more
comprehensive in their approach. In the following sections, we will therefore limit ourselves to summarising
the key findings from these indexes, rather than attempting new empirical analyses.
51
The Economist Intelligence Unit (2016) Measuring well-governed migration: the 2016 Migration Governance Index. The Economist Intelligence Unit,
London.
52
Helbling, Marc, Liv Bjerre, Friederike Römer, and Malisa Zobel (2017). ‘measuring immigration policies: the IMPIC database’, European Political
Science, 16:1, 79–98.
53
Beine, Michel et al. (2016). ‘Comparing Immigration Policies: An Overview from the IMPALA Database’, International Migration Review, 50:4, 827–
863.
54
DEMIG is the only index that select more than half of the countries selected not from ‘Western liberal democratic sphere’ (de Haas, Natter, and
Vezzoli 2016), and this to get as a representative sample as possible.

CHAPTER 4. THE EFFECTS OF MIGRATION POLICIES ON MIGRATION FLOWS| 53
Figure 17 Indexes geographical coverage.
Overall, policies have become less restrictive…
Findings collected by comprehensive indexes point out that, in the aggregate and based on a long-term
perspective, policies have tended to become less restrictive (Bjerre et al. 2016; de Haas, Natter, and Vezzoli
2015, 2016a; Helbling et al. 2017; Helbling and Kalkum 2017). Figure 18 takes as an example DEMIG data
(covering until 2014) and shows that, overall, liberal policy changes over time outnumbered the negatives
ones.

CHAPTER 4. THE EFFECTS OF MIGRATION POLICIES ON MIGRATION FLOWS| 54
Figure 18 Aggregate policy changes, 1980-2014, Bars show changes in each year. The lines are the cumulative sums of changes.
Source: own elaboration based on DEMIG data.
… but with significant changes across policy categories and countries
The DEMIG project highlights that the level of restrictiveness does vary across migration categories and
migrant groups: policies have become more restrictive in border control and exit
55
, and towards irregular
migrants and family members; less restrictive in entry and integration policies, and towards ‘high- and low-
skilled workers, students and refugees’ (de Haas, Natter, and Vezzoli 2016, 1). Partially consistent with
DEMIG’s conclusions, IMPIC observes that ‘Conditions and criteria to enter and stay in a country have become
more liberal for labour migrants, asylum seekers and people joining their families’, while policies on irregular
migrants have become stricter (Helbling and Kalkum 2017). So, there are two areas where the two indexes
reach diverging conclusions, namely asylum seekers and family reunification.
Data from the IMPIC project (covering until 2010) suggests that, moreover, EU countries seem to have slightly
more restrictive policies when compared to the sample of countries considered by these indexes. This is
55
E.g. deportation.

CHAPTER 4. THE EFFECTS OF MIGRATION POLICIES ON MIGRATION FLOWS| 55
particularly the case for family reunification, labour migration, and control policies (since the 1990s). In
contrast, EU countries seem to have adopted slightly more liberal asylum policies since the 2000s.
When considering the evolution over time and by country of the different categories of policies (Figure 19),
IMPIC data reveal that asylum and family reunification policies have generally become more liberal in the
period considered. In the graph, this is revealed by the gradual change in colours from blue (more restrictive)
to orange (less restrictive), for each vertical pane corresponding to the different policy categories. Control
policies, namely those directed as securing borders and reducing irregular migration, have followed an
inverse trajectory, becoming more restrictive. Labour migration presents a more geographically-marked
pattern. In Asia, Latin and North America, policies have remained fairly constant, whereas in the case of
Europe and Oceania they were liberalised.
Figure 19 Immigration policy trends by group of policies and countries, 1980-2010. Source: own elaboration based on IMPIC data.
A third index, IMPALA, slightly qualifies these findings. IMPALA finds no consistent pattern across migration
categories
56
and countries when it comes to the restrictive or open nature of migration policies. For instance,
IMPALA points out that, the US has consistently had very stringent policies in economic migration between
1999 and 2008 for the unskilled and open for the skilled (Beine et al. 2016, 845). In contrast, over the same
period, according to IMPALA the United Kingdom made its policy more liberal towards the unskilled and
skilled. In the realm of family reunification, IMPALA finds that while rules for partner and child reunification
liberalised in France between 1999 and 2008, neighbouring Germany followed the same trend only for minor
children, but restricted substantially the rules for partners (Beine et al. 2016, 849).
56
IMPALA classifies and measures tracks of entry associated with five migration categories: economic migration, family reunification, asylum and
humanitarian migration, and student migration, as well as acquisition of citizenship (Beine et al. 2016, 834).

CHAPTER 4. THE EFFECTS OF MIGRATION POLICIES ON MIGRATION FLOWS| 56
Besides being liberal or restrictive, policies have become more sophisticated in selecting immigrants
Besides the focus on restrictive or liberal policies, DEMIG finds that another common trait in the evolution of
migration policies at the global level is their increasing sophistication. This is mainly achieved through the
development of specific policy instruments targeting particular immigrant groups. Migration policies should
therefore be understood, according to DEMIG, as a tool for migrant selection rather than as an instrument
affecting numbers.
It is important to understand that these arguments tell us little about the relative weight within a migration
system of the entry channels which have been ‘liberalised’ against those which have been restricted. In other
words, if we were to look just at the absolute numbers of admissions, it would make a lot of difference to
liberalise highly skilled migration but at the same time restricting family reunification.
Figure 20 shows a snapshot of average restrictiveness of immigration policies in 2010, drawing on IMPIC data.
The index ranges from 0 to 1, and the closer the values to 1 (darker blue in the map), the more restrictive.
IMPIC data take policies per se, not policy changes as in the case of DEMIG.
Figure 20 Average restrictiveness of immigration policies in 2010. Source: own elaboration based on IMPIC data.
Looking at Europe, the pace of liberal changes in migration policies have slowed down in recent
decades …
With a more historical approach on the evolution of Western European policies, DEMIG unveils a ‘dominance
of less restrictive changes’ (de Haas, Natter, and Vezzoli 2016, 12), which is due to:

CHAPTER 4. THE EFFECTS OF MIGRATION POLICIES ON MIGRATION FLOWS| 57
markedly liberal policies between WWII and the Oil Crisis because of ‘labor demand fueled by post-WWII
reconstruction efforts and rapid economic growth’ and the ‘establishment of a ground-breaking refugee
protection system’ (de Haas, Natter, and Vezzoli 2016, 12);
after the Oil Crisis, the share of restrictive changes increased, as ‘most European governments stopped
active recruitment and tried to encourage return’ but, at the same time, the ‘growing importance’ of UN
and EU meant an expansion of human rights recognition into national legislations (de Haas, Natter, and
Vezzoli 2016, 13);
since the mid-1990s ‘the numbers of more and less restrictive policy changes [...] have balanced each
other out’ (de Haas, Natter, and Vezzoli 2016, 14), as more restrictions for certain categories of non-EU
immigrants have coincided with the opening-up of internal borders.
… and the impact of EU policies in bringing about convergence in migration policy across Europe is
not clear
IMPIC finds ‘only a small difference between EU and non-EU OECD countries’ in terms of policy convergence.
On this basis, it concludes that there are ‘hardly any Europeanisation effects’ of EU legislation in this area
(Helbling and Kalkum 2017). This is in contrast with other works, signalling for instance the importance of the
EU enlargement process in shaping migration policies at the regional level (E. R. Thielemann and El-Enany
2010).
What has been the effect of policies?
Distinguishing the impact of specific migration policies from the broader set of public policies is no
easy task
Methodologically, Czaika and de Haas instructively point out that there is a need to assess not only whether
a particular migration policy had a significant effect, but also what the relative magnitude of this effect was
compared to other migration determinants in origin and destination countries. Indeed, and as briefly
mentioned in the first section, they encourage researchers not to focus exclusively on migration policies as
it is likely that other public policies, from labour market policies to foreign ones, are equally important in
shaping migration outcomes (Czaika and De Haas 2013, 489). For instance, Kurekova (2013) demonstrated
the importance of welfare state systems in sending countries in shaping emigration. In another study, Joppke
(1998) emphasised the importance of conditional guarantees for families to secure the rights to family
reunification for immigrants.
Policy impact should consider both intended and unintended consequences
Further, they argue that the measurement of purported policy effects should be based on (Czaika and De
Haas 2013):
volume of inflows;
spatial orientation of migration;
composition of migration;
timing of migration;
reverse flows.
On this basis, there are four possible ‘substitution effects’ – i.e. unintended consequences – that can be
hypothesised from a theoretical standpoint: a) spatial; b) categorical; c) inter-temporal; d) reverse flow
(immigration restriction has effects on return making effects on net migration ambiguous). That said, very
few studies take into account of the full spectrum of all possible effects as well as externalities.

CHAPTER 4. THE EFFECTS OF MIGRATION POLICIES ON MIGRATION FLOWS| 58
Methodologically, most of the studies with large geographical and time coverage have looked at association
(i.e. correlation) between policies and outcomes, while case studies have focused on tracing causal effect
between the two. The rest of this section is divided into two parts: one that focuses on comprehensive
approaches which do not differentiate between migration categories, and the other, that analyses exclusively
a single policy area (e.g. labour migration, or asylum).
Comprehensive studies assess the impact of broadly-defined immigration policies against other
migration drivers
Several quantitative studies do not differentiate between policy areas. Hooghe et al test, inter alia, the
influence of policies on immigration flow into the country (1980-04). They mainly test three pull factors,
namely, economic, cultural, and social determinants for migration flows. They also control for the overall
strength of democracy in countries using the Freedom House index, check for anti-discrimination legislation,
whether TCNs have the right to vote, the length of residence to obtain citizenship, and finally if a
regularisation has ever been carried out. The authors find no support for any of these variables in the
empirical analysis. However, they are cautious in dismissing out of hand any effect of policies on migration,
as ‘it is possible that the role of state policies does play an important role, but that we fail to discover it
because of lack of statistical power’ (Hooghe et al. 2008, 498–99).
Docquier et al. find that having family abroad increases the pool of potential and, to a narrower extent, actual
migration (2014c, 79–80). This is important as, while migration for economic purposes might slow down in a
context of anaemic economic growth, having large communities in destination countries may contribute to
sustaining immigration levels, mainly through family reunification. In policy terms, this means that
‘education-based migrant selection rules [read: point-based systems] are likely to have a moderate impact,
especially in countries hosting large diasporas’ (Beine, Docquier, and Özden 2011, 31). Belot and Hatton seek
to quantify this effect when investigating the drivers for immigrant selection in OECD countries, and find that
having a points-based system ‘raises the share of the highly skilled in total migration by about six percentage
points’ (M. V. K. Belot and Hatton 2012, 1123).
Ortega and Peri stand in contrast to this negative assessment prevalent in the literature, as they argue that
‘stricter entry laws significantly discourage immigration. Each reform which introduced tighter rules of entry
for immigrants decreased immigration flows by 6% to 10%’ (Peri and Ortega 2009, 3). They classify laws on
the basis of their liberal or restrictive nature, and separate ‘laws that concern asylum seekers from laws
dealing with other types of immigrants’ (Peri and Ortega 2009, 2).
Studies on specific policies highlight the importance of unintended effects
Other quantitative studies have dealt with the effect of specific policies on migration flows. Visa policies have
attracted a lot attention in recent years as they are generally regarded as one of the most effective and
immediate policy tools to affect migration flows. Czaika and de Haas conclude that imposing visas
significantly decrease flows, but this effect is undermined by decreasing outflows from the same migrant
groups (a form of unintended effect mentioned above). To reach such a conclusion, they select 38 countries
and investigate the effect of visa imposition on turnover
57
and net flows
58
. After checking for traditional
control economic and political variables, the authors still find a statistically significant and substantial effect
57
Defined as inflow + outflow.
58
Defined as inflow – outflow.

CHAPTER 4. THE EFFECTS OF MIGRATION POLICIES ON MIGRATION FLOWS| 59
on inflows, outflows, turnout, and more limitedly on net flow. However, and crucially, this effect is not always
in the intended direction.
Do labour or asylum migration policies balance out numbers and rights?
Ruhs and Martin hypothesise that there is a negative relationship between the volumes of admission of
labour immigrants – i.e. how many are allowed in a given country in a given year – and the rights granted to
migrants once admitted (Ruhs and Martin 2008). In the literature, this has been framed as the numbers
versus rights hypothesis. According to the two authors, this hypothesis is justified on two different grounds.
On a micro-economic argument, the primary reason for this negative relationship is that rights can create
costs for employers, and rising labour costs are typically associated with a reduced demand for labour. A
second, political economy argument would posit that the political imperative in most high income countries
to minimize the fiscal costs that might arise due to low-skilled immigration, either by keeping migrant
numbers low or by restricting migrants’ access to the social welfare system. While Ruhs and Martin provided
some anecdotal evidence for this relationship (Ruhs and Martin 2008), and Ruhs has then further elaborated
on this initial hypothesis (Ruhs 2015), others are more sceptical of both the theoretical soundness of this
expectation and the empirical evidence supporting it (Cummins and Rodríguez 2010b, 2010a).
Thielemann and Hobolth argue that the numbers versus rights hypothesis is more plausible for humanitarian
migration. The authors argue that the international protection entails clear costs for destination countries,
in both fiscal and political terms, and particularly in the short- to medium-term. Such perspective would
suggest that policy makers and politicians may either cut costs by curtailing the rights of those on your
territory (for instance, in terms of access to the asylum procedure, lowering recognition rates, changing the
rights granted by typologies of status, etc.); (2) or lowering the numbers of asylum seekers reaching a state’s
territory (by acting on border controls, visa restrictions, etc.). However, this application of the numbers vs.
rights only finds mixed support in the empirical support.
Asylum policies do not seem to weight as much as other structural factors in shaping asylum flows
and distributions
Turning to the effects of asylum policies on international protection flows, the picture painted by the
academic literature is predominantly negative. Thielemann (2004), Hatton (2009), and Neumayer (2004)
have shown that, as compared to other socioeconomic determinants of migration, policies have limited
effects on flows, composition, and relative share of asylum seekers among EU countries. Hatton created an
index that captures the direction of change in asylum policy (namely, either more liberal or restrictive). He
finds ‘evidence that asylum policies have become tougher and that this has reduced the volume of asylum
applications’, but this toughening of policies ‘explains only about a third of the steep decline between 2001
and 2006’ (Hatton 2009, 209). In other words, most of the variation in asylum applications cannot be traced
back to policy changes.
In an earlier work, Thielemann analysed the effect of policy restrictions on relative distribution of asylum
seekers among European countries. He finds that the relative restrictiveness of asylum policy is a negligible
factor in determining distribution of asylum seekers, as structural determinants (such as GDP per capita,
unemployment rates, historical ties) are more likely to explain relative distribution than policy-related
factors. In a similar research, Neumayer investigates asylum seekers’ choice of destination. Neumayer finds
that networks have comparatively the largest effects on the dependent variable. In terms of policies,

CHAPTER 4. THE EFFECTS OF MIGRATION POLICIES ON MIGRATION FLOWS| 60
Neumayer looks at recognition rates and access to the Schengen Convention
59
. The combined message is that
countries can enact policies that influence asylum flows and distribution, albeit this effect seems to be limited
in comparison to other determinants.
Seeking causal links in small scale studies
More refined counterfactual analyses seeking to uncover causal links between policies and migration
outcomes tend to be sectoral, as so far they have mostly relied on small scale studies. For instance, Peri et
al. investigate the effect of a reduction in quotas for highly skilled on natives, immigrants, and the overall
economy (Peri, Shih, and Sparber 2015). Immigrants were randomly allocated through lotteries to firms, thus
allowing researchers to control for the supply shocks between cities which received a relative high or low
share of permits. The authors first find that the relative small numbers of these quotas as well as the
magnitude of these reductions did not entail large effects on foreign and native employment. The authors
main findings are that ‘unexpected losses in H-1B workers reduce foreign and native employment for cities
highly dependent upon H-1B workers, but not for the full sample of cities’ (Peri, Shih, and Sparber 2015, 4).
Conclusions
Thanks to the migration policy indexes being developed in the last decade, we are now in a better position
to know more about policies worldwide, their historical evolutions over the past decades, and to compare
them. That being said, daunting challenges remain ahead. This is mainly because the predominant academic
studies focus only on OECD countries. This situation is not surprising, as most of the more detailed and
exhaustive migration data, let alone migration policy data, cover only that group of countries. In such a
context of paucity of information, any attempt to build an index which is truly global faces empirical
challenges from the start. Concerning migration policy indexes, issues of comparability also arise, which
emerge especially when they reach diverging conclusions.
The picture regarding the effect of migration policy is less clear, as we lack broad, systematic comparisons
across policy areas and geographically. Those studies that do consider policies tend to qualify their impact
when compared to other migration determinants, such as economic drivers, networks, or cultural or
geographical proximity. In this sense, these findings tend to support one of the key message of this report,
namely that migration drivers, in the long-run, are mainly structural. Methodologically, studying the impact
of migration policy is also a daunting task. In its simplest form, studies may want to investigate the level of
association between policies and certain migration outcomes. While indeed informative, these analyses fall
short of demonstrating any causal links between policies and outcomes. Such claims are generally made in
small case studies, where counterfactual designs may be devised.
59
In other words, Neumayer creates a dummy variable for the years in which a state has been a member of the Schengen Convention (Neumayer
2004b, 168).

CHAPTER 5 CLIMATE CHANGE AND MIGRATION| 61
Chapter 5 Climate change and migration
by
Fabio Farinosi, Cristina Cattaneo, Barbara Bendandi, Marco Follador, Giovanni Bidoglio
Although climate induced natural disasters are likely to cause people and communities’ displacement, the link
between environmental change and migration is not directly evident. In the majority of the cases, causality
connection manifests indirectly, through loss of agricultural productivity, economic capital, income, and wage
losses. The degree of vulnerability of the population exposed to climate related hazards, its resilience to the
shocks, and the capacity to cope with the changing conditions, determine also the heterogeneity of the
response to climate induced stressors on the human environment. Slow onset events linked with increasing
temperature, reduced precipitation, drought events, and land degradation were found to be relevant in
determining migration flows out of rural areas, especially in the least developed countries. Fast-onset climate
related events such as floods are found to affect communities by forcing them to relocate temporarily in the
surrounding regions. The main features of the climate induced migrations are therefore their short distance
and short duration. At the same time, climate factors are likely to impact on the conditions favouring the
decision towards long term and long distance migration.
In this chapter, we first review the scholarship about the empirical evidence of climate induced migration and
summarize the most relevant connections between the two phenomena. Then, we use socio-economic and
climate projections to study the possible future trends in population exposed to climate related hazards.
Although being exposed to climate hazards does not necessarily result in the decision to migrate, we found
that the already vulnerable low and lower middle income countries in the African and Asian continents are
expected to witness a considerable increase of the populations exposed to climate threats. These findings
suggest that regional and national institutions should multiply the efforts to implement strategies designed
to minimize the vulnerability to environmental risks, boosting resilience and coping capacity.

CHAPTER 5 CLIMATE CHANGE AND MIGRATION| 62
Introduction
The impacts of global environmental change on population dynamics have been widely discussed (Adger et
al. 2014; Berlemann and Steinhardt 2017; R. A. McLeman 2014; UNCCD 2017). In particular, the
Intergovernmental Panel on Climate Change (IPCC), set up in 1988 by the World Meteorological Organization
(WMO) and United Nations Environment Programme (UNEP) to provide policymakers with regular
assessments of the scientific basis of climate change, drew attention to the possibility of massive population
displacement due to climate related phenomena, such as sea level rise induced coastal flooding, or extreme
hydro-meteorological events as floods, storms, and droughts (Adger et al. 2014). In this context, migration
was listed as one of the potential strategies that people can use to adapt to environmental changes (Black et
al. 2011; Tacoli 2009) especially in rural areas of the developing world, where the farming-based livelihoods
are more likely to be affected (Dasgupta et al. 2014).
Estimates of the extent of climate induced migration have ranged from 50 million persons by 2010 (Jacobson
1988), to 78 million by 2030 (Global Humanitarian Forum 2009) and 150 – 200 million by 2050 (Myers 2002;
Stern 2006). These projections have been widely reported in the media and influenced most public debates
on environmental migration. However, they are often based on problematic assumptions. For instance, they
ignore the multi-causality of migration decision-making and just take the numbers of the people that would
be leaving an area ‘at risk’ as a proxy for the number of potential migrants (Ionesco et al, 2017). However,
being exposed to a climate hazard does not in fact automatically bring about a decision to migrate. This might
be true in the case of sea level rise, which is an irreversible event that leaves no other option to the affected
populations other than relocating elsewhere. An additional example could be represented by areas where
life condition might become challenging for human adaptability due to increasing temperature (Pal and
Eltahir 2016).
As a matter of fact, the role of climate factors in influencing migration is still debated and findings are still
controversial in most of the recent literature (Berlemann and Steinhardt 2017; Wrathall et al. 2018). In this
chapter, we first review the scholarship about the empirical evidence of climate induced migration (Table 11
in the Annex) and summarise the most relevant connections between the two phenomena. Then, we use
socio-economic and climate projections to study the possible future trends in population exposed to climate
related hazards. These future projections should be read keeping in mind the following caveats: being
exposed to a climate hazard does not necessarily result in a decision to migrate; coping capacity and resilience
dynamics could result in an increased adaptability of the population exposed to increased levels of climate
related threats.
Environmental change and human migration: a mostly indirect relation
In order to better understand the implications that climate change and environmental degradation have on
population dynamics, it is important to understand how these phenomena interact with each other.
Climate change and environmental degradation manifest themselves in a variety of forms. The literature on
natural hazards distinguishes between fast- and slow-onset hydro-meteorological events (UNISDR 2015).
Slow-onset disasters are defined as ones emerging gradually over time, such as drought, desertification, and
sea level rise. Fast-onset events emerge quickly and unexpectedly, such as hurricanes, (flash) floods and heat
waves (UNISDR 2015). Environmental change is often considered to be a direct driver of migration in the case
of sea level rise, that could imply the permanent loss of land for populations living in small islands or coastal
areas (Arenstam Gibbons and Nicholls 2006; Ballu et al. 2011; Robin Bronen 2015; Curtis and Schneider 2011;
Hauser 2017; Marino 2012; Oliver-Smith 2011). In the majority of the cases, however, the link between

CHAPTER 5 CLIMATE CHANGE AND MIGRATION| 63
environmental change and migration is not directly evident: the causality connection manifests itself through
a series of channels, through the loss of agricultural productivity (Cai et al. 2016; S. Feng, Krueger, and
Oppenheimer 2010; Shuaizhang Feng, Oppenheimer, and Schlenker 2012), economic capital, income and
wage losses (Cattaneo and Peri 2016; Dell, Jones, and Olken 2012; Hsiang 2010; Marchiori, Maystadt, and
Schumacher 2012), increasing agricultural prices, and stressed ecosystems (Kumari Rigaud et al. 2018).
In this context, environmental change can be seen as a driver per se, but one that intersects with other drivers
of migration at some time. Furthermore, it is even a factor able to modify the other drivers and introduce
constraints to migratory flows. Another channel by which climate change could cause human migration is
represented by its controversial role in exacerbating or igniting civil conflicts (Almer, Laurent-Lucchetti, and
Oechslin 2017; Hsiang, Burke, and Miguel 2013; Missirian and Schlenker 2017). Finally, changing
environmental conditions, jointly with unsustainable or unethical economic exploitation of natural resources,
could also determine the loss of human habitat (Sassen 2016).
Heterogeneous response to homogeneous changes
Human responses to different environmental changes reflect the magnitude, intensity, geographical
distribution, and persistence over time of the particular natural hazard faced at the time. Historical
observation, however, has documented that even in the case of the same type of natural hazard, different
communities, characterised by different socio-economic and cultural conditions, react in different ways. Due
to the limited availability of viable options, low income populations adopt different strategies compared to
middle income ones. Even within the same communities, peoples' decisions to migrate are heterogeneous
due to household or personal characteristics: age, gender, marital status, education, income, occupation
(Mastrorillo et al. 2016).
The heterogeneity of the response to climate induced stressors on the human environment is likely to be
connected to the degree of vulnerability of the population exposed to the environmental or climate related
hazard, its resilience to the shocks, and its capacity to cope with the changing conditions (IPCC 2014). High
income countries, as well as higher income communities within other countries, are usually characterised by
more resilient infrastructural and institutional apparatuses and more social, political and economic capital.
On the one hand, this mitigates the impacts of climate induced change on the population. On the other hand,
it enables those people to be more effective in coping with fast and slow on-set climate events (Gizelis and
Wooden 2010). In contrast, the impacts of climate induced economic losses on vulnerable populations
deprive communities of the economic means that would be necessary to afford the transaction cost of
migration. In other words, the impacts of climate change on vulnerable populations, especially from rural
areas in low income countries that are extremely dependent on agriculture, result in the loss of the possibility
to consider migration as an adaptation option (Foresight 2011).
Quantifying the degree of social vulnerability is not an easy task (Cutter 1996; Cutter, Boruff, and Shirley
2003). While an overview about the existing indices is provided in Neher and Miola (Neher and Miola 2016)
and Miola et al. (Miola et al. 2015), there is no unanimous consensus about the specific components of social
vulnerability, which is a multidimensional concept structured to consider the factors allowing communities
to cope with and recover from environmental hazards. Summarising the findings presented in the literature,
the most important determinants of social vulnerability are mainly related to: socioeconomic status in terms
of employment, income, political power and position in relation to the social structure, income inequalities,
poverty, social dependence; demographic factors as gender, race and ethnicity, age, household and family
structure, education; population dynamics and growth; socio-environmental characteristics as living in rural

CHAPTER 5 CLIMATE CHANGE AND MIGRATION| 64
or urban areas, housing type, dependency on agriculture or in general ecosystem services, water dependency
ratio, sustainable use of the natural resources; access to basic human needs, as for improved water supply
and sanitation, energy, health care; political and institutional quality, as for personal security, economic and
political freedom, justice, level of corruption (Cutter et al. 2008; Cutter, Boruff, and Shirley 2003; Miola et al.
2015). These factors are also likely to impact on the decision to migrate as outcome of environmental change.
Empirical evidence
In order to understand what the future could look like, we analysed the evidence reported from past events
highlighting common outcomes between similar events in different contexts
60
. In this respect, the main
feature of climate induced migration is its short distance and short duration, phenomenon particularly
evident in the context of fast-onset natural disasters, as for instance the displacement caused by flooding.
This form of migration seems to be mostly from rural to urban contexts, or from rural to neighbouring rural
regions. It occurs mainly within national borders or confining countries, for short periods (Berlemann and
Steinhardt 2017; Kumari Rigaud et al. 2018). In some cases, the dynamics have been observed for longer
periods, but with characteristics that blur into those of circular migration and seasonal work (Mercandalli
and Losch 2017). Other patterns, such as for urbanisation, are more irreversible and could be a first step
towards long distance migration.
As mentioned, different climate related events affect populations in different ways. Slow-onset events linked
with increasing temperature, reduced precipitation, drought events, and land degradation are relevant in
determining migration flows out of rural areas, especially in less developed countries. Statistical analyses
have highlighted a correlation between increased droughts and short distance, circular migration, following
seasonal working patterns. This is especially so in sub-Saharan Africa, South and South-Eastern Asia, Central
and South America. The causal effect is often evident only for certain parts of the population and varies
according to gender, income level, and socio-cultural context. Evidence of trapped populations (i.e. those
unable to leave due to lack of resources) as a result of climate shocks are recorded among the poorest
communities and social groups in sub-Saharan Africa (Eastern and Western in particular), South-East Asia,
Central and South America.
In the case of fast-onset climate related events such as floods, empirical evidence shows that affected
communities relocate temporarily in the surrounding regions and, in the majority of the cases, move back to
their place of origin once the emergency is ended. This is particularly true in the case of the most developed
countries. In this case too, different economic and social groups are affected differently by the disaster and
their likelihood to choose migration as an adaptation option differs depending on age, gender, income level,
social background. With fast-onset disasters, however, the role of the institutions and the disaster
management system is a crucial variable in determining human movement. An efficient management of the
emergency and the four disaster phases (namely mitigation, preparedness, response, and recovery) are
found to be associated to a lower inclination towards the migration option.
Permanent environmental changes depriving the humans of their habitat, as in the case of sea-level rise or
extreme heat, are found to be associated with displacement. However, the rarity of occurrence of this kind
of phenomena in densely populated areas, did not allow to determine generalized patterns of human
behaviour in this particular case.
60
The concepts summarized in this section are mainly derived from the literature listed in the Table 11 in the Annex.

CHAPTER 5 CLIMATE CHANGE AND MIGRATION| 65
The impact of climate change on population and economic growth
Several studies have tried to draw future scenarios of migration flows under climate and environmental
change conditions. A recent report by the World Bank quantified the number of people that will likely migrate
as a result of changing environmental conditions by 2050 in a range between 92 and 143 million (Kumari
Rigaud et al. 2018). The geographical areas more represented in these estimated figures are particularly from
sub-Saharan Africa (~60%), South Asia (~28%), and South America (~12%). Incidentally, the study claims that
an efficient implementation of mitigation and adaptation strategies, in combination with disaster
management strategies, could reduce the order of magnitude of the reported figures by a third. The
characteristics of the projected migration flows confirm its internal or regional nature, in line with the
empirical evidence collected so far (Mercandalli and Losch 2017).
It is important to note that these estimates are based on models that, given the scarce availability of spatially
explicit and reliable data about migration flows, are rarely able to capture the complexity that link
environmental factors to human migration. The major constraint for this kind of analyses lies in fact in the
unavailability of spatially and temporally detailed migration flow data. Climate dynamics are extremely
detailed in time and space, while human migration statistics are usually made available at country level and
at (multi-) annual resolution. In addition, impacts of climate and other environmental dynamics are
particularly location specific and need to be analysed in the context of the combination of natural and
economic systems. Therefore, in this chapter we do not try to quantify the number of people that will choose
to migrate for adapting to changing climate conditions. Instead, we consider the most recent projections of
future population that are expected to be exposed to future climate threats. Although these are not
necessarily a proxy of migration flows, quantifying the trends of populations at risk could provide an idea of
the trends of individuals or communities that might choose migration as an adaptation option.
To this goal, we used the Shared Socio-Economic Pathways (SSP) projections of population (Riahi et al. 2017)
recently proposed by the International Institute for Applied System Analysis (IIASA). The SSP scenarios are
socio-economic projections, including population, gross domestic product and built environment, developed
in the context of the activities of the Intergovernmental Panel on Climate Change (IPCC) to study possible
future greenhouse gases emission for the next generation of climate projections. These data are the bases
upon which the conclusion of the IPCC Sixth Assessment Report, expected by 2022, will be structured. The
SSP projections are made available at country level. In order to get spatially explicit information, we used the
downscaled data proposed by the Global Carbon Project (Murakami and Yamagata 2016). In order to ensure
consistency with the analysis of the climate threats, the scenario chosen for this analysis was the most
pessimistic one, namely, number 3 ‘Fragmentation’ (Figure 21). This scenario assumes slow economic growth
and a low development rate
61
. Under this scenario, high population growth is projected for the African
continent, Latin America, and the South Asian region, while a slight decrease in population is projected for
the richest countries in Europe and North America. We then combined this information with projected
indicators of slow-onset climate stress, in particular heat wave (quantified through the Heat Wave Magnitude
Index - HWMId) and drought conditions (quantified through the Standardized Precipitation Evaporation
61
For more detailed information about the SSP scenarios, we remand the reader to the literature (Riahi et al 2017). The reason for choosing this
specific scenario for our analysis was imposed by the climate extremes projections we used (Dosio et al. 2018; Naumann et al. 2018): these estimates
were, in fact, calculated using a climate scenario compatible with the level of GHG emissions of the SSP3 socio-economic characteristics.

CHAPTER 5 CLIMATE CHANGE AND MIGRATION| 66
Index - SPEI) developed within the High-End cLimate Impacts and eXtremes (HELIX) project (Dosio et al. 2018;
Naumann et al. 2018)
62
. The original projections made using 7 different climate model were averaged and
stratified according to the magnitude level (Figure 22). Both socioeconomic and climate projections are
available at high spatial resolution (0.5 degree cells, corresponding to about 55km).
Figure 21. Population (top) projected population in 2010 and 2050 under the Shared Socio-Economic Pathways Scenario 3
‘Fragmentation’. Graphs on the right describe the population observed (1980-2010) and projected (2020 - 2050) evolution under the
SSP3 aggregated for the major regions of Europe, Asia, Africa, and Americas.
62
Drought and heatwave hazards future projections used for the analysis presented in this section were kindly provided by Alessandro Dosio and Gustavo Naumann (JRC).

CHAPTER 5 CLIMATE CHANGE AND MIGRATION| 67
Figure 22. Projected occurrence of dry months (left) and heat waves (right) in the decade 2040-2050. The indicators were stratified in
three level of intensity, namely Moderate - Severe – Extreme for the dry months, and Severe – Extreme – Exceptional for the heat
waves (top down). The left panels indicate the number of ‘drier than usual’ months for the period 2040-2050, where ‘usual’ is
calculated with long term past observations. Top-left panel indicate the number of months ‘slightly drier than usual’, middle-left panel
‘drier than usual’, and bottom-left panel ‘considerably drier than usual’. The number of dry months is considered a good indicator of
drought events. Similar considerations could be drawn for the right hand side panels, where, however, the intensity of the heatwaves
is measured through a magnitude index. Extreme droughts and exceptional heatwaves are less frequent than moderate droughts and
severe heatwaves, but their impacts are likely much higher. Grey shaded area in the left panels indicate the most arid areas of the
world, where the calculation of the precipitation/evaporation index might be physically meaningless (Naumann et al. 2018).
Figures 23 to 26 show the combination of the projected population with the extreme events for drought and
heat waves by continent, region and income levels
63
.
63
Classified following the World Bank definition

CHAPTER 5 CLIMATE CHANGE AND MIGRATION| 68
Figure 23 Population exposure to drought by continent and regions.
Figure 24 Population exposure to drought by continent and income levels.

CHAPTER 5 CLIMATE CHANGE AND MIGRATION| 69
Figure 25 Population exposure to heat-waves by continent and region.
Figure 26 Population exposure to heat-waves by continent and income levels.

CHAPTER 5 CLIMATE CHANGE AND MIGRATION| 70
According to our elaborations showcased in figures 23-26, the regions in which the combination of population
and extreme events is expected to substantially increase in the coming decades are: Northern, Eastern, and
Western Africa, Middle Africa is expected to be more subject to heatwaves than droughts; Southern and
Eastern Asia are expected to be particularly affected by drought events, while the South-Eastern and Western
Asian regions are more exposed to heatwaves; Central and South America and Southern Europe are also
projected to experience an increasing exposure of population to climate extremes. The already vulnerable
low and lower middle income countries in the Northern, Eastern, and Western Africa, Southern, and South-
Eastern Asia are expected to witness a considerable increase of the exposure to climate threats. Central and
South America and Southern Europe are also projected to experience an increasing exposure of population
and economic assets to climate extremes, even though to a lesser extent.
Conclusions
Environmental factors, climate change, and slow- and fast-onset natural disasters are factors that could drive
migration flows. However, except for sea level rises and permanent flooding, it is difficult to find a solid,
direct causal correlation between the two phenomena. Quantifying the possible impacts that changes in
environmental conditions could have on migration is not an easy task. In addition, changing environmental
conditions, and the related slow- and fast-onset natural hazards, cause different responses for different
population categories.
Nonetheless, this chapter analysed the most updated climate and socioeconomic projections to elaborate a
set of possible trends. Both the literature review and our findings show a few patterned regularities. For
example, natural hazards characterised as being fast-onset and having a relatively short duration are mainly
associated with temporary displacement in surrounding regions, as in the case of flood events. Slow-onset
and more persistent climate driven disasters are more associated with short distance and circular migration
phenomena.
Theories that point towards internal migration, and in particular urbanisation, being a first step followed by
international and long distance migration are still controversial but may be relevant in contexts of climate
driven disasters. Empirical evidence highlights that, very often, sudden urbanization of large number of low-
middle income individuals resettling from rural communities is closely correlated with the formation of
informal settlements. Especially in the case of mega-cities and metropolis in the developing world, informal
settlements or slums are characterised by poor access to basic services, poor economic development, scarce
social security and are often constructed in flood or landslide prone areas. All these factors could contribute
in boosting the inclination to further migrate looking for better opportunities elsewhere.
Finally, especially in the most vulnerable low and lower middle income countries, exposure to droughts, heat
wave, floods, and sea level rise is expected to increase in the coming decades. The fact that increasing amount
of people and economic value will be exposed to climate related hazards does not automatically imply that
the potentially affected populations will increase their likelihood to migrate. In fact, good quality institutions,
the implementation of efficient policies and strategies aimed at pursuing sustainable development and
increasing the capacity of the exposed population to cope with the degree of change and to adapt to the new
conditions, are factors that significantly reduce the environmentally induced migration.
Overall, these findings suggest that regional and national institutions, jointly with policymakers and
practitioners, should multiply their efforts to implement strategies and policies carefully designed to
minimize the vulnerability to climate and environmental risks by boosting the resilience and coping capacity
of populations.

CHAPTER 6 LIKELY DEVELOPMENT OF FUTURE MIGRATION| 71
Chapter 6 Likely development of future migration
by
Fabrizio Natale
This chapter summarises the main findings of the report with a forward-looking perspective. Investigating the
role of the drivers of past migrations is not just an intellectual exercise with an end in itself.
We see three main added values in this exercise:
it can help to contextualize the 2015 EU migration crisis by taking a more detached historical and global
perspective on the general migration phenomenon;
it emphasises the distinction between migration potential and the concrete realisation of this potential into
actual migration flows, that are also influenced by contingent and largely unpredictable policies and
geopolitical factors;
it can contribute to understand future migration trends.
Overall the analysis of the drivers indicates that the likelihood to migrate at global level is destined to increase
with development and demographic transition of developing countries and that this migratory potential will
manifest itself preferentially along well-established migration corridors. However, past data also tells us that
there are inherent obstacles and policies affecting the international movement of people that will likely
continue to limit international migrations; that the new phase of globalisation is not incompatible with a
scenario for low international migration and that future migration could be much more diversified in the terms
of possible destinations and fluid in terms of forms and duration.

CHAPTER 6 LIKELY DEVELOPMENT OF FUTURE MIGRATION| 72
Introduction
The large increase of refugees from Syria and the consistently high arrivals across the Mediterranean Sea
since 2011 have contributed to a sense of emergency taking hold of public and policy responses to migration
into the EU. They also fuelled the perception of an imminent exodus directed from Sub Saharan Africa
towards Europe
64
.
The sense of emergency suggests that migration is seen as a sudden, contingent problem to be solved rather
than of as an intrinsic feature of globalisation and development.
The large arrivals of asylum seekers to Europe are linked to well identifiable geopolitical events: the war in
Syria and a destabilisation of Libya, Iraq and Afghanistan. In particular, the destabilisation of Libya has opened
a new ‘gate’ to channel migratory flows, ending in the past in Libya, further north towards Europe. These
events do not necessarily imply changes in the fundamental drivers that shaped international migration in
the last decades and that will most likely continue to influence it in the medium-long term.
Migrations of the past, such as from Europe to the Americas and to Australasia in the Nineteenth century,
and from Northern Africa to Europe in the Twentieth Century, have been shaped by the same interplay
between demographic and economic forces and policies which now characterise more recent migration flows
from Eastern to Western Europe and from and within Africa (Natale, Migali, and Münz 2018).
The analysis of such drivers urges us to interpret migration as part of more fundamental structural
demographic and economic processes which play a central role in globalisation and development, rather than
only seeing through lens that emphasises the emergency aspect dictated by recent events.
Our analysis of drivers in chapter 3 describes the fundamental forces which have shaped world migrations
since the 1980s. These forces create the preconditions for migration and determine emigration potential
from each country. In addition, bilateral relations between countries and in particular the presence of
diasporas allow us to predict that the direction of migration flows will largely follow historically established
patterns between countries.
As the analysis of individual drivers in Chapter 3 indicates, there is a large gap between intentions,
preparation and actual realisation of migration. While individuals may, for a variety of reasons, have
aspirations to migrate, a number of different factors may condition whether or not they will be able to leave.
Among these factors are their economic conditions (labour market status and individual income), personal
ones (being married or having children) and social ones (having contacts or relatives abroad). In addition,
structural elements such as policies at both origin and destination countries may affect the ability to migrate
and shape migration itineraries along different possible channels and geographical routes.
Researchers frequently struggle to identify the specific drivers of different dimensions of migration. As
indicated in Chapter 3, the categorisation of migration in different channels or reasons is necessary to put
some order in this complex phenomenon. This is especially so in quantitative studies, which look through the
limited lens of what can be observed in aggregated migration statistics. By categorising migration flows as
forced or voluntary, regular or irregular, economic, climate change, conflict driven, or any other type, there
is a risk that categories are interpreted as causes of migration, when in fact they only describe the channels
through which migration is defined and takes place.
64
This perception is continuing to be fuelled in 2018 by arrivals across the Mediterranean route in particular to Italy and Spain.

CHAPTER 6 LIKELY DEVELOPMENT OF FUTURE MIGRATION| 73
In particular, there is a tendency to confound policy categories such as irregular migration or regular
migration (which refer to entry channels) with analytical ones such as conflict driven or forced migration
(which refer to the originating factors of migration). In reality, a complex and simultaneous interaction of
drivers, such as economics, demographics, instability, poverty and conflict, may well be at the basis of both
regular and irregular types of migration.
The distinction between migration potential and actual migration, as well as between causes and channels,
is not only a semantic one. It has important implications when discussing the future of migration. The IMD
analysis tells us something about where future migration will potentially come from (middle income
countries, countries already having networks…). It also indicates the characteristics of a person most likely to
migrate (young, educated, male…). However, an analysis of drivers like the one performed in this report is
not able to predict by itself if and how this potential will come about through specific channels of irregularity,
asylum, family, work, irregularity and specific routes. Rather than through differences in the fundamental
drivers, these channels and routes of migration will ultimately be determined by policy choices, facilitators
of migration (e.g. smugglers) or limits to the crossing of international borders and by geopolitical factors
which are notoriously difficult to predict.
Box 1 Methods and approaches for the forecasting of migration
There has been a pressing need to produce quantitative predictions of migration for policy making. Especially since the
migration crisis of 2015.
Predictions of migration are needed for two different types of policy applications:
- early warning and short term predictions, based on very recent and weekly data, are needed to react, and monitor the
evolution of crises linked in particular to asylum seekers and irregular arrivals;
- forecasts of migration with a 20-30 years’ horizon based on historical data are needed for strategic thinking, to
understand and prepare for societal transformations posed by migration and in the context of demographic models.
The first need can be accommodated through statistical models based on time series analyses. These models can be
effective in forecasting migration up to 5-10 years into the future as long as the trends of migration have a certain
regularity (Bijak 2011; Disney et al. 2016). Their main limitations are that, in their simplest versions used for forecasting,
they do not account for shocks (such as geo-political events). Moreover, with very variable migratory flows the level of
uncertainty may be so large that the forecasts become irrelevant for practical policy applications.
In demography, the influence of migration has been traditionally considered as residual and minor with respect to
fertility and mortality. Demographic projections produced internationally are still based on naive scenarios about
migration. Such scenarios, for example, consist of assuming constant emigration rates on the basis of past observed
migration trends or the doubling of emigration rates or zero net migration. Migration is often invoked as the solution
to the problem of ageing populations in destination countries. To appreciate this role it is important to have a more
careful and refined definition of scenarios for migration in the context of demographic models
65
.
In the absence of quantitative estimates for future migration, the demographic models need to revert to qualitative
scenarios for migration and foresight exercises. In recent years there have been four main foresight exercises addressing
migration by the Development Centre of OECD (OECD 2016), the UK Government Office for Science, by a team of
researchers under the Global Migration Futures project (2009-2013) and by the JRC. Foresight approaches, provide
narratives about alternative plausible futures without necessarily limiting the scoping of the future in the narrow space
65
A project started in 2017 in a collaboration between JRC and IIASA is specifically addressing this need. See (Lutz et al. 2018) for the intermediate
results of this project.

CHAPTER 6 LIKELY DEVELOPMENT OF FUTURE MIGRATION| 74
of probability. They are therefore particularly useful in addressing longer term futures and expanding perspectives
through incorporating various shocks and harnessing qualitative knowledge from different experts and stakeholders.
Thanks to this participatory approach they can serve as tools for stimulating discussion and for building a shared
understanding of possible futures and required policy responses. This is especially relevant for a highly politicised and
divisive topic such as migration.
Econometric models like the ones adopted in this study are essentially used as explanatory tools for testing the role of
several variables of interest rather than for forecasting. These models serve to test for example if an increase in GDP
per capita is associated with an increase in emigration rates. This does not inform us about future realizations of
migration but provides a quantitative estimate of the relevance of the different drivers of migration. Hence, these
models offer an important contribution to the development of scenarios since they allow to anchor the discussions
about the future in empirical evidence based on the analysis of historical trends.
Implications for the future migration emerging from the analysis of the drivers
Economic drivers in countries of origin
The results of the empirical investigation presented in Chapter 3 show a positive influence of income on
migration in middle income countries of origin. This indicates that improvements in income per capita
correspond to higher migration for those countries. A similar positive relation is found in the case of the
model for the individual drivers of migration where the likelihood for preparation for migration increases
when moving from the lower to higher quintiles of the income distribution.
The fact that the relationship between income and emigration is positive only in the case of middle income
countries, but not clear in low and negative in high income countries, supports the transition theory of
migration at the macro level. At the micro level it supports the idea that a rising income can favour migration
by lifting the budgetary constraints to address the costs of migration.
Trends in recent decades (Figure 27) show that the income per capita of many low income countries has
recorded several years of steady increase since 1995.

CHAPTER 6 LIKELY DEVELOPMENT OF FUTURE MIGRATION| 75
Figure 27 Percentage difference in GDP per capita in respect of the baseline of 1990 by income level of the countries of origin. Source
of data: World Bank World Development Indicators.
In Africa the positive trends for improvement of economic conditions is present in particular in 17 countries
which have recorded a sustained increase in GDP per capita of more than 2% per year since 1996. These
countries represent 5% of the world population and around 50% of the African population (Radelet 2010).
In the light of the positive relationship between income and migration, these positive trends of economic
development should translate into an increase in the likelihood of migration in the near future. In the next
20-30 years, several African countries with large populations are likely to get out of the poverty trap which
has kept them so far largely excluded from international migration systems.
The alternative theoretical neo-classical approach to migration considers that improvements in economic
conditions in countries of origin will reduce the income gap with respect to countries of destination which is
at the basis of migration. In fact, while within country income inequality is increasing in several countries,
there has been a reduction in between countries (global) inequality between 1998 and 2008 (Lakner and
Milanovic 2016). This reduction of global inequality is mainly driven by economic growth in India and China.
The income gap between large masses of population in different countries remains so large (Figure 28) that
it is difficult to imagine that in the near future there could be a reduction of the incentive to migrate simply
because of the continuation of the current trend of decreasing global inequality.

CHAPTER 6 LIKELY DEVELOPMENT OF FUTURE MIGRATION| 76
Figure 28 Average GDP per capita in the period 2011-2016 by country and income level. Countries are ordered by their level of GDP
per capita. The size of the circle is proportional to the population. The chart shows that the gap in GDP per capita between countries
in the world remains very large despite the progress recorded in relative terms (see Figure 27). Source: own elaboration based on the
World Bank World Development Indicators.
Economic convergence due to the expansion of economies in China, India and Brazil has not resulted in large
international migrations but rather in shifts of population from rural to industrial cities (Zhao, Liu, and Zhang
2018). These cases show that the positive relation between migration and development needs to be
interpreted in a more encompassing vision of enhanced human mobility.
The stock of migrants from populous countries like Nigeria, China or India may seem extremely large when
considered in absolute terms from the perspective of countries of destination but actually they have very low
emigrant’s ratios (for example in 2017: 0.7% for Nigeria, 0.7% for China, 1.2% for India).
The low emigrants’ ratios in large countries may be explained by the fact that in these cases the higher
mobility which is normally associated with an improvement in economic conditions may manifest itself
through large movements within the same country rather than long distance international migration. The
implication of this observation for the future of migration is that we should not look at the effect of economic
development on international migration separately from a broader assessment of human mobility (King and
Skeldon 2010). Raising income increases human mobility in general and this higher likelihood for movement
may manifest itself in several possible forms. Especially in large countries it is likely that international
migration might remain residual since there are many more opportunities for people to seek better
opportunities within their own country.

CHAPTER 6 LIKELY DEVELOPMENT OF FUTURE MIGRATION| 77
Economic drivers in countries of destination
In our analysis for general migration, the economic drivers for countries of destination seem to have a
negligible role in explaining past migration flows.
The fact that we are not able to capture demand driven effects may lie in the high level of aggregation of the
data which does not allow us to distinguish between forms of migration. In fact, such effects become clearer
when analysing separately drivers of different forms of migration to the EU.
Another possible explanation is that the high level of entry restrictions imposed on migration implies a low
elasticity of migration flows in reacting to changes of economic conditions in countries of destination. At
individual level, the decision of where to migrate is not linked to a rational evaluation of contingent changes
in employment rate or GDP per capita in potential destinations, but to a generic perception of favourable
perspectives with respect to the country of origin.
There is ample literature indicating that the characteristics of the demand in the labour market in destination
countries is a strong pull factor for international migration
66
. Some authors underline in particular the fact
that migratory flows have a central role in providing the supply of cheap and low skilled labour in secondary
sectors in the segmented labour markets of countries of destination (Castles, Haas, and Miller 2014; Piore
1986). According to this argument migration is both instrumental for, and the effect of, modern capitalistic
systems of production. On the one hand, developed and rich countries need to limit excessive immigration
for its negative social consequences, but on the other, they rely on migration as an essential element for the
functioning of their production systems and economies.
In a future perspective the loss of jobs in developed economies due to digital transformation may change
radically the role of labour demand in driving migration. The jobs which are more likely to be impacted by
digital transformation due to high level of routinisation are exactly those present in secondary segments
where migrants are more likely to be employed with respect to natives (Biagi et al. 2018). Digital
transformation will therefore require the need for re-qualification of skills of migrants and in absolute terms
it may imply a reduction of demand for labour in those sectors which are currently occupying most of the
migrants.
Demography
In the empirical analysis in Chapter 3, the role of demography as driver of migration is captured by the fertility
rate variable.
The fertility rate is influencing the future size of the age group 15-30 and indirectly serving as a proxy for the
state of development (United Nations 2017).
On the one hand, our analyses show that in countries that ended the first demographic transition
(corresponding largely to high income countries) the low and stabilised total fertility rate has no effect on
migration flows. On the other hand, in countries in which the first demographic transition is still on-going
(mainly in low and middle income countries) the high yet declining total fertility rate is negatively correlated
with migration flows.
The role of fertility rate as a driver for migration may be explained by the strong association with the level of
socio-economic development of the country that is its improvements in public health, higher investments in
66
In several cases such as the ‘guest workers’ migrations from Southern to Northern Europe between 1955 and 1973 it was a pull factor organised
via systematic recruitment.

CHAPTER 6 LIKELY DEVELOPMENT OF FUTURE MIGRATION| 78
children health and welfare, women emancipation, etc. (Lee, 2003). In light of this, it can be seen that the
higher the level of total fertility rate the lower the level of socio-economic development which in turn
hampers migration flows. As the total fertility rate reduces due to improved socio-economic conditions the
demographic factors act less strongly as a barrier to migration. On the one hand, this can be seen clearly
comparing low income and middle income countries. On the other hand, in countries in the post-transition
stage or the so-called ‘second’ demographic transition, the low and stabilised total fertility rate has no impact
on migration flows.
An additional explanation is linked to the fact that a reduction of total fertility rate is indirectly capturing a
change towards demographic profiles characterised by a higher share of young adults or so called youth
bulge which have a higher likelihood for migration.
In a medium-long term perspective the reduction of the fertility rate in countries of origin could result in a
reduction of the absolute number of international migrants simply due to a decrease of the total population.
However, the reduction in fertility also corresponds to higher development and a transition of the
demographic profile of countries towards a structure characterised by a higher share of young adults.
Figure 29 indicates that the population of young adults in low income countries will continue to increase until
2100 while in the case of middle income countries it will stabilize around 2040. With the expansion of the
share of population of young adults we can expect higher likelihood for migration.
Figure 29 Difference in the population of young adults (age 20-29) in respect of the baseline of 1980 by income level. Source: own
elaboration based on UN's 2017 World Population Prospects medium variant scenario.

CHAPTER 6 LIKELY DEVELOPMENT OF FUTURE MIGRATION| 79
The higher likelihood for migration deriving from the combined effect of changes in the demographic profile
and rising income may offset the reduction in absolute number of migrants due the stabilisation of the
population.
Geographical distance, trade and globalisation
Despite globalisation reducing the costs of migration, the negative sign for the driver of geographical distance
resulting from our models indicates that geography is playing still a strong role in hindering migration in
particular in the case of low and middle income countries.
With the progressing of globalisation, we can expect that more low income countries, which currently have
migration mostly confined to neighbouring countries, will enter more expanded international migration
systems. This will be reflected in migrations to more distant destinations and in a diversification of migration
flows both in terms of the distribution of shares across destinations and in terms of number of destinations.
Looking at past migration data these trends are already emerging. The left chart in Figure 30 indicates that
on average migrants from high income countries are living in more distant countries if compared to migrants
coming from middle and low income countries but also that low income countries have been rapidly
increasing the average distance of migrations since 1960. The right chart shows the increase in diversity of
destinations through an index measuring both the variety of countries of destination and the unevenness of
distribution of migrants across these destinations. The increase of this index which is particularly pronounced
in the case of low income countries since 2000 indicates that the proportions of migrants are less uniformly
spread across many more destinations compared to the past.
Figure 30 The left chart shows the average distance between countries of origin and countries of destination weighted on the basis of
the stock of migrants. The chart on the right shows the average of the Gini diversity index calculated on the distribution of migrants
across destination. The values are averaged across countries of origin in each income level. Source: own elaboration based on data
from CEPII for distances between countries and from UNDESA for the stock of migrants.

CHAPTER 6 LIKELY DEVELOPMENT OF FUTURE MIGRATION| 80
The positive association between trade and migration emerging in the IMD analysis suggests that flows of
goods and people are moving along the same preferential pathways between specific country pairs.
However, the history of globalisation also indicates that the growth and volume of the international
movement of labour has been smaller than the movement of capitals, and goods. Between 1980 and 2015
whilst the stock of the number of migrants has increased in absolute terms, the ratios of the stock and annual
flows of migrants have remained relatively stable and confined respectively at 3% and 0.01% of the world
population. On the contrary, the ratio between the value of global trade and GDP has increased from 17% to
27% (Figure 31).
Figure 31 Evolution over time of the world stock of and flows of emigrants and value of exports divided respectively by the population
and GDP. Source: own elaboration based on data from World Bank for GDP, COMTRADE for trade, UNDESA for the stock of migrants
and population, Abel (2017) for the flows of migrants.
The different trends indicate that migration between countries is subject to higher obstacles than trade.
Whereas, we should expect an increase of migratory potential due to the development and demographic
transition in low income countries, overall the tendency to migrate will be still moderated by these underlying
obstacles.
Progress of globalisation does not necessarily mean increase in migration flows. In fact, some authors observe
that globalisation of the XXI century is already driven more by flows of knowledge, delocalisation of global
production chains rather than by trade and movement of manufacturing labour. Thanks to higher
connectivity and information technology the last phase of globalisation has been characterized by a transfer

CHAPTER 6 LIKELY DEVELOPMENT OF FUTURE MIGRATION| 81
of knowhow from G7 countries to developing countries with large availability of labour at low prices with no
need of movement of manufacturing labour in the opposite direction (Baldwin 2016).
In perspective, this path of globalisation may reinforce an already evident trend of migrations of people with
different skill levels at the two ends of the labour market. On one end there are migrations of high skilled
staff of multinational companies employed in management, marketing and technical roles for the functioning
of delocalised global production chains, and on the other end, there are migrations of low skilled workers
filling low paid and unstable jobs in the increasingly segmented labour market in countries of destination.
Those accepting these secondary jobs are often the same who have been expelled from traditional economic
activities in their countries of origin due to the negative consequences of globalisation (Saskia Sassen 2014).
Network effects
The positive relationship and a strong effect for the networks indicates that people tend to go to destinations
where there is an already established large stock of migrants from their country of origin. This effect has been
largely described both in quantitative and qualitative studies of migration and is one of the clearest
associations coming out of empirical analyses of migration drivers. The underlying rationale is that the
presence of relatives and friends at destination facilitates the settling in and reduces the costs of migration.
This seems to be particularly the case for low income countries as shown by the higher relevance of this
driver. Based on the strength of the network effect, we can predict with good approximation that migration
flows will follow well established migration corridors between specific country pairs.
Another implication of the network effect is that migration may evolve in a cumulative way, meaning that
the larger the diaspora, the larger the attraction for newly incoming flows (Collier 2013; Massey and España
1987).
New forms of international mobility
With respect to fertility and mortality, which are referring to the unambiguously recognisable life events of
birth and death, migration is a more difficult phenomenon to define. Official statistics define an international
migrant as someone who has transferred his/her permanent residence for at least one year to a different
country in respect of that of birth, citizenship or previous residence. The central element in this definition is
the permanent change of residence and the reference to the crossing of state borders.
This definition does not cover other forms of human mobility which imply a less stable change of residence
such as circular or seasonal migrations or movements across different types of boundaries such as regions
within countries and rural versus urban areas. While the importance of temporary migration is recognised in
the literature (Dustmann and Görlach 2016) there is limited availability of official data on circular migration,
returning migrants and other forms of mobility. Therefore, alternative data sources need to be used to
explore this phenomenon.
The different forms of human mobility are interacting and are subject to the same influences of
modernisation, development and demographic transitions.
The continuum between different forms of mobility is exemplified by the relation between the number of
international air passengers and stocks and flows of migrants according to official statistics. The number of
air passengers although bigger of several orders of magnitude is correlated with emigration and both are
increasing with the income level of the countries of origin (Figure 32).

CHAPTER 6 LIKELY DEVELOPMENT OF FUTURE MIGRATION| 82
Figure 32 Emigrants’ ratio and international volume of air passengers by income levels. The three plots show the relation between the
stock of migrants and annual number of air passengers divided by the population in the country origin in 2015. Source: own
elaboration based on data from UNDESA for the stock of migrants and population and SABRE for air passenger data.
In the future we should expect that migratory potential could manifest itself not necessarily in the form of
international migration as we define it nowadays but in new and more fluid forms of international mobility.
Although the available statistics still do not allow us to capture fully the size of the phenomenon, there are
signs which indicate that the traditional forms of permanent resettlement and family reunification
experienced by Europeans in the 1950s and 1960s are being superseded by circular, temporary and seasonal
migration.
Policies
Chapter 4 has shown that since the Second World War immigration has become increasingly regulated and
that countries in the world have adopted detailed admission policies which restrict entry on the basis of visas,
point systems or quotas.
In such an internationally regulated context people’s aspirations to migrate cannot materialise freely. In fact,
what we observe in term of current migration flows is not an undisturbed expression of migration potential,
but what remains after immigration regulations have manifested their effects.
Despite the important role of policies in shaping migration, the quantification of their effect on future
migration poses a series of challenges. The first challenge is linked to the fact that a comprehensive and
continuous mapping of policies covering most countries in the world is not available. The second challenge
is that even with relevant changes it is difficult to establish a causal relation between the change in policy
and changes in migration flows. The final challenge is based on the fact that even if this relation could be

CHAPTER 6 LIKELY DEVELOPMENT OF FUTURE MIGRATION| 83
somehow quantified it would be impossible to predict what would be the evolution of policies in the future
in order to predict their effect on flows.
As described in Chapter 4, many scholars indicate that the intended objective of policies aiming at controlling
or halting migration is seldom achieved. Policy designed to reduce and filter migration may have the
unintended consequences of transforming migration from regular to irregular, divert migration to other
destinations, hinder circular and temporary migration and increase migration in anticipation of future
restrictions.
It is difficult to predict what would be the size of international migration under a scenario where all barriers
would be removed. The natural experiment of the free movement of labour within the EU area gives us an
idea that under a free movement regime flows would increase in volume
67
but at the same time also become
more diversified and dynamically responding to changes in economic conditions in countries of destination
and origin.
Climate change
Chapter 5 showed that the effect of climate change on migration is not direct and that there is a
heterogeneity of responses depending from the type of change considered (fast or slow onset changes,
drought, heat waves, flooding, sea level rising, …) and the resilience of the population to adapt and cope with
the changing conditions.
Empirical evidence shows that climate-induced migrations take place over short distances and are of short
duration and that in general it is difficult to distinguish international migration from internal displacement
and mobility.
The complex causal pathways between climate and migration make it extremely difficult to predict how many
people will be on the move as a consequence of climate change. However, we can get at least an estimate of
the number of people exposed to extreme climate events by combining spatially detailed climate change
projections and population projections.
These estimates indicate that most of the population which will be affected by climate change will be
concentrated in middle and lower income countries.
The exposure of already vulnerable and poor populations to climate change is most likely going to determine
an exacerbation of poverty, instability and conflicts and, will cause as a consequence, internal displacement
rather than more international migration. Eventually, large internal movements of population could spill-
over into international intercontinental migrations but the worst effects of climate change will be mostly
experienced by the presence of ‘trapped’ populations within countries.
As also indicated by a large foresight exercise carried out in UK (Foresight 2011) when considering the relation
between climate change and migration there is the need to complement the perspective from what will be
the effect of climate change on migration with how we can ensure that migration will be available to the
exposed population as a viable adaptation strategy. In a forward looking perspective migration needs to be
seen also as part of the solution to climate change rather than only as the consequence of climate change.
67
‘Overall, EU mobile citizens accounted in 2017 for 3.8% of total EU resident population, which was 1.3 pp more than in 2007’.
http://ec.europa.eu/eurostat/statisticsexplained/index.php?title=EU_citizens_living_in_another_Member_State__statistical_overview#Who_are_t
he_most_mobile_EU_citizens.3F

CHAPTER 6 LIKELY DEVELOPMENT OF FUTURE MIGRATION| 84
Conclusions
The IMD report indicates that the migratory potential in low income countries is likely to increase in the
medium term alongside economic convergence and demographic transitions.
However, an increased potential for migration stemming mainly from favourable demographic and economic
structural factors does not necessarily imply a rise in actual international migration.
Despite the persistence of large income differentials between countries, migration rates have remained
relatively stable and did not increase at the same pace as trade and capital.
We can identify the following four main reasons that help to explain the relatively stable paths of migration
in recent decades and may continue to operate in the future:
although individuals have aspirations to migrate they often do not undertake the final step to migrate
since this involves high human and economic costs;
immigration is increasingly regulated and most countries have measures which de facto restrict
migration;
international migration is in many cases a residual spill-over from more general human mobility.
Especially in large countries, mobility determined by development manifests itself mostly through
internal, rural to urban mobility rather than long distance international journeys.
Geographical and historical ties will still dictate the prevalent direction of migration flows. However, in an
increasingly multipolar world, migratory flows from low income countries should become more diversified in
terms of possible destinations and moving to more distant destinations.
Finally, temporary and flexible forms of migrations are likely to have higher relevance in the future. Indeed,
these may already be happening, even though they remain difficult to capture in official statistics.

BIBLIOGRAPHY| 85
Bibliography
Abel, Guy J. 2017. “Estimates of Global Bilateral Migration Flows by Gender between 1960 and 2015.” International
Migration Review. http://doi.wiley.com/10.1111/imre.12327 (June 14, 2018).
Adger, W.N. et al. 2014. “Human Security.” In Climate Change 2014: Impacts, Adaptation and Vulnerability -
Contributions of the Working Group II to the Fifth Assessment Reportts, Adaptation, and Vulnerability, eds. C.B.
Field et al. Cambridge, UK, and New York, NY, USA: Cambridge University Press, Cambridge, United Kingdom,
755–91.
Adserà, Alícia, and Mariola Pytliková. 2015. “The Role of Language in Shaping International Migration.” The Economic
Journal 125(586): F49–81.
Almer, Christian, Jérémy Laurent-Lucchetti, and Manuel Oechslin. 2017. “Water Scarcity and Rioting: Disaggregated
Evidence from Sub-Saharan Africa.” Journal of Environmental Economics and Management 86: 193–209.
Arenstam Gibbons, Sheila J., and Robert J. Nicholls. 2006. “Island Abandonment and Sea-Level Rise: An Historical Analog
from the Chesapeake Bay, USA.” Global Environmental Change 16(1): 40–47.
Backhaus, Andreas, Inmaculada Martinez-Zarzoso, and Chris Muris. 2015. “Do Climate Variations Explain Bilateral
Migration? A Gravity Model Analysis.” IZA Journal of Migration 4(1): 3.
Bakewell, Oliver. 2010. “Some Reflections on Structure and Agency in Migration Theory.” Journal of Ethnic and
Migration Studies 36(10): 1689–1708.
Baldwin, Richard E. 2016. The Great Convergence: Information Technology and the New Globalization. Cambridge,
Massachusetts: The Belknap Press of Harvard University Press.
Ballu, Valérie et al. 2011. “Comparing the Role of Absolute Sea-Level Rise and Vertical Tectonic Motions in Coastal
Flooding, Torres Islands (Vanuatu).” Proceedings of the National Academy of Sciences 108(32): 13019–22.
Barrios, Salvador, Luisito Bertinelli, and Eric Strobl. 2006. “Climatic Change and Rural–Urban Migration: The Case of Sub-
Saharan Africa.” Journal of Urban Economics 60(3): 357–71.
Beine, Michel et al. 2016 “Comparing Immigration Policies: An Overview from the IMPALA Database.” International
Migration Review 50(4): 827–63.
Beine, Michel, Simone Bertoli, and Jesús Fernández-Huertas Moraga. 2016. “A Practitioners’ Guide to Gravity Models of
International Migration.” The World Economy 39(4): 496–512.
Beine, Michel, Pauline Bourgeon, and Jean-Charles Bricongne. 2017. “Aggregate Fluctuations and International
Migration.” The Scandinavian Journal of Economics. http://doi.wiley.com/10.1111/sjoe.12258 (June 15, 2018).
Beine, Michel, Frédéric Docquier, and Çağlar Özden. 2011. “Diasporas.” Journal of Development Economics 95(1): 30–
41.
Beine, Michel, Romain Noël, and Lionel Ragot. 2014. “Determinants of the International Mobility of Students.”
Economics of Education Review 41: 40–54.
Beine, Michel, and Christopher Parsons. 2015. “Climatic Factors as Determinants of International Migration.” The
Scandinavian Journal of Economics 117(2): 723–67.
Belot, Michèle, and Sjef Ederveen. 2012. “Cultural Barriers in Migration between OECD Countries.” Journal of Population
Economics 25(3): 1077–1105.
Belot, Michèle V. K., and Timothy J. Hatton. 2012. “Immigrant Selection in the OECD*.” The Scandinavian Journal of
Economics 114(4): 1105–28.
Benson, Michaela, and Karen O’Reilly. 2009. Lifestyle Migration: Expectations, Aspirations and Experiences. Farnham:
Ashgate.
Berg, Ellen L., and Douglas J. Besharov. 2016. “Patterns of Global Migration.” In Adjusting to a World in Motion: Trends
in Global Migration and Migration Policy, International Policy Exchange Series, eds. Douglas J. Besharov and
Mark Hugo López. Oxford ; New York: Oxford University Press, 58–78.
Berlemann, Michael, and Max Friedrich Steinhardt. 2017. “Climate Change, Natural Disasters, and Migration—a Survey
of the Empirical Evidence.” CESifo Economic Studies 63(4): 353–85.

BIBLIOGRAPHY| 86
Bertoli, Simone, and Frédéric Docquier. 2016. “International Migration and Inequality Across Nations.” The World
Economy 39(4): 476–77.
Bertoli, Simone, and Ilse Ruyssen. 2016. “Networks and Migrants’ Intended Destination.”
https://papers.ssrn.com/sol3/papers.cfm?abstract_id=2840157.
Biagi, F, S Grubanov-Boskovic, F Natale, and Sebastian Lago R. 2018. “Migrant Workers and the Digital Transformation
in the EU.” (KJ-NA-29269-EN-C (print),KJ-NA-29269-EN-N (online)).
Bijak, Jakub. 2011. 24 Forecasting International Migration in Europe: A Bayesian View. Dordrecht: Springer Netherlands.
http://link.springer.com/10.1007/978-90-481-8897-0 (January 18, 2016).
Bjerre, Liv. 2017. “Immigration Policy Effects – A Conceptual Framework.” IMI Working Paper Series: 1–28.
Bjerre, Liv, Marc Helbling, Friederike Römer, and Malisa Zobel. 2016. The Immigration Policies in Comparison (IMPIC)
Dataset: Technical Report. Berlin.
Black, Richard, Stephen R. G. Bennett, Sandy M. Thomas, and John R. Beddington. 2011. “Migration as Adaptation.”
Nature 478(7370): 447–49.
Boccagni, Paolo, and Loretta Baldassar. 2015. “Emotions on the Move: Mapping the Emergent Field of Emotion and
Migration.” Emotion, Space and Society 16: 73–80.
Bodvarsson, Örn B., and Hendrik Van den Berg. 2013. The Economics of Immigration: Theory and Policy. Second edition.
Dordrecht ; New York: Springer.
Bohra-Mishra, Pratikshya, and Douglas S. Massey. 2011. “Individual Decisions to Migrate During Civil Conflict.”
Demography 48(2): 401–24.
Bohra-Mishra, Pratikshya, Michael Oppenheimer, and Solomon M. Hsiang. 2014. “Nonlinear Permanent Migration
Response to Climatic Variations but Minimal Response to Disasters.” Proceedings of the National Academy of
Sciences 111(27): 9780–85.
Borjas, George. 1987. Self-Selection and the Earnings of Immigrants. Cambridge, MA: National Bureau of Economic
Research. http://www.nber.org/papers/w2248.pdf (June 15, 2018).
Borjas, George J. 1989. “Economic Theory and International Migration Economic Theory and International Migration.”
International Migration Review 23(3): 457–85.
Brettell, Caroline B., and Hollifield James F. 2000. Migration Theory: Talking across Disciplines. New York: Routledge.
Bronen, R. 2013. Climate-Induced Displacement of Alaska Native Communities.
Bronen, Robin. 2011. “Climate-Induced Community Relocations: Creating an Adaptive Governance Framework Based in
Human Rights Doctrine.” New York University Review Law & Social Change 35: 357–408.
———. 2015. “Climate-Induced Community Relocations: Using Integrated Social-Ecological Assessments to Foster
Adaptation and Resilience.” Ecology and Society 20(3): art36.
Cai, Ruohong, Shuaizhang Feng, Michael Oppenheimer, and Mariola Pytlikova. 2016. “Climate Variability and
International Migration: The Importance of the Agricultural Linkage.” Journal of Environmental Economics and
Management 79: 135–51.
Campaniello, Nadia. 2014. “The Causal Effect of Trade on Migration: Evidence from Countries of the Euro-
Mediterranean Partnership.” Labour Economics 30: 223–33.
Carling, Jørgen, and Francis Collins. 2018a. “Aspiration, Desire and Drivers of Migration.” Journal of Ethnic and Migration
Studies 44(6): 909–26.
Carling, Jørgen, and Kerilyn Schewel. 2018. “Revisiting Aspiration and Ability in International Migration.” Journal of
Ethnic and Migration Studies 44(6): 945–63.
Castles, Stephen. 2004. “Why Migration Policies Fail.” Ethnic and Racial Studies 27(2): 205–27.
Castles, Stephen, Hein de Haas, and Mark J. Miller. 2014. The Age of Migration: International Population Movements in
the Modern World. Fifth edition. New York: Guilford Press.

BIBLIOGRAPHY| 87
Castles, Stephen, Ellie Vasta, and Derya Ozkul. 2014. “Australia.” In Controlling Immigration. A Global Perspective, eds.
James F. Hollifield, Philip L. Martin, and Pia M. Orrenius. , 128–50.
Cattaneo, Cristina, and Giovanni Peri. 2016. “The Migration Response to Increasing Temperatures.” Journal of
Development Economics 122: 127–46.
CGE. 1925. Conferenza Internazionale Dell’emigrazione e Dell’immigrazione – Roma, 1924. Rome: Tip. Camera Deputati.
Clark, Ximena, Timothy J Hatton, and Jeffrey G Williamson. 2007. “Explaining U.S. Immigration, 1971–1998.” The Review
of Economics and Statistics 89(2): 359–73.
Clemens, Michael A. 2014a. “Does Development Reduce Migration?” : 46.
Clemens, Michael A. 2014b. “Does Development Reduce Migration?” SSRN Electronic Journal.
http://www.ssrn.com/abstract=2457264 (June 15, 2018).
Clemens, Michael A, and Hannah M. Postel. 2017. “Deterring Emigration with Foreign Aid: An Overview of Evidence
from Low-Income Countries.” http://ftp.iza.org/pp136.pdf.
Collier, Paul. 2013. Exodus How Migration Is Changing Our World. New York: Oxford University Press.
http://public.eblib.com/choice/publicfullrecord.aspx?p=1336500_ (January 18, 2016).
Collins, Francis L. 2018. “Desire as a Theory for Migration Studies: Temporality, Assemblage and Becoming in the
Narratives of Migrants.” Journal of Ethnic and Migration Studies 44(6): 964–80.
Coniglio, Nicola D., and Giovanni Pesce. 2015. “Climate Variability and International Migration: An Empirical Analysis.”
Environment and Development Economics 20(04): 434–68.
Conte, Alessandra, and Silvia Migali. The Role of Conflict and Organized Violence in International Forced Migration.
Manuscript submitted for publication.
Cummins, Matthew, and Francisco Rodríguez. 2010a. “A Rejoinder to Ruhs.” Journal of Human Development and
Capabilities 11(2): 311–14.
———. 2010b. “Is There a Numbers versus Rights Trade‐off in Immigration Policy? What the Data Say.” Journal of
Human Development and Capabilities 11(2): 281–303.
Curtis, Katherine J, and Annemarie Schneider. 2011. “Understanding the Demographic Implications of Climate Change:
Estimates of Localized Population Predictions under Future Scenarios of Sea-Level Rise.” Population and
Environment 33(1): 28–54.
Cutter, Susan L. 1996. “Vulnerability to Environmental Hazards.” Progress in Human Geography 20(4): 529–39.
———. 2008. “A Place-Based Model for Understanding Community Resilience to Natural Disasters.” Global
Environmental Change 18(4): 598–606.
Cutter, Susan L., Bryan J. Boruff, and W. Lynn Shirley. 2003. “Social Vulnerability to Environmental Hazards.” Social
Science Quarterly 84(2): 242–61.
Czaika, Mathias, and Hein De Haas. 2013. “The Effectiveness of Immigration Policies.” Population and Development
Review 39(3): 487–508.
Czaika, Mathias, and Hein de Haas. 2014. “The Globalization of Migration: Has the World Become More Migratory?”
International Migration Review 48(2): 283–323.
Dallmann, Ingrid, and Katrin Millock. 2017. “Climate Variability and Inter-State Migration in India.” CESifo Economic
Studies 63(4): 560–94.
Dao, Thu Hien, Frédéric Docquier, Chris Parsons, and Giovanni Peri. 2018. “Migration and Development: Dissecting the
Anatomy of the Mobility Transition.” Journal of Development Economics 132: 88–101.
Dasgupta, P. et al. 2014. “Rural Areas.” In Climate Change 2014: Impacts, Adaptation, and Vulnerability. Part A: Global
and Sectoral Aspects. Contribution of Working Group II to the Fifth Assessment Report of the Intergovernmental
Panel on Climate Change, eds. C.B. Field et al. Cambridge, UK, and New York NY, USA: Cambridge University
Press, Cambridge, United Kingdom.
Davenport, Christina, Will Moore, and Steven Poe. 2003. “Sometimes You Just Have to Leave: Domestic Threats and
Forced Migration, 1964-1989.” International Interactions 29(1): 27–55.

BIBLIOGRAPHY| 88
De Haas, Hein. 2010. “Migration Transitions. A Theoretical and Empirical Inquiry into the Developmental Drivers of
International Migration.” IMI Working Papers (24).
———. 2018. “International Migration. Trends, Determinants and Policy Effects.” IMIn Working Papers 142.
Dell, Melissa, Benjamin F Jones, and Benjamin A Olken. 2012. “Temperature Shocks and Economic Growth: Evidence
from the Last Half Century.” American Economic Journal: Macroeconomics 4(3): 66–95.
Disney, George et al. 2016. “Evaluation of Existing Migration Forecasting Methods and Models.”
https://www.gov.uk/government/uploads/system/uploads/attachment_data/file/467405/Migration_Forecas
ting_report.pdf (January 18, 2016).
Docquier, Frédéric, Giovanni Peri, and Ilse Ruyssen. 2014. “The Cross-Country Determinants of Potential and Actual
Migration.” International Migration Review 48: S37–99.
Docquier, Frédéric, and Hillel Rapoport. 2012. “Globalization, Brain Drain, and Development.” Journal of Economic
Literature 50(3): 681–730.
Dosio, Alessandro, Lorenzo Mentaschi, Erich M Fischer, and Klaus Wyser. 2018. “Extreme Heat Waves under 1.5°C and
2°C Global Warming.” Environmental Research Letters.
Drabo, Alassane, and Linguère Mously Mbaye. 2015. “Natural Disasters, Migration and Education: An Empirical Analysis
in Developing Countries.” Environment and Development Economics 20(06): 767–96.
Dun, Olivia. 2011. “Migration and Displacement Triggered by Floods in the Mekong Delta.” International Migration 49:
e200–223.
Dustmann, Christian, and Joseph-Simon Görlach. 2016. “The Economics of Temporary Migrations.” Journal of Economic
Literature 54(1): 98–136.
Egger, Peter H., Maximilian von Ehrlich, and Douglas R. Nelson. 2012. “Migration and Trade: MIGRATION AND TRADE.”
The World Economy 35(2): 216–41.
Elliott, James R., and Jeremy Pais. 2006. “Race, Class, and Hurricane Katrina: Social Differences in Human Responses to
Disaster.” Social Science Research 35(2): 295–321.
Esipova, Neli, Rajesh Srinivasan, and Julie Ray. 2016. “Global Desires to Migrate.” In Adjusting to a World in Motion:
Trends in Global Migration and Migration Policy, International Policy Exchange Series, eds. Douglas J. Besharov
and Mark Hugo López. Oxford ; New York: Oxford University Press, 21–57.
Falk, William W., Matthew O. Hunt, and Larry L. Hunt. 2006. “HURRICANE KATRINA AND NEW ORLEANIANS’ SENSE OF
PLACE: Return and Reconstitution or ‘Gone with the Wind’?” Du Bois Review: Social Science Research on Race
3(01).
Fassmann, Heinz, Ursula Reeger, and Wiebke Sievers, eds. 2009. Statistics and Reality : Concepts and Measurements of
Migration in Europe. Amsterdam: Amsterdam University Press. http://www.oapen.org/record/340025 (June
13, 2018).
Feng, S., A. B. Krueger, and M. Oppenheimer. 2010. “Linkages among Climate Change, Crop Yields and Mexico-US Cross-
Border Migration.” Proceedings of the National Academy of Sciences 107(32): 14257–62.
Feng, Shuaizhang, Michael Oppenheimer, and Wolfram Schlenker. 2012. Climate Change, Crop Yields, and Internal
Migration in the United States. Cambridge, MA.
Ferrie, Joseph P., and Timothy J. Hatton. 2015. “Two Centuries of International Migration.” In Handbook of the
Economics of International Migration, Elsevier, 53–88.
http://linkinghub.elsevier.com/retrieve/pii/B9780444537645000025 (June 15, 2018).
Findley, Sally E. 1994. “Does Drought Increase Migration? A Study of Migration from Rural Mali during the 1983-1985
Drought.” International Migration Review 28(3): 539.
Foresight. 2011. Migration and Global Environmental Change: Future Challenges and Opportunities. London, UK.
Frey, W.H., and A. Singer. 2006. Katrina and Rita Impacts on Gulf Coast Populations: First Census Findings. Washington
DC, USA.

BIBLIOGRAPHY| 89
Geis, Wido, Silke Uebelmesser, and Martin Werding. 2011. “Why Go to France or Germany, If You Could as Well Go to
the UK or the US? Selective Features of Immigration to the EU ‘Big Three’ and the United States.” JCMS: Journal
of Common Market Studies 49(4): 767–96.
Gest, Justin, and Anna Boucher. 2018. Crossroads of Migration: A Global Approach to National Differences. Cambridge,
United Kingdom ; New York, NY: Cambridge University Press.
Gibney, Mark, Linda Cornett, Reed Wood, Peter Haschke, Daniel Arnon, and Attilio Pisanò. 2017. The Political Terror
Scale 1976-2016. Retrieved from the Political Terror Scale website: http://www.politicalterrorscale.org.
Gila, Oscar Alvarez, Ana Ugalde Zaratiegui, and Virginia López De Maturana Diéguez. 2011. “Western Sahara: Migration,
Exile and Environment.” International Migration 49: e146–63.
Giulietti, Corrado. 2014. “The Welfare Magnet Hypothesis and the Welfare Take-up of Migrants.” IZA World of Labor.
http://wol.iza.org/articles/welfare-magnet-hypothesis-and-welfare-take-up-of-migrants (November 27,
2017).
Gizelis, Theodora-Ismene, and Amanda E. Wooden. 2010. “Water Resources, Institutions, & Intrastate Conflict.”
Political Geography 29(8): 444–53.
Global Humanitarian Forum. 2009. Human Impact Report: Climate Change — The Anatomy of a Silent Crisis. Geneva,
Switzer land.
Grapsa, Erofili. 2018. The Demographic and Educational Drivers of International Emigration. European Commission.
http://publications.jrc.ec.europa.eu/repository/bitstream/JRC110388/demographic_and_educational_driver
s_of_international_emigration.pdf.
Gray, C. L., and V. Mueller. 2012. “Natural Disasters and Population Mobility in Bangladesh.” Proceedings of the National
Academy of Sciences 109(16): 6000–6005.
Gray, Clark, and Richard Bilsborrow. 2013. “Environmental Influences on Human Migration in Rural Ecuador.”
Demography 50(4): 1217–41.
Gray, Clark L. 2009. “Environment, Land, and Rural Out-Migration in the Southern Ecuadorian Andes.” World
Development 37(2): 457–68.
Gray, Clark L. 2010. “Gender, Natural Capital, and Migration in the Southern Ecuadorian Andes.” Environment and
Planning A 42(3): 678–96.
Gray, Clark L. 2011. “Soil Quality and Human Migration in Kenya and Uganda.” Global Environmental Change 21(2): 421–
30.
Gray, Clark, and Valerie Mueller. 2012. “Drought and Population Mobility in Rural Ethiopia.” World Development 40(1):
134–45.
Gray, Clark, and Erika Wise. 2016. “Country-Specific Effects of Climate Variability on Human Migration.” Climatic Change
135(3–4): 555–68.
Grogger, Jeffrey, and Gordon H. Hanson. 2011. “Income Maximization and the Selection and Sorting of International
Migrants.” Journal of Development Economics 95(1): 42–57.
Gröschl, Jasmin. 2012. “Climate Change and the Relocation of Population.” In Beiträge Zur Jahrestagung Des Vereins Für
Socialpolitik 2012: Neue Wege Und Herausforderungen Für Den Arbeitsmarkt Des 21. Jahrhunderts - Session:
Migration II, No. D03-V1, German Economic Association.
de Haas, Hein et al. 2018. “International Migration: Trends, Determinants and Policy Effects.”
de Haas, Hein, Katharina Natter, and Simona Vezzoli. 2015. “Conceptualizing and Measuring Migration Policy Change.”
Comparative Migration Studies 3(1): 1–21.
———. 2016. “Growing Restrictiveness or Changing Selection? The Nature and Evolution of Migration Policies.”
International Migration Review. http://doi.wiley.com/10.1111/imre.12288 (March 20, 2017).
Harris, John R., and Michael P. Todaro. 1970. “Migration, Unemployment and Development: A Two-Sector Analysis.”
The American Economic Review 60(1): 126–42.
Hatton, Timothy. J. 2004. “Seeking Asylum in Europe.” Economic Policy 19(38): 6–62.

BIBLIOGRAPHY| 90
Hatton, Timothy J. 2009. “The Rise and Fall of Asylum: What Happened and Why?” The Economic Journal 119(535):
F183–213.
———. 2016. “Refugees, Asylum Seekers, and Policy in OECD Countries.” American Economic Review 106(5): 441–45.
Hatton, Timothy J., and Jeffrey G. Williamson. 2005. Global Migration and the World Economy: Two Centuries of Policy
and Performance. Cambridge, Mass. ; London: MIT Press.
Hauser, Mathew E. 2017. “Migration Induced by Sea-Level Rise Could Reshape the US Population Landscape.” Nature
Climate Change 7(5): 321–25.
Helbling, Marc, Liv Bjerre, Friederike Römer, and Malisa Zobel. 2017. “Measuring Immigration Policies: The IMPIC
Database.” European Political Science 16(1): 79–98.
Helbling, Marc, and Dorina Kalkum. 2017. “Migration Policy Trends in OECD Countries.” Journal of European Public
Policy.
Helbling, Marc, and David Leblang. 2018. “Controlling Immigration? How Regulations Affect Migration Flows:
CONTROLLING IMMIGRATION?” European Journal of Political Research. http://doi.wiley.com/10.1111/1475-
6765.12279 (June 15, 2018).
Henderson, J. Vernon, Adam Storeygard, and Uwe Deichmann. 2017. “Has Climate Change Driven Urbanization in
Africa?” Journal of Development Economics 124: 60–82.
Henry, Sabine, Paul Boyle, and Eric F. Lambin. 2003. “Modelling Inter-Provincial Migration in Burkina Faso, West Africa:
The Role of Socio-Demographic and Environmental Factors.” Applied Geography 23(2–3): 115–36.
Henry, Sabine, Bruno Schoumaker, and Cris Beauchemin. 2004. “The Impact of Rainfall on the First Out-Migration: A
Multi-Level Event-History Analysis in Burkina Faso.” Population and Environment 25(5): 423–60.
Hirvonen, Kalle. 2016. “Temperature Changes, Household Consumption, and Internal Migration: Evidence from
Tanzania.” American Journal of Agricultural Economics 98(4): 1230–49.
Hollifield, James F. 2006. “The Emerging Migration State.” International Migration Review 38(3): 885–912.
Hollifield, James F., Philip L. Martin, and Pia M. Orrenius. 2014a. Controlling Immigration. A Global Perspective. Stanford:
Stanford University Press.
Hooghe, Marc, Ann Trappers, Bart Meuleman, and Tim Reeskens. 2008. “Migration to European Countries: A Structural
Explanation of Patterns, 1980–20041.” International Migration Review 42(2): 476–504.
Hsiang, S. M. 2010. “Temperatures and Cyclones Strongly Associated with Economic Production in the Caribbean and
Central America.” Proceedings of the National Academy of Sciences 107(35): 15367–72.
Hsiang, S. M., M. Burke, and E. Miguel. 2013. “Quantifying the Influence of Climate on Human Conflict.” Science
341(6151): 1235367–1235367.
Hunter, Lori M., Sheena Murray, and Fernando Riosmena. 2013. “Rainfall Patterns and U.S. Migration from Rural
Mexico.” International Migration Review 47(4): 874–909.
IPCC. 2014. Fifth Assessment Report - Intergovernmental Panel on Climate Change. Geneva, Switzerland.
Iqbal, KAZI, and PARITOSH K. Roy. 2015. “Climate Change, Agriculture and Migration: Evidence from Bangladesh.”
Climate Change Economics 06(02): 1550006.
Jacobson, Jodi L. 1988. “Environmental Refugees: A Yardstick of Habitability.” Bulletin of Science, Technology & Society
8(3): 257–58.
Jennings, Julia A, and Clark L Gray. 2015. “Climate Variability and Human Migration in the Netherlands, 1865--1937.”
Population and Environment 36(3): 255–78.
Jerome, Harry. 1926. Migration and Business Cycles. New York: National Bureau of Economic Research.
Joppke, Christian. 1998. “Why Liberal States Accept Unwanted Immigration.” World Politics 50(02): 266–93.
Joseph, George, and Quentin Wodon. 2013. “Is Internal Migration in Yemen Driven by Climate or Socio-Economic
Factors?” Review of International Economics 21(2): 295–310.

BIBLIOGRAPHY| 91
Jülich, Sebastian. 2011. “Drought Triggered Temporary Migration in an East Indian Village.” International Migration 49:
e189–99.
Kartiki, Katha. 2011. “Climate Change and Migration: A Case Study from Rural Bangladesh.” Gender & Development
19(1): 23–38.
King, Russell, and Ronald Skeldon. 2010. “‘Mind the Gap!’ Integrating Approaches to Internal and International
Migration.” Journal of Ethnic and Migration Studies 36(10): 1619–46.
Kniveton, Dominic, Christopher Smith, and Sharon Wood. 2011. “Agent-Based Model Simulations of Future Changes in
Migration Flows for Burkina Faso.” Global Environmental Change 21: S34–40.
Koubi, Vally, Gabriele Spilker, Lena Schaffer, and Thomas Bernauer. 2016. “Environmental Stressors and Migration:
Evidence from Vietnam.” World Development 79: 197–210.
Koubi, Vally, Gabriele Spilker, Lena Schaffer, and Tobias Böhmelt. 2016. “The Role of Environmental Perceptions in
Migration Decision-Making: Evidence from Both Migrants and Non-Migrants in Five Developing Countries.”
Population and Environment 38(2): 134–63.
Kraly, E. P., and K. S. Gnanasekaran. 1987. “Efforts to Improve International Migration Statistics: A Historical
Perspective.” The International Migration Review 21(4): 967–95.
Kubik, Zaneta, and Mathilde Maurel. 2016. “Weather Shocks, Agricultural Production and Migration: Evidence from
Tanzania.” The Journal of Development Studies 52(5): 665–80.
Kumari Rigaud, Kanta et al. 2018. Groundswell: Preparing for Internal Climate Migration. Washington DC, USA.
Kureková, Lucia. 2013. “Welfare Systems as Emigration Factor: Evidence from the New Accession States: Welfare
Systems as Emigration Factor.” JCMS: Journal of Common Market Studies 51(4): 721–39.
Lakner, Christoph, and Branko Milanovic. 2016. “Global Income Distribution: From the Fall of the Berlin Wall to the
Great Recession.” The World Bank Economic Review 30(2): 203–32.
Lanati, Mauro, and Rainer Thiele. 2017. “The Impact of Foreign Aid on Migration Revisited.”
http://cadmus.eui.eu/bitstream/handle/1814/46124/MWP_2017_05.pdf?sequence=1.
Lanati, Mauro, and Alessandra Venturini. 2018. “Cultural Change and the Migration Choice.”
file:///C:/Users/migalsi/Downloads/SSRN-id3153379.pdf.
Landry, C. et al. 2007. “Going Home: Evacuation-Migration Decisions of Hurricane Katrina Survivors.” Southern Economic
Journal 74(2): 326–43.
Lee, Everett S. 1966. “A Theory of Migration.” Demography 3(1): 47–57.
Lee, Ronald. 2003. “The Demographic Transition: Three Centuries of Fundamental Change.” Journal of Economic
Perspectives 17(4): 167–90.
López-Carr, David. 2012. “Agro-Ecological Drivers of Rural out-Migration to the Maya Biosphere Reserve, Guatemala.”
Environmental Research Letters 7(4): 045603.
Lucassen, Jan, and Leo Lucassen. 2009. “The Mobility Transition Revisited, 1500–1900: What the Case of Europe Can
Offer to Global History.” Journal of Global History 4(03): 347.
Lutz, Wolfgang et al. 2018. “Demographic and Human Capital Scenarios for the 21st Century.” : 598.
Manchin, Miriam, and Sultan Orazbayev. 2016. “Social Networks and the Intention to Migrate.” SSRN Electronic Journal.
http://www.ssrn.com/abstract=2974097 (June 15, 2018).
Manning, Patrick. 2005. Migration in World History. New York-London: Routledge.
Marchiori, Luca, Jean-François Maystadt, and Ingmar Schumacher. 2012. “The Impact of Weather Anomalies on
Migration in Sub-Saharan Africa.” Journal of Environmental Economics and Management 63(3): 355–74.
Marino, Elizabeth. 2012. “The Long History of Environmental Migration: Assessing Vulnerability Construction and
Obstacles to Successful Relocation in Shishmaref, Alaska.” Global Environmental Change 22(2): 374–81.

BIBLIOGRAPHY| 92
Martin, Philip. 2014. “The Determinants of Migration. In Search of Turning Points.” In Global and Asian Perspectives on
International Migration, ed. Graziano Battistellla. Cham, Heidelberg, New York, Dordrecht, London: Springer,
225–46.
Martin, Susan F. 2015. “International Migration and Global Governance.” Global Summitry 1(1): 64–83.
Massey, Douglas S. 1990. “Social Structure, Household Strategies, and the Cumulative Causation of Migration.”
Population Index 56(1): 3–26.
———. 1993. “Theories of International Migration: A Review and Appraisal.” Population and Development Review 19(3):
431–66.
Massey, Douglas S, William G Axinn, and Dirgha J Ghimire. 2010. “Environmental Change and Out-Migration: Evidence
from Nepal.” Population and Environment 32(2): 109–36.
Massey, Douglas S., and Felipe García España. 1987. “The Social Process of International Migration.” Science 237(4816):
733–38.
Mastrorillo, Marina et al. 2016. “The Influence of Climate Variability on Internal Migration Flows in South Africa.” Global
Environmental Change 39: 155–69.
Maurel, Mathilde, and Michele Tuccio. 2016. “Climate Instability, Urbanisation and International Migration.” The Journal
of Development Studies 52(5): 735–52.
Mayda, Anna Maria. 2010a. “International Migration: A Panel Data Analysis of the Determinants of Bilateral Flows.”
Journal of Population Economics 23(4): 1249–74.
McKenzie, David, and Hillel Rapoport. 2010. “Self-Selection Patterns in Mexico-U.S. Migration: The Role of Migration
Networks.” Review of Economics and Statistics 92(4): 811–21.
McKeown, Adam. 2004. “Global Migration, 1846–1940*.” Journal of World History 15(2): 155–89.
McLeman, R, and B Smit. 2006. “Migration as an Adaptation to Climate Change.” Climatic Change 76(1): 31–53.
McLeman, Robert A. 2014. Climate and Human Migration: Past Experiences, Future Challenges. Cambridge UK:
Cambridge University Press, Cambridge, United Kingdom.
McLeman, Robert A, and S Kate Ploeger. 2012. “Soil and Its Influence on Rural Drought Migration: Insights from
Depression-Era Southwestern Saskatchewan, Canada.” Population and Environment 33(4): 304–32.
Melander, Erik, and Magnus Öberg. 2007. “The Threat of Violence and Forced Migration: Geographical Scope Trumps
Intensity of Fighting.” Civil Wars 9(2): 156–73.
Mercandalli, S., and B. Losch. 2017. Rural Africa in Motion. Dynamics and Drivers of Migration South of the Sahara.
Rome, Italy.
Meze-Hausken, Elisabeth. 2000. “Migration Caused by Climate Change: How Vulnerable Are People Inn Dryland Areas?”
Mitigation and Adaptation Strategies for Global Change 5(4): 379–406.
Migali, Silvia. 2018. “Migration and Institutions: Evidence from Internal EU Mobility.” The World Economy 41(1): 29–58.
Migali, Silvia, and Fabrizio Natale. 2017. The Determinants of Migration to the EU: Evidence from Residence Permits
Data. European Commission.
http://publications.jrc.ec.europa.eu/repository/bitstream/JRC107078/kjna28685enn.pdf.
Migali, Silvia, and Marco Scipioni. 2018. A Global Analysis of Intentions to Migrate. European Commission.
https://ec.europa.eu/jrc/sites/jrcsh/files/technical_report_on_gallup_v7_finalpubsy.pdf.
Miola, A et al. 2015. Index for the EU Global Climate Change Alliance plus Flagship Initiative. Luxembourg.
Missirian, Anouch, and Wolfram Schlenker. 2017. “Asylum Applications Respond to Temperature Fluctuations.” Science
358(6370): 1610–14.
Morrison-Métois, Susanna. 2017. Responding to Refugee Crises: Lessons from Evaluations in Afghanistan as a Country
of Origin. . OECD Development Co-operation Working Papers. https://www.oecd-
ilibrary.org/development/responding-to-refugee-crises_de7e6a13-en (June 15, 2018).

BIBLIOGRAPHY| 93
Mortreux, Colette, and Jon Barnett. 2009. “Climate Change, Migration and Adaptation in Funafuti, Tuvalu.” Global
Environmental Change 19(1): 105–12.
Mueller, V., C. Gray, and K. Kosec. 2014. “Heat Stress Increases Long-Term Human Migration in Rural Pakistan.” Nature
Climate Change 4(3): 182–85.
Murakami, Daisuke, and Yoshiki Yamagata. 2016. “Estimation of Gridded Population and GDP Scenarios with Spatially
Explicit Statistical Downscaling.”
Myers, N. 2002. “Environmental Refugees: A Growing Phenomenon of the 21st Century.” Philosophical Transactions of
the Royal Society B: Biological Sciences 357(1420): 609–13.
Myrdal, Gunnar. 1957. Rich Lands and Poor: The Road to World Prosperity. 1st ed. New York: Harper & Row.
Natale, Fabrizio, Silvia Migali, and Rainer Münz. 2018. “Many More to Come? Migration from and within Africa.”
Naumann, G. et al. 2018. “Global Changes in Drought Conditions Under Different Levels of Warming.” Geophysical
Research Letters.
Nawrotzki, Raphael J., and Maryia Bakhtsiyarava. 2017. “International Climate Migration: Evidence for the Climate
Inhibitor Mechanism and the Agricultural Pathway.” Population, Space and Place 23(4): e2033.
Nawrotzki, Raphael J, Fernando Riosmena, and Lori M Hunter. 2013. “Do Rainfall Deficits Predict U.S.-Bound Migration
from Rural Mexico? Evidence from the Mexican Census.” Population Research and Policy Review 32(1): 129–
58.
Neher, Frank, and Apollonia Miola. 2016. Culture and Resilience. Ispra VA, Italy.
Neumayer, Eric. 2004. “Asylum Destination Choice: What Makes Some West European Countries More Attractive Than
Others?” European Union Politics 5(2): 155–80.
Nielsen, Jonas Østergaard, and Anette Reenberg. 2010. “Cultural Barriers to Climate Change Adaptation: A Case Study
from Northern Burkina Faso.” Global Environmental Change 20(1): 142–52.
Noy, Ilan. 2017. “To Leave or Not to Leave? Climate Change, Exit, and Voice on a Pacific Island.” CESifo Economic Studies
63(4): 403–20.
OECD. 2016. Perspectives on Global Development 2017. OECD Publishing. http://www.oecd-
ilibrary.org/development/perspectives-on-global-development-2017_persp_glob_dev-2017-en (March 10,
2017).
OECD, and EU, eds. 2015. Indicators of Immigrant Integration 2015: Settling In. Paris: OECD.
Oliver-Smith, A. 2011. “Sea Level Rise, Local Vulnerability and Involuntary Migration.” In Migration and Climate Change,
eds. E Piguet, Pécoud A., and P De Guchteneire. , 160–187.
Ortega, Francesc, and Giovanni Peri. 2009. The Causes and Effects of International Migrations: Evidence from OECD
Countries 1980-2005. Cambridge, MA: National Bureau of Economic Research.
http://www.nber.org/papers/w14833.pdf (September 14, 2017).
———. 2013. “The Effect of Income and Immigration Policies on International Migration.” Migration Studies 1(1): 47–
74.
Page Moch, Leslie. 1992. Moving Europeans. Migrations in Western Europe since 1650. Blooomington: Indiana
University Press.
———. 2007. “Connecting Migration and World History: Demographic Patterns, Family Systems and Gender.”
International Review of Social History 52(1): 97–104.
Pal, Jeremy S., and Elfatih A. B. Eltahir. 2016. “Future Temperature in Southwest Asia Projected to Exceed a Threshold
for Human Adaptability.” Nature Climate Change 6(2): 197–200.
Passaris, Constantine. 1989. “Immigration and the Evolution of Economic Theory.” International Migration 27(4): 525–
42.
Paul, Bimal Kanti. 2005. “Evidence against Disaster-Induced Migration: The 2004 Tornado in North-Central Bangladesh.”
Disasters 29(4): 370–85.

BIBLIOGRAPHY| 94
Pedersen, Peder J., Mariola Pytlikova, and Nina Smith. 2008. “Selection and Network Effects—Migration Flows into
OECD Countries 1990–2000.” European Economic Review 52(7): 1160–86.
Peri, Giovanni, and Francesc Ortega. 2009. The Causes and Effects of International Labor Mobility: Evidence from OECD
Countries 1980–2005. New York: United Nations Development Programme (UNDP).
Peri, Giovanni, Kevin Shih, and Chad Sparber. 2015. Foreign and Native Skilled Workers: What Can We Learn from H-1B
Lotteries? Cambridge, MA: National Bureau of Economic Research. http://www.nber.org/papers/w21175.pdf
(April 20, 2018).
Piore, Michael J. 1986. “The Shifting Grounds for Immigration.” The ANNALS of the American Academy of Political and
Social Science: 23–33.
Pomeranz, Kenneth. 2000. The Great Divergence: China, Europe, and the Making of the Modern World Economy.
Princeton, NJ: Princeton University Press.
Radelet, Steven C. 2010. Emerging Africa: How 17 Countries Are Leading the Way. Baltimore, MD: Center for Global
Development.
Ramos, Raul. 2017. “Modelling Migration.” In The Econometrics of Multi-Dimensional Panels, ed. Laszlo Matyas. Cham:
Springer International Publishing, 377–95. http://link.springer.com/10.1007/978-3-319-60783-2_13 (June 15,
2018).
Rapoport, Hillel. 2016. “Migration and Globalization: What’s in It for Developing Countries?” International Journal of
Manpower 37(7): 1209–26.
Ravenstein, E. G. 1885. “The Laws of Migration.” Journal of the Statistical Society of London 48(2): 167–235.
Razin, Assaf, and Efraim Sadka. 2014. “Migration States and Welfare States: Why Is America Different from Europe?”
VoxEU.org. https://voxeu.org/article/migration-and-welfare-us-and-europe (March 2, 2018).
Reitz, Jeffrey G. 2014. “Canada.” In Controllin Immigration. A Global Perspective, eds. Philip L. Martin, Pia M. Orrenius,
and James F. Hollifield. Stanford: Stanford University Press.
Reuveny, Rafael, and Will H. Moore. 2009. “Does Environmental Degradation Influence Migration? Emigration to
Developed Countries in the Late 1980s and 1990s.” Social Science Quarterly 90(3): 461–79.
Riahi, Keywan et al. 2017. “The Shared Socioeconomic Pathways and Their Energy, Land Use, and Greenhouse Gas
Emissions Implications: An Overview.” Global Environmental Change 42: 153–68.
Ruhs, Martin. 2015. The Price of Rights. Oxford: Princeton University Press.
Ruhs, Martin, and Philip Martin. 2008. “Numbers vs. Rights: Trade-Offs and Guest Worker Programs1.” International
Migration Review 42(1): 249–65.
Sargan, John Denis. 2003. “CURRENT PROBLEMS IN ECONOMETRICS— A PERSONAL VIEW: Address on the Occasion of
the Investiture of Professor John Denis Sargan with the Degree of Doctor Honoris Causa of the University Carlos
III, 2 February 1993.” Econometric Theory 19(3): 423–28.
Sassen, S. 2016. “A Massive Loss of Habitat: New Drivers for Migration.” Sociology of Development 2(2): 204–33.
Sassen, Saskia. 1988. The Mobility of Labor and Capital: A Study in International Investment and Labor Flow. Cambridge:
Cambridge University Press.
———. 2014. Expulsions: Brutality and Complexity in the Global Economy. Cambridge, Massachusetts: The Belknap Press
of Harvard University Press.
Scheffran, Jurgen et al. 2012. “Disentangling the Climate-Conflict Nexus: Empirical and Theoretical Assessment of
Vulnerabilities and Pathways.” Review of European Studies 4(5).
Scheffran, Jurgen, Elina Marmer, and Papa Sow. 2012. “Migration as a Contribution to Resilience and Innovation in
Climate Adaptation: Social Networks and Co-Development in Northwest Africa.” Applied Geography 33: 119–
27.
Scheibelhofer, Elisabeth. 2018. “Shifting Migration Aspirations in Second Modernity.” Journal of Ethnic and Migration
Studies 44(6): 999–1014.
Sjaastad, Larry A. 1962. “The Costs and Returns of Human Migration.” Journal of Political Economy 70(5, Part 2): 80–93.

BIBLIOGRAPHY| 95
Skeldon, Ronald. 1997. Migration and Development: A Global Perspective. Harlow: Longman.
———. 2012. “Migration Transitions Revisited: Their Continued Relevance for The Development of Migration Theory:
Migration Transitions Revisited.” Population, Space and Place 18(2): 154–66.
Stark, Oded. 1991. The Migration of Labor. Oxford: Basil Blackwell.
Stern, Nicholas. 2006. Stern Review : The Economics of Climate Change.
Tacoli, Cecilia. 2009. “Crisis or Adaptation? Migration and Climate Change in a Context of High Mobility.” Environment
and Urbanization 21(2): 513–25.
Thiede, Brian C, and Clark L Gray. 2017. “Heterogeneous Climate Effects on Human Migration in Indonesia.” Population
and Environment 39(2): 147–72.
Thiede, Brian, Clark Gray, and Valerie Mueller. 2016. “Climate Variability and Inter-Provincial Migration in South
America, 1970–2011.” Global Environmental Change 41: 228–40.
Thielemann, Eiko. 2004. “Why Asylum Policy Harmonisation Undermines Refugee Burden-Sharing.” European Journal
of Migration and Law 6(1): 47–65.
Thielemann, Eiko R. 2004. “Why Asylum Policy Harmonisation Undermines Refugee Burden-Sharing.” European Journal
of Migration and Law 6: 47–65.
Thielemann, Eiko R., and Nadine El-Enany. 2010. “Refugee Protection as a Collective Action Problem: Is the EU Shirking
Its Responsibilities?” European Security 19(2): 209–29.
UNCCD. 2017. Global Land Outlook.
UNDP. 2009. Human Development Report. Overcoming Barriers: Human Mobility and Development. New York: United
Nations Development Programme (UNDP).
UNISDR. 2015. Proposed Updated Terminology on Disaster Risk Reduction: A Technical Review. Geneva, Switzerland.
United Nations. 2017. Changing Population Age Structures and Sustainable Development. United Nations, Department
of Economic and Social Affairs Population Division.
http://www.un.org/en/development/desa/population/publications/pdf/trends/ConciseReport2017/English.p
df.
Upton, Caroline. 2012. “Managing Mongolia’s Commons: Land Reforms, Social Contexts, and Institutional Change.”
Society & Natural Resources 25(2): 156–75.
Van Hear, Nicholas, Oliver Bakewell, and Katy Long. 2018. “Push-Pull plus: Reconsidering the Drivers of Migration.”
Journal of Ethnic and Migration Studies 44(6): 927–44.
Viswanathan, Brinda, and K.S. Kavi Kumar. 2015. “Weather, Agriculture and Rural Migration: Evidence from State and
District Level Migration in India.” Environment and Development Economics 20(04): 469–92.
Wallerstein, Immanuel Maurice. 1974. The Modern World System. Capitalist Agriculture and the Origins of the European
World-Economy in the Sixteenth Century. New York ; London: Academic Press.
Weiner, Myron. 1995. The Global Migration Crisis: Challenge to States and to Human Rights / Myron Weiner. New York,
NY: HarperCollins College.
Wilcox, Walter F., ed. 1929. International Migrations. Volume I. Statistics. Volume II. Interpretations. New York:
International Labour Office and National Bureau of Economic Research.
Wrathall, David J., Jamon van der Hoek, Alex Walters, and Alan Devenish. 2018. Water Stress and Human Migration: A
Global, Georeferenced Review of Empirical Research. Rome, Italy.
Xiang, Biao, and Johan Lindquist. 2014. “Migration Infrastructure.” International Migration Review 48: S122–48.
Zelinsky, Wilbur. 1971. “The Hypothesis of the Mobility Transition.” Geographical Review 61(2): 219.
Zhao, Liqiu, Shouying Liu, and Wei Zhang. 2018. “New Trends in Internal Migration in China: Profiles of the New-
Generation Migrants.” China & World Economy 26(1): 18–41.
Zipf, George Kingsley. 1946. “The P1 P2/D Hypothesis: On the Intercity Movement of Persons.” American Sociological
Review 11(6): 677–86.

BIBLIOGRAPHY| 96

ANNEX TO CHAPTER 3 - METHODOLOGY| 97
Annex to Chapter 3 - Methodology
The Methodological Annex shows the models used in Chapter 3.
Model for country-level data
The analyses presented in Chapter 3 are based on the so-called augmented gravity models for dyadic-data,
i.e. data disaggregated both by the origin and the destination country of migrants. Gravity models,
extensively used in migration economics literature, serve to identify the drivers of flows of migration
between country-pairs. In the most recent developments of the literature, the gravity equation is derived
from a Random Utility Maximization model, where the individual chooses her location based on a comparison
of the utility in the country of origin and in the destination, net of the migration costs (for a recent review
and details, see Beine, Bertoli, and Fernández-Huertas Moraga 2016; Ramos 2017). Specifically, we estimate
the following gravity equation:
where indicates the origin country, the destination, and the time. The
dependent variable is defined as the ratio of the migration flow from a given origin to a given destination at
time t, to the population in the country of origin in the same period.
is a vector of time-varying
characteristics relative to the country of origin (such as GDP per capita in the origin country). Similarly,
is
the vector of time-varying characteristics of the destination country.
is the vector of bilateral (or dyadic)
characteristics which do not change over time. This usually includes geographic factors (such as the distance
between the origin and the destination countries), and cultural ones (such as the presence of common
language or other cultural similarities between the two countries).
indicates the set of dyadic and time
varying variables, such as the stock of previous migrants from a given origin residing in a given destination
country.
The continuous variables included in model (1) are standardized
68
in order to remove their units of
measurement. Hence, the use of standardized regression coefficients allows us to compare and to rank the
drivers based on their relative importance in influencing migration. The model also includes origin and
destination specific country dummies (
and
) to control for unobserved time-invariant factors in the
origin and in the destination. Similarly, the time dummies control for time shocks common to all the countries
(
). We estimate the model using Least Squares Dummy Variables. The list of models is provided below.
68
The standardization of the variables (in logarithm) is done in the entire sample (i.e. before splitting it into country groups according to their income
level), so all the groups have the same standardization baseline. This allow us to compare the standardized variables across groups of countries.

ANNEX TO CHAPTER 3 - METHODOLOGY| 98
Model 1. General international migration
The analysis of the drivers of general migration is based on the following gravity model:
The dependent variable is defined as the ratio of migration flow from origin o, to
destination d, at time t to the population in the country of origin at time t. The variables’ data sources
and their definitions are provided in the Data Annex.
Time coverage: 1980-2015, 5-years frequency
69
.
Geographic coverage: Origin countries. 144 countries
70
, grouped according to their income level.
Three models are estimated, one for each income group (low, middle, high income). The income level
classification adopted in this study is based on GDP per capita (PPP, constant 2011 international $)
71
. Low
income countries are those whose GDP per-capita in 2015 is lower than approximately 3000 international
dollars
72
. Middle income countries are those ranging between 3000 and 15000 international dollars
approximately
73
. High income countries have GDP per capita in 2015 higher than 15000 international
dollars
74
.
As mentioned in Chapter 3, It should be remarked that this classification is necessary to capture how the
relevance of the drivers of migration change with the economic development of a country. This allows us to
test migration transition theories
75
.
Destination countries: 165 countries.
69
The source of migration flows data is Abel (2017). In the dependent variable, the estimates from Abel are firstly divided by 5 (since they are aggregate
of 5-years), then divided by the 5-year average population in the country of origin. Similarly, the independent variables are defined as averages over
5-years.
70
It should be observed that data on migration flows are available for a higher number of origin countries. However, when estimating the model,
some of the countries are lost due to the missing values in other explanatory variables included in the model.
71
Data source: WDI, World Bank.
72
Low income countries: Afghanistan, Angola, Burundi, Benin, Burkina Faso, Bangladesh, Central African Republic, Chad, Ivory Coast, Djibouti, Eritrea,
Ethiopia, Guinea, Gambia, Guinea-Bissau, Kenya, Liberia, Lesotho, Madagascar, Mali, Malawi, Mozambique, Niger, Nepal, Rwanda, Senegal, Sierra
Leone, Togo, Tajikistan, United Republic of Tanzania, Uganda, Zimbabwe. This list includes the countries for which there are no missing observations
(i.e. all the variables -dependent and independent- are available), hence they can be used in the model. The figures in Chapter 2 and Chapter 6 also
include those countries for which there are missing observations for the independent variables, i.e.: the Democratic Republic of the Congo, Equatorial
Guinea, Haiti, Democratic People’s Republic of Korea, Somalia, South Sudan, Timor-Leste.
73
Middle income countries: Albania, Algeria, Armenia, Belarus, Belize, Bolivia, Bhutan, Cambodia, China, Cameroon, Republic of the Congo, Colombia,
Cape Verde, Costa Rica, Dominican Republic, Ecuador, Egypt, Georgia, Ghana, Guatemala, Guyana, Honduras, Indonesia, India, Jamaica, Jordan,
Kyrgyzstan, Cambodia, Lao People's Democratic Republic, Lebanon, Sri Lanka, Morocco, Macedonia, Mongolia, Mauritania, Namibia, Nicaragua,
Pakistan, Paraguay, Philippines, Peru, Republic of Moldova, Sudan, El Salvador, Swaziland, Thailand, Turkmenistan, Tunisia, Ukraine, Vietnam, Yemen,
South Africa, Zambia. This list includes the countries for which there are no missing observations (i.e. all the variables –dependent and independent-
are available), hence they can be used in the mode. The figures in Chapter 2 and Chapter 6 also include those countries for which there are missing
observations for the independent variables, i.e.: Bosnia and Herzegovina, Cuba, Iraq, Myanmar, Montenegro, Nigeria, Papua New Guinea, State of
Palestine, Serbia, Syria, Uzbekistan.
74
High income countries: United Arab Emirates, Argentina, Australia, Austria, Azerbaijan, Belgium, Bahrain, Brazil, Brunei Darussalam, Botswana,
Bulgaria, Canada, Croatia, Chile, Czech Republic, Germany, Denmark, Estonia, Finland, France, Gabon, Greece, Hong Kong, Hungary, Ireland, Islamic
Republic of Iran, Iceland, Israel, Italy, Latvia, Lithuania, Japan, Kazakhstan, Kuwait, Luxembourg, Mexico, Malta, Malaysia, Netherlands, Norway, New
Zealand, Oman, Panama, Polonia, Portugal, Qatar, Russia, Saudi Arabia, Singapore, Slovak Republic, Slovenia, Spain, Sweden, Switzerland, Turkey,
United Kingdom, United States, Uruguay, Venezuela. This list includes the countries for which there are no missing observations (i.e. all the variables
-dependent and independent- are available), hence they can be used in the model. The figures in Chapter 2 and Chapter 6 also include those countries
for which there are missing observations for the independent variables, i.e.: Republic of Korea, Macao, Puerto Rico, Romania, Suriname.
75
It should be observed that in Chapter 2, 3 and 6 the classification of income level is kept fixed over time. In other words, we do not take into account
whether the country has moved either above or below the listed GDP thresholds. This is done to ensure the comparability of the three groups.
Indeed, each group contains always the same countries over all the period considered. When compared to the 2015 World Bank classification of
countries by income level, we are shrinking the groups of middle income countries and expanding the groups of high and low income countries.

ANNEX TO CHAPTER 3 - METHODOLOGY| 99
Table 1 shows the regression results.
Table 2 General Migration. Regression results, by income level.
Dependent Variable: migration flow (as a share of population at origin, in log)
(1)
(2)
(3)
Low income
Middle income
High income
GDP per capita (origin)
-0.0192
0.470***
-0.383***
(0.189)
(0.132)
(0.112)
Expenditure in Education (origin)
0.0844***
0.0500***
-0.00580
(0.0188)
(0.0160)
(0.0200)
Fertility (origin)
-0.403***
-0.194***
0.00159
(0.105)
(0.0744)
(0.0403)
Geographical distance (origin-destination)
-0.235***
-0.154***
-0.149***
(0.0367)
(0.0170)
(0.0113)
Networks (origin-destination)
0.565***
0.611***
0.433***
(0.0272)
(0.0214)
(0.0173)
Trade (origin-destination)
0.119***
0.0105
0.0660***
(0.0242)
(0.0154)
(0.0181)
GDP per capita growth (destination)
0.0637***
0.0386**
0.0360***
(0.0222)
(0.0180)
(0.0112)
Common language (origin-destination)
0.0773*
0.116***
0.0732***
(0.0394)
(0.0287)
(0.0281)
Colonial link (origin-destination)
0.0526
0.0994
0.111***
(0.0701)
(0.0617)
(0.0429)
Observations
2,389
4,790
8,461
R-squared
0.763
0.743
0.617
Notes. Regression results from panel data models for general migration estimated with Least Squares Dummy Variables. Standardized regression
coefficients. *, **, *** denote significance at 10%, 5%, 1%, respectively. Robust standard errors clustered at the origin-destination level. All models
include origin country dummies, destination country dummies, year dummies, and a constant term.

ANNEX TO CHAPTER 3 - METHODOLOGY| 100
Model 2. Legal channels of migration to the EU
The analysis of the drivers of the legal channels of entry in the EU is based on the following gravity model:
The dependent variable is defined as the ratio between first residence permits of citizens from origin o,
issued by d, at time t. Three versions of the model are estimated, for each of the channels to enter the
EU: family, work, education. The variables’ data sources and their definitions are provided in the Data
Annex.
Time coverage: 2009-2016, annual.
Geographic coverage: Origin countries: 143 countries. Destination countries: EU28.
Table 3 Regression results. Channels of migration to the EU: family, work, education.
Dependent Variable: Residence permits (as a share of population of origin country, in log)
(1)
(2)
(3)
Family
Work
Education
GDP per capita (origin)
0.197**
-0.181
0.104
(0.0891)
(0.169)
(0.129)
Geographical distance (origin-destination)
-0.0222
-0.172***
-0.185***
(0.0283)
(0.0409)
(0.0408)
Networks (origin-destination)
0.693***
0.623***
0.404***
(0.0159)
(0.0239)
(0.0242)
Trade (origin-destination)
-0.00113
0.00576
0.0422
(0.0128)
(0.0260)
(0.0259)
Unemployment rate (destination)
-0.000402
-0.261***
-0.170***
(0.0116)
(0.0278)
(0.0212)
Common language (origin-destination)
0.126***
0.134**
0.197***
(0.0317)
(0.0568)
(0.0564)
Colonial link (origin-destination)
0.123**
0.164*
0.271***
(0.0629)
(0.0979)
(0.0975)
Observations
9,062
6,803
6,300
R-squared
0.878
0.802
0.739
Notes. Regression results from panel data models for legal channels of migration estimated with Least Squares Dummy Variables. Standardized
regression coefficients. *, **, *** denote significance at 10%, 5%, 1%, respectively. Robust standard errors clustered at the origin-destination level.
All models include origin country dummies, destination country dummies, year dummies, and a constant term.

ANNEX TO CHAPTER 3 - METHODOLOGY| 101
Model 3. Asylum applications
The dependent variable is defined as the ratio of new asylum applications of individuals from origin o,
lodged to destination d, at time t and the population at origin. The variables’ data sources and their
definitions are provided in the Data Annex.
Time coverage: 1999-2016, annual.
Geographic coverage: Origin countries: 122 countries. Destination countries: EU28 countries and
Australia, Albania, Bosnia and Herzegovina, Canada, Iceland, Japan, Liechtenstein, Macedonia,
Montenegro, Norway, New Zealand, Norway, Republic of Korea, Switzerland, Turkey, United States.
Table 4 Regression results, asylum applications.
Dependent Variable: new asylum applications (as a share of population at origin, in log)
(1)
Asylum
GDP per capita (origin)
-0.551***
(0.0589)
Democracy (origin)
-0.0752***
(0.0182)
Political Terror (origin)
0.0701***
(0.00717)
Area affected by high intensity conflict (origin)
0.0310***
(0.00458)
Population growth (origin)
-0.0301***
(0.0114)
High intensity conflict (origin)
0.0688***
(0.0207)
Networks (origin-destination)
0.458***
(0.0219)
Geographical distance (origin-destination)
-0.287***
(0.0320)
Colonial link (origin-destination)
0.0290
(0.0546)
Common language (origin-destination)
0.0743**
(0.0332)
Employment rate (destination)
0.105***
(0.0234)
Observations
29,133
R-squared
0.706
Notes. Regression results from panel data model for asylum seekers estimated with Least Squares Dummy Variables. Standardized regression
coefficients. *, **, *** denote significance at 10%, 5%, 1%, respectively. Robust standard errors clustered at the origin-destination level. All models
include origin country dummies, destination country dummies, year dummies, and a constant term.
General remarks and robustness checks
In general, the choice of the drivers used in this report and the variables to measure them is motivated by
three sets of considerations. First, we include the drivers most commonly used in the literature and having
sound economic relevance. Second, given the scope of our analysis, we use those variables having the widest

ANNEX TO CHAPTER 3 - METHODOLOGY| 102
coverage both in terms of countries and time. Third the choice of the variables attempts to mitigate
collinearity issues
76
.
To ‘rank’ the continuous variables measuring the drivers and to establish their relative importance, we use
standardized regression coefficients. In addition, we look at the adjusted R-squared of the estimated models
excluding one drivers at a time. This procedure confirms that the ‘most relevant’ drivers are those
contributing more to the adjusted R-square of the final model. Finally, we have tested that the coefficients
of the same explanatory variable are statistically different across groups. This is done to compare the groups
of low, middle, high income countries. Similarly, we have compared the groups of residence permits issued
for family, work, and education reasons
77
.
It should be finally stressed that in our analyses we do not address endogeneity issues deriving, for instance,
from reverse causality. Hence, the results should be interpreted as correlation rather than as causal effects.
Several alternative specifications of the models are estimated to check the robustness of the findings. The
robustness checks are listed below:
Model 1 is estimated by replacing, when available, data from (Abel 2017) with OECD migration flows. The
results presented do not change when we use this alternative database. The only difference is that GDP per
capita growth in the destination country is not significant anymore.
In Model 2, we estimate alternative specifications which include the Migrant Integration Policy Index (MIPEX)
as a measure of the restrictiveness of integration policies
78
. In the model for the work channel, we include
the MIPEX Occupation indicator which measures whether legally-resident foreign citizens have comparable
workers' rights and opportunities like nationals to access jobs and improve their skills. It is based on several
dimensions, such as the access to the labour market. We find only a positive correlation between the general
MIPEX Occupation and residence permits for work-related reasons. Only the MIPEX for work is significant.
For further details, see (Migali and Natale 2017).
Model 3: further details on Model 3 and additional model specifications (e.g. using different forms of
organized violence as drivers of new asylum applications) will be provided by additional JRC analyses (Conte
and Migali n.d.). Even when using alternative model specifications, the main insights provided in Chapter 3
do not change.
76
To do so, we include in the model those explanatory variables having the lowest correlation and variance inflation factor.
77
Specifically, we have performed Hausman-type tests to test whether they are statistically different. In general, except for the controls such as
common language, colony, the tests do not accept the hypothesis that the coefficients are statistically equal. It should be noted that the coefficients
of different models should not be compared (for instance, those for general migration are not comparable to those of the other two models on
residence permits and asylum).
78
Other policy indexes, that will be briefly described in Chapter 4, such as IMPIC or DEMIG cannot be used in our analysis. Indeed, they either have a
limited time coverage (such as IMPIC), or they are almost stable over the time period considered (for instance, for the case of DEMIG, when focusing
on major policy changes in specific areas, about 20 major changes are recorded for the area of work for the period 2009-2014 (and even less for the
area of family).

ANNEX TO CHAPTER 3 - METHODOLOGY| 103
Model for individual-level data
The analyses of individual-level data are based on logistic regression models. In the first model, the binary
dependent variable is equal to 1 when the individual expresses the desire to migrate and 0 otherwise.
Similarly, in the second model, the dependent is equal to 1 for those expressing the preparation for migration
and 0 otherwise. As controls, we include a set of individual demographic (such as age, gender, marital status,
being foreign-born) and socio-economic characteristics (education level, labour market status, having
networks abroad, income). Both outcomes are linked to the covariates using the logit function and the
regression coefficients are estimated through maximum likelihood. More details on the model for individual
migration intentions, as well as alternative specifications of the model can be found in (Migali and Scipioni
2018).
Table 4 and Table 5 below show the odds ratios from the logit models. The odds ratio is the odds of the
outcome success (e.g. wishing to migrate) given the fact that individuals belong to a particular group (e.g.
the group of males), compared to the odds of the outcome when the individuals belong to the baseline group
(i.e. females). For example, an odds ratio of 1.35 for migration desire of males means that men have 35%
higher odds of desiring to migrate versus the odds of migration desire for females.

ANNEX TO CHAPTER 3 - METHODOLOGY| 104
Table 5 Migration Desire, by income level.
(1)
(2)
(3)
Low income
Middle income
High income
Age 20-24
0.895***
0.956**
0.851***
(0.0248)
(0.0182)
(0.0231)
Age 25-29
0.848***
0.890***
0.764***
(0.0256)
(0.0185)
(0.0222)
Age 30-34
0.738***
0.810***
0.693***
(0.0252)
(0.0182)
(0.0210)
Age 35-39
0.658***
0.730***
0.609***
(0.0244)
(0.0174)
(0.0191)
Age 40-44
0.519***
0.651***
0.571***
(0.0216)
(0.0164)
(0.0181)
Age 45-49
0.463***
0.556***
0.498***
(0.0211)
(0.0148)
(0.0163)
Age 50-54
0.383***
0.457***
0.426***
(0.0198)
(0.0127)
(0.0145)
Age 55-59
0.332***
0.386***
0.351***
(0.0209)
(0.0122)
(0.0127)
Age 60-64
0.276***
0.295***
0.264***
(0.0197)
(0.0103)
(0.0101)
Age 65+
0.188***
0.178***
0.146***
(0.0126)
(0.00601)
(0.00527)
Having children
1.131***
1.055***
0.950***
(0.0267)
(0.0130)
(0.0147)
Gender (male)
1.359***
1.273***
1.197***
(0.0239)
(0.0138)
(0.0154)
Foreign-born
1.456***
1.653***
1.742***
(0.0713)
(0.0521)
(0.0378)
Network
1.581***
1.726***
1.806***
(0.0284)
(0.0192)
(0.0245)
Married
0.655***
0.696***
0.725***
(0.0157)
(0.0104)
(0.0138)
Other marital status
0.782***
0.825***
0.903***
(0.0260)
(0.0156)
(0.0192)
Secondary Education
1.435***
1.233***
1.164***
(0.0280)
(0.0156)
(0.0224)
Tertiary Education
1.334***
1.319***
1.297***
(0.0627)
(0.0249)
(0.0302)
Unemployed
1.347***
1.452***
1.435***
(0.0399)
(0.0268)
(0.0351)
Out of workforce
0.891***
0.903***
0.922***
(0.0178)
(0.0113)
(0.0148)
2
nd
income quintile
0.962
0.971*
0.905***
(0.0272)
(0.0167)
(0.0186)
3
rd
income quintile
0.952*
0.957***
0.877***
(0.0265)
(0.0162)
(0.0182)
4
th
income quintile
0.957
0.950***
0.871***
(0.0262)
(0.0161)
(0.0180)
5
th
income quintile
0.958
0.947***
0.852***
(0.0263)
(0.0164)
(0.0178)
Observations
129,638
383,440
299,534
Pseudo R2
0.1011
0.1555
0.1092
Notes. Odds ratios from logistic regressions are reported. *, **, *** denote significance at 10%, 5%, 1%, respectively. Robust standard errors. All
models include country dummies, year dummies, and a constant term. Repeated cross-sections for the years 2010-2015. Reference categories for the
covariates are: Age 15-19, Not having children, Female, Native-born, Not having networks, Single, Primary Education, Employed, 1
st
income quintile.

ANNEX TO CHAPTER 3 - METHODOLOGY| 105
Table 6 Migration Preparation, by income level.
(1)
(2)
(3)
Low income
Middle income
High income
Age 20-24
1.108
1.414***
1.250*
(0.112)
(0.105)
(0.155)
Age 25-29
1.256**
1.685***
0.981
(0.133)
(0.132)
(0.131)
Age 30-34
1.004
1.523***
0.981
(0.125)
(0.131)
(0.139)
Age 35-39
0.836
1.319***
0.803
(0.119)
(0.123)
(0.116)
Age 40-44
0.874
0.908
0.668***
(0.134)
(0.0926)
(0.0995)
Age 45-49
0.682**
0.640***
0.452***
(0.118)
(0.0715)
(0.0758)
Age 50-54
0.428***
0.643***
0.437***
(0.0927)
(0.0751)
(0.0734)
Age 55-59
0.505***
0.403***
0.286***
(0.129)
(0.0561)
(0.0540)
Age 60-64
0.481***
0.395***
0.228***
(0.134)
(0.0645)
(0.0500)
Age 65+
0.259***
0.234***
0.184***
(0.0794)
(0.0322)
(0.0371)
Having children
1.014
0.940
0.832***
(0.0864)
(0.0427)
(0.0588)
Gender (male)
1.306***
1.528***
1.314***
(0.0882)
(0.0625)
(0.0807)
Foreign-born
2.290***
2.471***
2.341***
(0.293)
(0.221)
(0.199)
Network
6.087***
6.726***
4.962***
(0.484)
(0.341)
(0.354)
Married
0.662***
0.659***
0.572***
(0.0566)
(0.0360)
(0.0498)
Other marital status
1.069
0.839**
0.845*
(0.134)
(0.0597)
(0.0796)
Secondary Education
1.772***
1.371***
1.159
(0.132)
(0.0707)
(0.116)
Tertiary Education
2.110***
1.667***
1.742***
(0.268)
(0.110)
(0.199)
Unemployed
1.433***
1.500***
1.555***
(0.135)
(0.0936)
(0.153)
Out of workforce
0.778***
0.832***
0.771***
(0.0591)
(0.0420)
(0.0634)
2
nd
income quintile
1.014
1.019
0.712***
(0.119)
(0.0775)
(0.0711)
3
rd
income quintile
0.922
1.077
0.661***
(0.105)
(0.0776)
(0.0661)
4
th
income quintile
1.003
1.210***
0.765***
(0.110)
(0.0863)
(0.0740)
5
th
income quintile
1.156
1.423***
0.959
(0.122)
(0.0987)
(0.0892)
Observations
102,880
308,964
254,230
Pseudo R2
0.1678
0.2095
0.1680
Notes. Odds ratios from logistic regressions are reported. *, **, *** denote significance at 10%, 5%, 1%, respectively. Robust standard errors. All models
include country dummies, year dummies, and a constant term. Repeated cross-sections for the years 2010-2015. Reference categories for the covariates
are: Age 15-19, Not having children, Female, Native-born, Not having networks, Single, Primary Education, Employed, 1
st
income quintile.

ANNEX TO CHAPTER 3 - DATA| 106
Annex to Chapter 3 - Data
Table 7 Total international Migration
Table 8 Legal channels of migration to the EU
Dependent variable
Name
Data source
Definition
Migration
Flows
Abel (2017)
Estimates of migration flows based on World Bank and UNDESA 5-
years stocks of migrants.
Population
World Bank
Total population includes all residents, regardless of their citizenship.
The variable refers to mid-year estimates.
Independent variables
GDP per
capita
World Bank
GDP per capita (constant 2010 US$).
Expenditure in
education
World Bank
Government expenditure on education, total (% of government
expenditure).
Fertility
World Bank
Total fertility rate is the number of children that would be born to a
woman if she were to live to the end of her childbearing years and
bear children in accordance with age-specific fertility rates of the
specified year.
Geographical
Distance
CEPII
Distance between capital cities of the origin and the destination
countries. In kilometres.
Common
Language
CEPII
Common official language between the origin and the destination
country (binary variable).
Colonial link
CEPII
Colonial tie between the origin and the destination countries (binary
variable)
Trade
UN Comtrade, World
Bank,
Trade openness (sum of bilateral import and exports, over GDP of the
origin country)
Networks
World Bank
International migrant stocks (including refugees), by origin (country of
birth) and destination.
GDP per
capita growth
World Bank
GDP per capita growth (annual%).
Dependent variable
Name
Data source
Definition
Residence permit
Eurostat
First residence permits, by reasons length of validity and citizenship.
We use residence permits for family reasons, education reasons,
remunerated activities reasons (which in this report is labelled as
‘Work’). We use first residence permits with duration of 12 months or
over.
Population
World Bank
Total population includes all residents, regardless of their citizenship.
The variable refers to mid-year estimates.
Independent variables
Trade
UN Comtrade, World
Bank,
Trade openness (sum of bilateral import and exports, over GDP of
the origin country)
GDP per capita
World Bank
GDP per capita (constant 2010 US$).
Geographical
Distance
CEPII
Distance between capital cities of the origin and the destination
countries. In kilometres.
Colonial link
CEPII
Colonial tie between the origin and the destination countries (binary
variable)
Common
Language
CEPII
Common official language between the origin and the destination
country (binary variable).
Networks
Eurostat
Immigrants, by country of birth
Unemployment
rate
World Bank
Unemployment (% of total labour force)

ANNEX TO CHAPTER 3 - DATA| 107
Table 9 Asylum seekers
Table 10 Intentions to migrate
79
Dependent variable(s)
Migration intentions
Migration wish
Ideally, if you had the opportunity, would you like to move permanently to another country,
or would you prefer to continue living in this country?
Migration
preparation
Have you done any preparation for this move? (asked only of those who are planning to move
to another country in the next 12 months).
Independent variables
Gender
Gender.
Age
Current age. The Gallup World Poll surveys individuals aged 15 and older. 5-years age
classes are used.
Marital status
Current marital status. A categorical variable which takes the following values is defined:
Single, Married, Other (the category Other includes separated, divorced, widowed, domestic
partner).
Foreign-born
Were you born in this country?
Children
How many children under 15 years of age are now living in your household? (WP1230)
Network Abroad
Do you have relatives or friends who are living in another country whom you can count on to
help you when you need them, or not?
Education level
What is your highest completed level of education? (WP 3117) Elementary: Completed
elementary education or less (up to eight years of basic education); Secondary: Completed
some secondary education up to three years tertiary education (nine to 15 years of
education); Tertiary: Completed four years of education beyond ‘high school’ and/or received
a four-year college degree.
79
Dependent variable
Name
Data source
Definition
First asylum
applications
UNHCR
New asylum applications lodged in 38 European and 6 non-European
countries, by origin. Data are monthly.
Population
World Bank
Total population includes all residents, regardless of their citizenship.
The variable refers to mid-year estimates.
Independent variables
GDP per
capita
World Bank
GDP per capita (constant 2010 US$).
High intensity
conflict
Uppsala Conflict Data
Program
Binary variable that is equal to 1 if a country has experienced a conflict
with more than 1000 battle deaths in a specific year and 0 otherwise.
Area affected
by high
intensity
conflict
Our calculation on the
basis of Uppsala Conflict
Data Program
The variable measures the sum of all conflict zones (high intensity
conflict) expressed as percentages of the area of the country. We use
the variable lagged by 1 year.
Political Terror
Gibney et al. (2017)
This index measures the intensity of terror and human rights abuse
committed by the state toward the population.
Democracy
Polity IV project
The index measures the level of institutionalized democracy in the
origin country and the extent of civil liberties granted to citizens in
their daily lives.
Population
growth
World Bank
Annual populaiton growth.
Geographical
Distance
CEPII
Distance between capital cities of the origin and the destination
countries. In kilometres.
Colonial link
CEPII
Colonial tie between the origin and the destination countries (binary
variable)
Common
Language
CEPII
Common official language between the origin and the destination
countries (binary variable).
Migrant stocks
World Bank
International migrant stocks (including refugees), by origin (country of
birth) and destination.
Employment
rate
World Bank
Employment (% total labour force)

ANNEX TO CHAPTER 3 - DATA| 108
Labour market
status
The labour market status is based on Gallup variable EMP_2010. A categorical variable taking
the following values is defined: Employed, Unemployed, Out of Workforce. The category
Employed includes employed full time for an employer, employed full time for self, employed
part time-do not want to work full time, employed part time-want to work full time.
Individual annual
income
Variables used: Per Capita Income Quintiles (INCOME_5)

ANNEX TO CHAPTER 5 - LITERATURE ON THE IMPACTS OF CLIMATE CHANGE ON MIGRATION| 109
Annex to Chapter 5 - Literature on the impacts of climate change on
migration
The following table reports and updates with the most recent literature the findings of the ‘Empirical
evidence on observed or projected mobility outcomes (migration, immobility, or displacement) associated
with weather-related extremes or impacts of longer-term climate change’ (Adger et al. 2014)
Table 11 Literature on the relation between mobility and climate change
Type of
impact or
extreme
Change in
migration
trend or flow
Region
Impact on migration, by type of short-term event and long-
term change (quoted from the source, or from Adger et al.,
2014)
Source
Low
precipitation,
drought, and
land
degradation
Evidence for
increased
mobility or
increased
displacement
Burkina
Faso
‘inter-provincial migrations are influenced by unfavorable
conditions concerning rainfall variability, land degradation and
land availability at the origin, and favorable conditions at the
destination for these variables’
(Henry, Boyle, and Lambin
2003)
Burkina
Faso
‘Findings suggest that people from the drier regions are more
likely than those from wetter areas to engage in both temporary
and permanent migrations to other rural areas. Also, short-term
rainfall deficits tend to increase the risk of long-term migration
to rural areas and decrease the risk of short-term moves to
distant destinations’
(Henry, Schoumaker, and
Beauchemin 2004)
sub-
Saharan
African
‘Specifically, we find that while shortages in rainfall have acted
to increase rates of urbanization on the sub-Saharan African
continent, there is no evidence of such for the rest of the
developing world’
(Barrios, Bertinelli, and
Strobl 2006)
Mexico
‘we find a significant effect of climate-driven changes in crop
yields on the rate of emigration to the United States’
(S. Feng, Krueger, and
Oppenheimer 2010)
Multi-
Country
‘The empirical results suggest that environmental decline plays a
statistically significant role in out-migration, pushing people to
leave their homes and move to other countries’
(Reuveny and Moore 2009)
United
States
‘Statistically significant relationship between changes in net
outmigration (within the country) and climate-driven changes in
crop yields. This effect is primarily driven by young adults’
(Shuaizhang Feng,
Oppenheimer, and
Schlenker 2012)
Bangladesh
‘The results indicate that flooding has modest effects on mobility
that are most visible at moderate intensities and for women and
the poor. However, crop failures unrelated to flooding have
strong effects on mobility in which households that are not
directly affected but live in severely affected areas are the most
likely to move’
(C. L. Gray and Mueller
2012)
Multi-
Country
‘Results suggest that aggregated disasters in the origin increase
outmigration, on average, while disasters in the destination
decrease international migration. Results hold when conditioned
on geographic country size.’
(Gröschl 2012)s
sub-
Saharan
African
‘Based on annual, cross-country panel data for sub-Saharan
Africa, we present an empirical model that suggests that
weather anomalies increased internal and international
migration’
(Marchiori, Maystadt, and
Schumacher 2012)
Yemen
‘The results suggest that climate variables do affect internal
migration, but in a limited way, with socio-economic and cost
factors playing a much more prominent role.’
(Joseph and Wodon 2013)

ANNEX TO CHAPTER 5 - LITERATURE ON THE IMPACTS OF CLIMATE CHANGE ON MIGRATION| 110
Mexico
‘A decrease in precipitation is significantly associated with U.S.-
bound migration, but only for dry Mexican states’
(Nawrotzki, Riosmena, and
Hunter 2013)
Indonesia
‘By following province-to-province movement of more than
7,000 households in Indonesia over a decade and a half, this
study reveals that an increase in temperature (e.g., due to
natural variations or global warming) and, to a lesser extent,
variations in rainfall are likely to have a greater effect on
permanent outmigration of households than natural disasters.’
(Bohra-Mishra,
Oppenheimer, and Hsiang
2014)
Rural
Pakistan
‘Heat stress consistently increases the long-term migration of
men, driven by a negative effect on farm and non-farm income’
(Mueller, Gray, and Kosec
2014)
Multi-
Country
‘We find two primary results. First, temperature is positively
correlated with migration. Second, stronger changes in
precipitation are also associated with aligned, but small changes
in migration.’
(Backhaus, Martinez-
Zarzoso, and Muris 2015)
Multi-
Country
‘Our results show that the occurrence of adverse climatic events
in origin countries has significant direct and indirect effects on
out-migration from poor to rich countries’
(Coniglio and Pesce 2015)
Multi-
Country
‘The results show that natural disasters are positively associated
with emigration rates’
(Drabo and Mbaye 2015)
Bangladesh
‘The results suggest a predicted increase in rainfall uncertainty
would increase net out-migration rates by 20% in 2030 relative
to 1990’
(Iqbal and Roy 2015)
India
‘a decline in the value of agricultural output related to weather
variations results in an increase in out-migration rate’
(Viswanathan and Kavi
Kumar 2015)
Multi-
Country
‘Temperature induces international outmigration only from
agricultural countries’
(Cai et al. 2016)
India
Drought frequency has the strongest effect on rural–rural inter-
state migration
(Dallmann and Millock
2017)
South Africa
‘Investigating internal migration we find that increases in
positive temperature, and positive/negative rainfall excesses act
as a push effect and boost out-migration. Black and low-income
migrants are more affected by climate than white and high-
income migrants’
(Mastrorillo et al. 2016)
Multi-
Country
‘Findings suggest that anomalies in temperature and
precipitation boost urbanization, and this in turn spurs
international bilateral migration flows. We provide evidence that
climate-induced migration is particularly relevant for developing
countries, where the level of rural employment is high and likely
to be affected by climatic shocks. As a consequence, the
likelihood of both urbanization and international migration due
to climate instability is greater in developing countries than in
richer regions.’
(Maurel and Tuccio 2016)
South
America
‘We find that exposure to monthly temperature shocks has the
most consistent effects on migration relative to monthly rainfall
shocks and gradual changes in climate over multi-year periods.
Analyses that disaggregate migration by the rural/urban status
of destination suggest that much of the climate-related
migration is directed toward urban area’
(B. Thiede, Gray, and
Mueller 2016)
sub-
Saharan
African
‘This paper documents strong but differentiated links between
climate and urbanization in large panels of districts and cities in
Sub-Saharan Africa, which has dried substantially in the past fifty
years’
(Henderson, Storeygard,
and Deichmann 2017)

ANNEX TO CHAPTER 5 - LITERATURE ON THE IMPACTS OF CLIMATE CHANGE ON MIGRATION| 111
Ethiopia
‘Migration of household heads to mitigate the impact of drought
related famine’
(Meze-Hausken 2000)
Western
Sahara
‘Environmental factors influenced decisions to migrate
internationally from refugee camps’
(Gila, Zaratiegui, and De
Maturana Diéguez 2011)
Kenya
‘The analysis reveals that soil quality significantly reduces
migration in Kenya, particularly for temporary labor migration,
but marginally increases migration in Uganda’
(Clark L. Gray 2011)
India
Temporary migration is identified as ‘the most important’ coping
strategy in times of drought in rural villages
(Jülich 2011)
Canada
Higher population loss was associated with settlements
containing areas of poorer quality agricultural soils during
droughts of 1930s
(R. A. McLeman and Ploeger
2012)
Guatemala
‘Land scarcity and degradation in origin communities are linked
to out-migration in general and to the forest frontier of northern
Guatemala’
(López-Carr 2012)
Sahel
‘The pressure to migrate had significantly increased since the
1970s, with response to persistent droughts identified as a
factor’
(Scheffran et al. 2012;
Scheffran, Marmer, and
Sow 2012)
Burkina
Faso
‘Simulated scenarios of dry climate increase migration fluxes
compared to wet scenarios. Highest international migrant flows
are shown with the dry climate scenarios’
(Kniveton, Smith, and Wood
2011)
Evidence for
decreased
mobility or
trapped
population
Ecuador
‘The results indicate that adverse environmental conditions do
not consistently increase rural out-migration and, in some cases,
reduce migration’
(C. Gray and Bilsborrow
2013)
‘Negative environmental conditions and landlessness do not
consistently increase out-migration as commonly assumed in the
literature’
(Clark L. Gray 2009)
Vietnam,
Cambodia,
Uganda,
Nicaragua,
and Peru
‘The results suggest that individual perceptions of long-term
(gradual) environmental events, such as droughts, lower the
likelihood of internal migration.’
(Koubi, Spilker, Schaffer,
and Bernauer 2016; Koubi,
Spilker, Schaffer, and
Böhmelt 2016)
Uganda
‘The analysis reveals that soil quality significantly reduces
migration in Kenya, particularly for temporary labor migration,
but marginally increases migration in Uganda’
(Clark L. Gray 2011)
Mali
‘Reduced international migration occurred during the 1980s
drought concurrently with an increase in localized cyclical
migration’
(Findley 1994)
Nepal
‘Deforestation, population pressure, and agricultural decline
leads to local mobility, especially among women, but no
increases in internal or international migration’
(Bohra-Mishra and Massey
2011; Massey, Axinn, and
Ghimire 2010)
Evidence for
socially
differentiated
mobility
outcomes
Ethiopia
‘The results indicate that men’s labor migration increases with
drought and that land-poor households are the most vulnerable’
(C. Gray and Mueller 2012)
Ecuador
‘Men access land resources to facilitate international migration
and women are less likely to depart from environmentally
marginal communities relative to other areas’
(Clark L Gray 2010)
Mexico
‘The results suggest that households subjected to very recent
drought conditions are less likely to send a U.S. migrant, but in
communities with drought two years prior and with strong
migration histories, emigration is much more likely. In regions
(Hunter, Murray, and
Riosmena 2013)

ANNEX TO CHAPTER 5 - LITERATURE ON THE IMPACTS OF CLIMATE CHANGE ON MIGRATION| 112
lacking such social networks, rainfall deficits actually reduce
migration propensities, perhaps reflecting constraints in the
ability to engage in migration as a coping strategy.’
Tanzania
‘Our findings confirm that for an average household, a 1%
reduction in agricultural income induced by weather shock
increases the probability of migration by 13 percentage points
on average within the following year. However, this effect is
significant only for households in the middle of wealth
distribution, suggesting that the choice of migration as an
adaptation strategy depends on initial endowment.’
(Kubik and Maurel 2016)
‘The results show how household consumption co-moves with
temperature, rendering households vulnerable to local weather
events. These temperature-induced income shocks are then
found to inhibit long-term migration among men, thus
preventing them from tapping into the opportunities brought
about by geographical mobility’
(Hirvonen 2016)
Netherlands
‘Only internal moves in the later period and for certain social
groups are associated with negative climate conditions, and the
strength and direction of the observed effects change over time.
International moves decrease with extreme rainfall, suggesting
that the complex relationships between climate and migration
that have been observed for contemporary populations extend
into the nineteenth century’
(Jennings and Gray 2015)
Multi-
Country
‘In low income countries a temperature increase decreases
migration and traps people into poverty. In middle income
countries warming strengthens the incentives to migrate to
cities or abroad. Growing temperatures mainly increase
emigration towards close and non-OECD destinations.’
(Cattaneo and Peri 2016)
sub-
Saharan
African
‘Analyses of these data using several plausible specifications
reveal that climate variability has country-specific effects on
migration: Migration tends to increase with temperature
anomalies in Uganda, tends to decrease with temperature
anomalies in Kenya and Burkina Faso, and shows no consistent
relationship with temperature in Nigeria and Senegal. Consistent
with previous studies, precipitation shows weak and inconsistent
relationships with migration across countries. These results
challenge generalizing narratives that foresee a consistent
migratory response to climate change across the globe.’
(C. Gray and Wise 2016)
Senegal and
Burkina
Faso
‘Results show that excessive precipitation increases
international migration from Senegal (climate driver
mechanism) while heatwaves decrease international mobility in
Burkina Faso (climate inhibitor mechanism). Interaction models
and results from a geographically weighted regression reveal a
conditional effect of droughts on international outmigration
from Senegal, which becomes stronger in areas with high levels
of groundnut production’
(Nawrotzki and
Bakhtsiyarava 2017)
Indonesia
‘We evaluate the relative importance of temperature, rainfall,
and monsoon timing for migration. Only temperature and
monsoon timing have significant effects, and these do not
operate in the direction commonly assumed. Estimated effects
vary according to individuals’ gender, membership in a farm
household, and location’
(B. C. Thiede and Gray 2017)
United
States
Dustbowl migrants from Oklahoma to California in the 1930s had
different social and economic capital endowments from those
who stayed within state
(R. McLeman and Smit
2006)
Burkina
Faso
Labor migration became a key off-farm livelihood strategy after
droughts in the 1970s for groups dependent on rain-fed
agriculture
(Nielsen and Reenberg
2010)

ANNEX TO CHAPTER 5 - LITERATURE ON THE IMPACTS OF CLIMATE CHANGE ON MIGRATION| 113
Mongolia
Diversity was seen in herders’ mobility strategies in response to
climate change. For a minority, responses entailed greater
overall annual mobility. Other herding households experienced
significant reductions in mobility.
(Upton 2012)
Flooding
Evidence for
increased
mobility or
increased
displacement
Multi-
Country
‘Results suggest that aggregated disasters in the origin increase
outmigration, on average, while disasters in the destination
decrease international migration. Results hold when conditioned
on geographic country size. As suspected, findings are
dominated by weather-related events, particularly by severe
flooding’
(Gröschl 2012)s
Vietnam,
Cambodia,
Uganda,
Nicaragua,
and Peru
‘The results suggest that sudden-onset events, such as floods,
increase movement.’
(Koubi, Spilker, Schaffer,
and Bernauer 2016; Koubi,
Spilker, Schaffer, and
Böhmelt 2016)
United
States
‘Ten counties and parishes in Louisiana, of the 77 impacted
counties, experienced 82% of the total population increase in the
year following Hurricane Katrina’
(Frey and Singer 2006)
Vietnam
‘Cumulative impacts of seasonal flooding increase outmigration
rates in the Mekong Delta’
(Dun 2011)
Bangladesh
‘22% of households affected by tidal-surge floods, and 16%
affected by riverbank erosion, moved to urban areas’
(Foresight 2011)
Evidence for
decreased
mobility or
trapped
population
Bangladesh
‘No outmigration was detected after 2004 tornado in
Bangladesh as a result of the effective distribution of disaster
aid’
(Paul 2005)
Senegal
‘More than 40% of new migrant populations located in high risk
flood zones in Dakar’
(Foresight 2011)
Rural
Pakistan
‘We find that flooding—a climate shock associated with large
relief efforts—has modest to insignificant impacts on migration’
(Mueller, Gray, and Kosec
2014)
Evidence for
socially
differentiated
mobility
outcomes
Multi-
Country
‘Our baseline results suggest that climatic change affects
individuals’ credit constraints more than their desire to move.
Our key findings are that natural disasters deter emigration from
all origin countries but importantly spur emigration to
neighboring countries while for middle income origins, natural
disasters while deterring migration, foster emigration to former
colonial powers’
(Beine and Parsons 2015,
2016)
United
States
‘Emergency evacuation responses and return migration after
Hurricane Katrina were highly differentiated by income, race,
class, and ethnicity’
(Elliott and Pais 2006; Falk,
Hunt, and Hunt 2006;
Landry et al. 2007)
Bangladesh
‘Wide variation seen among groups in attitudes toward, and
capabilities for, migration as an adaptation to the impact of
cyclone Aila’
(Kartiki 2011)
Sea level rise
Evidence for
increased
mobility or
increased
displacement
United
States
‘Relative sea level rise caused island depopulation in Maryland.
Final abandonment was a result of the population falling below
the threshold required to support local services’
(Arenstam Gibbons and
Nicholls 2006)
Coastal villages in Alaska are affected by sea level rise and coastal
erosion to the point where resettlement is the only viable
adaptation
(R Bronen 2013; Robin
Bronen 2011, 2015; Marino
2012; Oliver-Smith 2011)
‘The impact of future sea level rise is projected to extend beyond
the inundated counties through migration networks that link
inland and coastal areas and their populations’
(Curtis and Schneider 2011;
Hauser 2017)

ANNEX TO CHAPTER 5 - LITERATURE ON THE IMPACTS OF CLIMATE CHANGE ON MIGRATION| 114
Vanuatu
‘Contemporary example of whole village displacement was
associated with inundation, both from sea level rise and tectonic
movement on Torres Islands’
(Ballu et al. 2011)
Papua New
Guinea
‘Communities on Bougainville are considering resettlement to
the main island due to coastal erosion, land loss, saltwater
inundation, and food insecurity’
(Oliver-Smith 2011)
Evidence for
decreased
mobility
Tuvalu
‘On the island of Funafuti, surveyed residents emphasize place
attachment as reasons for not migrating, and do not cite climate
change as a reason to migrate’ ‘Tuvaluans have decided that
their preferred policy is to stay and Voice.’
(Mortreux and Barnett
2009; Noy 2017)

GETTING IN TOUCH WITH THE EU
In person
All over the European Union there are hundreds of Europe Direct information centres. You can find the address of the centre
nearest you at: http://europea.eu/contact
On the phone or by email
Europe Direct is a service that answers your questions about the European Union. You can contact this service:
- by freephone: 00 800 6 7 8 9 10 11 (certain operators may charge for these calls),
- at the following standard number: +32 22999696, or
- by electronic mail via: http://europa.eu/contact
FINDING INFORMATION ABOUT THE EU
Online
Information about the European Union in all the official languages of the EU is available on the Europa website at: http://europa.eu
EU publications
You can download or order free and priced EU publications from EU Bookshop at: http://bookshop.europa.eu. Multiple copies of
free publications may be obtained by contacting Europe Direct or your local information centre (see http://europa.eu/contact).

KJ-NA-29333-EN-N
doi:10.2760/63833
ISBN 978-92-79-92960-1
