
May 18, 2016
ACTION
Buy
Tesla Motors Inc. (TSLA)
Return Potential: 22%
Equity Research
Putting in our reservation for the Model 3; upgrading TSLA to Buy
Source of opportunity
We upgrade shares of Tesla to Buy from Neutral with 22% upside to our 6-month
price target of $250. While we believe the volume targets are ambitious, Street
and investor expectations seem more grounded and following a 23% decline in
the share price post the Model 3 unveil, we do not believe Tesla shares are fully
capturing the company’s disruptive potential. This combined with a more stable
macro backdrop (relative to January/February) and increased confidence in Model
3 demand (from orders and our competitive benchmarking) drives attractive
risk/reward. The company has publicly stated it might look to raise capital, and
our detailed capex analysis points to capital needs of $1bn.
Catalyst
There are admittedly fewer visible catalysts than before, with the next
Model 3 update potentially not until next year. We think the introduction of
a mobility service is a possibility, though timing is uncertain as
management comments on this have been limited. Ultimately we think the
biggest fundamental near-term catalyst will be the ramp of the Model X.
While progress appears to have been limited since the 1Q16 update (based
on the cadence of April/May deliveries), expectations are low in our view
with many on the Sell/Buy sides expecting a cut to Tesla’s 80-90k delivery
target. While we acknowledge this risk we view it as discounted and think
any positive news on X production would strongly support the shares.
Valuation
Our unchanged 6-month price target of $250 is derived from five probability
weighted automotive scenarios plus stationary storage optionality, all of
which embed a 20% cost of capital.
Key risks
Worsening overall investor sentiment lessening the appetite for concept
stocks, further delays in the Model X production ramp which could force a
guidance reduction as well as exacerbate FCF burn, and higher-than-
forecasted operating expenses and/or capex investments.
INVESTMENT LIST MEMBERSHIP
Americas Buy List
Coverage View: Neutral
Patrick Archambault, CFA
(212) 902-2817 patri[email protected]om Goldman, Sachs & Co.
Goldman Sachs does and seeks to do business with companies
covered in its research reports. As a result, investors should be
aware that the firm may have a conflict of interest that could
affect the objectivity of this report. Investors should consider
this report as only a single factor in making their investment
decision. For Reg AC certification and other important
disclosures, see the Disclosure Appendix, or go to
www.gs.com/research/hedge.html. Analysts employed by non-
US affiliates are not registered/qualified as research analysts
with FINRA in the U.S.
David Tamberrino, CFA
(212) 357-7617 davi[email protected]om Goldman, Sachs & Co.
Jay Yang
(212) 357-1041 jay.c[email protected] Goldman, Sachs & Co.
The Goldman Sachs Group, Inc. Global Investment Research
Growth
Returns *
Multiple
Volatility Volatility
Multiple
Returns *
Growth
Investment Profile
Low High
Percentile
20th 40th 60th 80th 100th
* Returns = Return on Capital For a complete description of the investment
profile measures please refer to the
disclosure section of this document.
Tesla Motors Inc. (TSLA)
Americas Autos & Auto Parts Peer Group Average
Key data Current
Price ($) 204.66
6 month price target ($) 250.00
Market cap ($ mn) 29,214.6
12/15 12/16E 12/17E 12/18E
Revenue ($ mn) New 5,291.5 9,190.3 11,045.1 14,982.8
Revenue ($ mn) Old 5,291.5 9,190.3 11,045.1 14,982.8
EPS ($) New (2.30) 1.88 1.60 4.25
EPS ($) Old (2.30) 1.88 1.59 4.24
P/E (X) NM 108.6 127.7 48.1
EV/EBITDA (X) 145.0 26.2 25.3 15.5
ROE (%) NM 16.4 10.9 25.0
3/16 6/16E 9/16E 12/16E
EPS ($) (0.57) 0.04 1.23 1.13
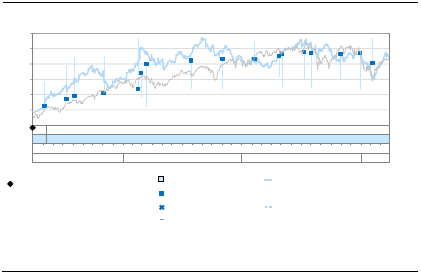
Price performance chart
4,200
4,400
4,600
4,800
5,000
5,200
5,400
5,600
5,800
140
160
180
200
220
240
260
280
300
May-15 Aug-15 Nov-15 Mar-16
Tesla Motors Inc. (L) NASDAQ Composite (R)
Share price performance (%) 3 month 6 month 12 month
Absolute 21.3 (4.4) (17.8)
Rel. to NASDAQ Composite 16.7 1.1 (12.0)
Source: Company data, Goldman Sachs Research estimates, FactSet. Price as of 5/17/2016 close.

May 18, 2016 Tesla Motors Inc. (TSLA)
Goldman Sachs Global Investment Research 2
Tesla Motors Inc.: Summary Financials
Analyst Contributors
Patrick Archambault, CFA
David Tamberrino, CFA
Jay Yang
Profit model ($ mn) 12/15 12/16E 12/17E 12/18E Balance sheet ($ mn) 12/15 12/16E 12/17E 12/18E
Total revenue 5,291.5 9,190.3 11,045.1 14,982.8 Cash & equivalents 1,219.5 1,749.7 1,111.2 1,029.5
Cost of goods sold (4,039.3) (6,883.9) (8,436.7) (11,242.3) Accounts receivable 169.0 469.0 548.5 723.6
SG&A (832.8) (1,168.0) (1,275.0) (1,525.0) Inventory 1,277.8 1,603.4 1,912.7 2,499.1
R&D (628.6) (663.8) (929.4) (1,161.7) Other current assets 125.2 153.8 153.8 153.8
Other operating profit/(expense) 0.0 0.0 0.0 0.0 Total current assets 2,791.6 3,975.9 3,726.2 4,405.9
ESO expense 0.0 0.0 0.0 0.0 Net PP&E 3,403.3 5,138.0 6,641.9 7,685.5
EBITDA 213.5 1,136.0 1,330.0 2,257.6 Net intangibles 0.0 0.0 0.0 0.0
Depreciation & amortization (422.6) (661.5) (926.0) (1,203.9) Total investments 0.0 0.0 0.0 0.0
EBIT (209.1) 474.5 404.0 1,053.8 Other long-term assets 1,897.6 2,545.4 2,921.9 3,431.5
Net interest income/(expense) (117.3) (77.4) (57.6) (76.9) Total assets 8,092.5 11,659.2 13,289.9 15,522.9
Income/(loss) from associates 0.0 0.0 0.0 0.0
Others (41.7) 12.2 12.2 12.2 Accounts payable 1,338.9 1,443.7 1,919.8 2,542.6
Pretax profits (368.1) 409.3 358.5 989.0 Short-term debt 633.2 635.3 635.3 635.3
Provision for taxes (13.0) (126.1) (86.0) (237.4) Other current liabilities 844.2 1,815.5 1,997.0 2,196.7
Minority interest 0.0 0.0 0.0 0.0 Total current liabilities 2,816.3 3,894.5 4,552.2 5,374.6
Net income pre-preferred dividends (381.2) 283.1 272.5 751.7 Long-term debt 2,040.4 2,857.8 3,558.3 4,217.1
Preferred dividends 0.0 0.0 0.0 0.0 Other long-term liabilities 2,146.9 2,549.3 2,549.3 2,549.3
Net income (pre-exceptionals) (381.2) 283.1 272.5 751.7 Total long-term liabilities 4,187.2 5,407.1 6,107.6 6,766.4
Post tax exceptionals 86.2 20.0 0.0 0.0 Total liabilities 7,003.5 9,301.6 10,659.7 12,141.0
Net income (post-exceptionals) (294.9) 303.1 272.5 751.7
Preferred shares 0.0 0.0 0.0 0.0
EPS (basic, pre-except) ($) (2.97) 2.07 1.83 4.94 Total common equity 1,088.9 2,357.7 2,630.1 3,381.8
EPS (diluted, pre-except) ($) (2.97) 1.76 1.60 4.25 Minority interest 0.0 0.0 0.0 0.0
EPS (basic, post-except) ($) (2.30) 2.21 1.83 4.94
EPS (diluted, post-except) ($) (2.30) 1.88 1.60 4.25 Total liabilities & equity 8,092.5 11,659.2 13,289.9 15,522.9
Common dividends paid 0.0 0.0 0.0 0.0
DPS ($) 0.000.000.000.00
Dividend payout ratio (%) 0.0 0.0 0.0 0.0 Additional financials 12/15 12/16E 12/17E 12/18E
Net debt/equity (%) 133.5 73.9 117.2 113.0
Interest cover (X) (1.8) 6.0 7.0 13.7
Growth & margins (%) 12/15 12/16E 12/17E 12/18E Inventory days 100.8 76.4 76.1 71.6
Sales growth 47.0 73.7 20.2 35.7 Receivable days 13.6 12.7 16.8 15.5
EBITDA growth (24.9) 432.1 17.1 69.7 BVPS ($) 8.49 14.66 15.47 19.12
EBIT growth (498.8) 326.9 (14.9) 160.8
Net income (pre-except) growth (594.1) 174.3 (3.8) 175.9 ROA (%) (5.5) 2.9 2.2 5.2
EPS growth (574.4) 169.6 (11.7) 170.5 CROCI (%) (30.0) 7.9 13.5 17.5
Gross margin 23.7 25.1 23.6 25.0
EBITDA margin 4.0 12.4 12.0 15.1 Dupont ROE (%) (35.0) 12.0 10.4 22.2
EBIT margin (4.0) 5.2 3.7 7.0 Margin (%) (7.2) 3.1 2.5 5.0
Turnover (X) 0.7 0.8 0.8 1.0
Cash flow statement ($ mn) 12/15 12/16E 12/17E 12/18E Leverage (X) 7.4 4.9 5.1 4.6
Net income (294.9) 303.1 272.5 751.7
D&A add-back (incl. ESO) 422.6 661.5 926.0 1,203.9 Free cash flow per share ($) (16.84) (11.37) (8.97) (4.87)
Minority interest add-back 0.0 0.0 0.0 0.0 Free cash flow yield (%) (7.3) (5.6) (4.4) (2.4)
Net (inc)/dec working capital 380.5 422.0 268.8 61.0
Other operating cash flow (1,032.7) (675.7) (376.5) (509.6)
Cash flow from operations (524.5) 710.9 1,090.9 1,506.9
Capital expenditures (1,634.9) (2,266.9) (2,429.9) (2,247.4)
Acquisitions 0.0 0.0 0.0 0.0
Divestitures 0.0 0.0 0.0 0.0
Others (34.0) (15.6) 0.0 0.0
Cash flow from investing (1,668.9) (2,282.5) (2,429.9) (2,247.4)
Dividends paid (common & pref) 0.0 0.0 0.0 0.0
Inc/(dec) in debt 1,382.6 1,048.9 700.5 658.9
Other financing cash flows 106.6 1,052.8 0.0 0.0
Cash flow from financing 1,489.2 2,101.7 700.5 658.9
Total cash flow (704.1) 530.2 (638.5) (81.7)
Note: Last actual year may include reported and estimated data.
Source: Company data, Goldman Sachs Research estimates.

May 18, 2016 Tesla Motors Inc. (TSLA)
Goldman Sachs Global Investment Research 3
Risk-reward now favorable in our view, upgrade to Buy
We chose not to upgrade Tesla before the Model 3 announcement at the end of
March as we were concerned that (1) the company would have to take down 2016
guidance, and also about (2) the deteriorating US macro environment, which could
have a disproportionate impact on the demand for higher risk profile stocks. However,
we also underestimated the amount of reservations Tesla would get for the Model 3.
Fast forward to today, we still see risk to the company’s 2016 guidance as there is
limited evidence that the Model X is ramping yet. However, we think diminished
concerns about a recession provide a bit more downside protection than in February,
as does the near 400k in reservations which validate the long term demand picture in
our view. This has underpinned a 24% increase in our price target since April 24, 2016
(mostly driven by increasing the probability of our upside disruptive case). On the flip
side, TSLA shares are down 19% over the same period, leaving us with 22% upside to
our $250 target. While we acknowledge the company’s own expectations for
production in 2018 look difficult to achieve, we believe the risk-reward is favorable.
Product demand is there. We always thought the Model 3 had strong potential as it
showed a superior positioning vs. other existing and planned EVs in terms of range relative
to price (summarized in our competitive benchmarking analysis on pages 15-17). And this
has been strongly supported by the significant reservation demand (approx. 400k) for the
Model 3. We believe recent news articles pointing to widespread duplication of
reservations have been exaggerated because management comments suggest that the
elimination of reservations made with duplicate names or credit cards would still yield a
reservation tally “approaching 400k”. As we detail in pages 13-14, we give the Models S, X,
and 3 the same share of segment as the leading products in these categories,
corresponding to shares in the high single digits (Models S/X) and high teens (Model 3) on
a fully ramped basis. That said, our disruptive cases would correspond to market share in
the 30% range for Model 3, as in these scenarios Tesla would go beyond being a solid
competitor to a real disruptor.
Tesla has recently said they would contemplate raising capital, we estimate needs at
about $1bn.
We conduct a deep dive into the physical costs to build out the capacity
needed to reach the company’s goal of 500k units by 2018. Under these conditions we
forecast a $7.5bn cash use, but that only translates into a $1bn capital raise, after $785mn
of ABL availability, and $5.7bn of EBITDA minus cash taxes and interest. We also fine tune
our own FCF forecasts for these refined capex numbers and reiterate the capital raise
requirements that we initially modeled and do not see much incremental dilution (Exhibits
3 through 7).
Raised expectations? Not in our view. We believe part of the recent decline in the share
price post the Model 3 release was driven by management moving its expectation for 500k
units of production up to 2018 from 2020, setting expectations at a level that in our view
will be very difficult to achieve (which is in fact very close to our disruptive case – not our
base case). This view is based on the prior launch and ramp periods for Tesla’s programs
having been drawn out. While management was not clear why goals were set so
aggressively, we view the adjustment as a target aimed at motivating employees and
suppliers. We also believe these projections are heavily discounted with Street estimates
for 2018 EBITDA and net income (excluding some of the more extreme outliers) coming in
21% and 24% below our base case.
So what’s the catalyst? While we readily admit there are a fewer near-term catalysts in 2016,
we do see potential for positive announcements going forward.
First, the company is due for
a ‘phase 2’ update on the Model 3 – alluded to during the March 31 launch event, that we

May 18, 2016 Tesla Motors Inc. (TSLA)
Goldman Sachs Global Investment Research 4
believe will take place in early 2017; this should have the added benefit of driving incremental
awareness and interest in the mass-market product, and has the potential to drive further
reservations. Secondly, while the timing is highly uncertain, we do expect a shared mobility
announcement from Tesla at some point. While the company has not specifically elaborated
on this topic when asked if a mobility service would be of interest, it has reiterated that its
mission was to accelerate the world’s transportation towards a sustainable system and that if
the fleet was sitting idle 96% of the time, there was an opportunity to improve utilization. We
have seen the more traditional OEMs making movement here – both on the investment and
partnership front, but believe Tesla could have an upper-hand when it chooses given its
manufacturing capability and data collection from its fleet of existing connected vehicles –
which are currently providing data for millions of miles per day.
Finally, we believe the
Model X production ramp is a critical catalyst. Although difficult to assess, we believe that the
current production issues stemming from the Model X are largely discounted and priced into
shares. As a result, should the company ramp up production later this year (as we expect),
we believe shares would react positively.
Valuation looks favorable. As we discussed above, with all the puts and takes of the last
three months, we now see 22% upside potential relative to our 6-month, $250 price target
(derived from our probability weighted Automotive Scenarios plus our Tesla Energy
valuation – summarized below in Exhibit 1).
Exhibit 1: We see 22% upside to TSLA shares
TSLA valuation summary
Source: Company data, Goldman Sachs Global Investment Research.
Disruptivetechnol ogy Category
Historical
referenceperiod
EVmarketvolume
CAGR(2013‐2025)
2025GlobalEV
market(000)
1
Presentvalue
pershare
2
Scenario
Likelihood
ElonasSteveJobs
iPhone
Consumer
electronics
2007‐2016E 42% 4,357 $414 11.7%
ElonasHenryFord
FordModelT Automobiles 1909‐1917 46% 5,974 $485 11.7%
ElonastheMaytag
Repairman
LaundryAppliance/
Dishwasher/Refrigerator
Consumer
durables
1916‐1924/1947‐
1955/1930‐1938
39% 3,317 $343 11.7%
Basecase
EV/Model3 Automobiles 2017‐2025E 33% 2,020 $125 45.0%
Downsidecase
EV/Model3 Automobiles 2017‐2025E 31% 1,633 $61 20.0%
Automotivevaluation $213
TeslaEnergyvaluepershare $37
6‐monthpricetarget $250 Upside:22%
1
Longrange/pureEVsonly
2
Basedonaverage2019‐2025futurevaluesdiscountedbackat20%/15%costofequityduringhigh/lowgrowthperiods
Note:upsidepotentialisbasedoff5/17/2016closingprice

May 18, 2016 Tesla Motors Inc. (TSLA)
Goldman Sachs Global Investment Research 5
In addition, we note that TSLA shares have mostly traded above the $200 range over the
past couple years (
Exhibit 2), and we believe our fundamental valuation work provides a
framework that drives per share value of $250 and above (on our upside cases). For
illustrative purposes, we lay out the 2025 volume levels that we believe the stock price is
discounting on our valuation framework at various inflection points. Interestingly the
recently touched 52-week share price low of c. $141 is slightly below our base case (i.e.,
$162) and discounted a low of 608k units by 2025. At present, Tesla’s share price of approx.
$205 discounts 2025 volume of 940k; while it may be counterintuitive at first given that
volume level is above our base case of 626k, note that our valuation also layers on the
value of disruptive cases that we collectively weight at 35%, which drives the upside.
Exhibit 2: Shares have typically seen support sub-$200
TSLA historical share price
Source: FactSet, Goldman Sachs Global Investment Research.
$100
$120
$140
$160
$180
$200
$220
$240
$260
$280
$300
Dec‐13
Jan‐14
Feb‐14
Mar‐14
Apr‐14
May‐14
Jun‐14
Jul‐14
Aug‐14
Sep‐14
Oct‐14
Nov‐14
Dec‐14
Jan‐15
Feb‐15
Mar‐15
Apr‐15
Apr‐15
May‐15
Jun‐15
Jun‐15
Jul‐15
Aug‐15
Aug‐15
Sep‐15
Oct‐15
Oct‐15
Nov‐15
Dec‐15
Dec‐15
Jan‐16
Jan‐16
Feb‐16
Mar‐
16
Mar‐16
Apr‐16
May‐16
Implies2025
volumeof830k
Implies2025
volumeof1.4mn
Implies2025
volumeof1.2mn
Implies2025
volumeof795k
Implies2025
volumeof608k
Implies2025
volumeof1.1mn
Implies2025
volumeof1.0mn
Implies2025
volumeof
940k

May 18, 2016 Tesla Motors Inc. (TSLA)
Goldman Sachs Global Investment Research 6
Deep dive on capex reinforces the need to raise additional capital,
but only approx. $1 bn
For illustrative purposes, using Tesla’s target of 500k vehicle production by 2018 and
comparing capital costs to previous OEM investment precedents, we find that Tesla
would need to invest approx. $7.5bn to meet these objectives. This in turn requires
approx. $1bn in additional capital under the company’s volume scenario. This is not
very different from the current estimated capital raise requirements that are embedded
in our forecasts.
Using Tesla’s target for vehicle production of 500k units in 2018, we believe the
company would need to invest $7.5bn, requiring $1bn in additional capital.
Using publicly available comps from past OEM projects as well as conversations with some
leading industry experts in production we break down the company’s capital requirements
to get to management’s delivery goal in
Exhibit 3. This entails the physical capital
expenditures required to get the Model 3 off the ground ($3.2bn), other capex needed to
support the ongoing Model S/X programs ($1.8bn), and increased net working capital to
support the company’s delivery goals of 500k units by 2018 ($2.4bn). On our estimates
these components add up to a cash use of $7.5bn, which would be partially offset by the
company’s ABL program ($785mn in remaining availability as of April 2016), as well as
increased cash generation if the company meets its delivery targets ($5.7bn). Netting these
together we estimate an incremental capital need of approx. $1bn.
Exhibit 3: We estimate an incremental capital need of $1bn for the Model 3 program
Tesla cash sources and uses for Model 3 launch (in $ mn)
Source: Company Data, Goldman Sachs Global Investment Research.
Comments
Usesofcash
Paintshop ($50) $350mnspent,"modest"additionalinve stmentfor500kcapacity
Stampingfacility ($80) Previouslyexpanded,assume2additional linesneeded
Bodyshop ($743) BasedonOEMprecedents
Finalvehicleassembly ($831) BasedonOEMprecedents
Tooling&equipment ($388) BasedonOEMprecedents
Gigafactory ($1,141) 70%oftotalcostallocationforautosbasedonusage
TotalModel3capex ($3,234)
Othercapexthrough
2018 ($1,834) OtherGigafactoryspend,servicecenter/superchargerexpansion,etc.
Changeinnetworkingcapital ($2,383) Reflectsincreaseddeliverygoalsof500kby2018
Totalcashuse ($7,451)
Sourcesofcash
ABLcapacity $785 $1bntotalavailabilitylessamountoutstandingasofApril2016
EBITDAlesscashinterestandtaxes $5,735 Reflectsincreaseddeliverygoalsof500kby2018
Totalcashsources $6,520
Teslaadditional
cashneed ($931)
Assumptions:
Model3capacity 375,000Units
%Gigafactoryforautosuse 70.0%

May 18, 2016 Tesla Motors Inc. (TSLA)
Goldman Sachs Global Investment Research 7
We detail the specific cash use components of this exercise below:
Paint shop – Tesla had previously spent approx. $350mn on a new high volume paint shop
meant to support the Model S/X and the upcoming Model 3. However, based on
management’s comments, we believe that the facility will require an additional modest
investment in order to support targeted annual production of 500k vehicles. As a result, we
factor in an additional $50mn for enhancements to the paint shop.
Stamping facility – The company has also expanded its stamping facility, adding two
additional lines for the Model X. While we believe the company currently would have
capacity to support all three vehicles, reaching the full 500k unit goal would likely require
additional lines to support the incremental volume. Therefore, we model in two additional
lines at approx. $40mn a line, for $80mn in additional investment for stamping.
Body shop – We believe that in order to manufacture the Model 3, Tesla will require an
additional body shop in the factory. Looking at body shop investments in the past as a
gauge, we derive an approximate cost per unit for such an investment. Specifically, we
looked at two FCA body shop additions: (1) a $700mn investment announced in 2010 for a
new body shop at FCA’s Belvidere factory to support the new Dodge Dart, and (2) FCA’s
$165mn investment announced in 2011 for a new body shop at its Sterling Heights facility.
Taken together, we think body shop costs at approx. $2,000 per unit of annual capacity are
reasonable (
Exhibit 4). Assuming additional capacity of 375k is needed for the Model 3, we
believe that a new body shop would cost just under $750mn for Tesla.
Exhibit 4: We expect the body shop to cost ~$2,000 per unit of capacity
Previous OEM body shop investments
Source: Company data, IHS, Goldman Sachs Global Investment Research.
Final vehicle assembly line – In order to support the Model 3, Tesla will also need to add
new final vehicle assembly lines. Looking at two previous assembly line additions: (1)
Honda’s $425mn assembly line at its Alabama facility announced in 2002, and (2) Subaru’s
announcement in 2013 to spend $160mn to extend its production line and support 100k
additional units; we believe that an assembly line would cost approx. $2,200 per unit of
annual capacity. This translates to $831mn for new vehicle assembly lines for Tesla with
375k of additional capacity for the Model 3 (
Exhibit 5). In addition, we note that Tesla has
suggested that the Model 3 will be much easier to build and far less complicated than
previous models, so we do acknowledge that the final cost could be lower than this
although the vehicle’s final design has not been revealed.
Exhibit 5: We expect the final assembly line to cost ~$2,200 per unit of capacity
Previous OEM final vehicle assembly line investments
Source: Company data, IHS, Automotive News, Goldman Sachs Global Investment Research.
Year OEM Location Investment Capacity $/Unit Notes
2010 FCA Illinois $700mn 265,000 $2,642 Newbodyshop
2011 FCA Michigan $165mn 125,000 $1,320 Addbodyshop
Average $1,981
Year OEM Location Investment Capacity $/Unit Notes
2002 Honda Alabama $425mn 150,000 $2,833 New150kunitline
2013 Subaru Indiana $160mn 100,000 $1,600 Lineextension
Average $2,217

May 18, 2016 Tesla Motors Inc. (TSLA)
Goldman Sachs Global Investment Research 8
Tooling and equipment – Tesla will also clearly need to invest in tooling and equipment
for the new Model 3. And by detailing a variety of previous investment announcements
from various OEMs relating to tooling and equipment, we can estimate the costs at approx.
$1,000 per unit of annual capacity (
Exhibit 6). As a result, we expect Tesla to spend an
additional $388mn on tooling and equipment costs for the Model 3.
Exhibit 6: We expect tooling to cost ~$1,000 per unit of capacity
Previous OEM tooling and equipment investments
Source: Company data, IHS, Automotive News, Road & Track, LA Times, CBC, Goldman Sachs Global Investment Research.
Altogether, we estimate that a new body shop, assembly line, and tooling & equipment
totals to approx. $5,200 per unit of annual capacity, which is slightly above the cost for a
greenfield facility ($5,000 per unit). To us this makes intuitive sense as the incremental
expenses associated with expanding a working factory while keeping production moving
are likely to be higher than building a greenfield (
Exhibit 7).
Exhibit 7: Tesla costs expected to be slightly higher than a brand new facility
Previous OEM greenfield plant investments
Source: Company data, IHS, Automotive News, Bloomberg, Wards, Autoblog, Goldman Sachs Global Investment Research.
Gigafactory – In this exercise, we allocate 70% of total Gigafactory costs to the auto
business and the remaining 30% to Tesla Energy which we base off the 35 gigawatt usage
for auto and 15 gigawatt usage for battery packs. According to the most recent 10Q, Tesla
has already spent approx. $370mn of the $2.0bn total the company expects to spend for the
facility and we model Gigafactory costs to support the Model 3 at just over $1.1bn.
Other capex – In addition to costs related to the Model 3 we expect Tesla to spend an
additional $1.8bn through 2018 including non-auto related Gigafactory costs, as well as
capex for the expansion of the company’s service centers, retail stores, and supercharger
network.
However, we do note that this specific exercise does not include costs for a new
Year OEM Location Investment Capacity $/Unit Notes
2006 GM Michigan $163mn 250,000 $652 Retooling
2009 Ford Michigan $550mn 220,000 $2,500 Retoolandre‐engineerSUVfactory
2009 GM Ingersoll,Canada $72mn 200,000 $362 Retooling
2013 GM Ingersoll,Canada $200.6mn 300,000 $669 Includesnewequipmentandtooling
2015 GM Ingersoll,Canada $449.3mn 300,000 $1,498 Includesinternalequipmentandvendortooling
2015 GM Michigan $175mn 100,000 $1,750 ToolingandequipmentfornewCamaro
2015 Subaru Indiana $140.2mn 100,000 $1,402 Machinerytosupport100kadditionalunits
2016 GM Michigan $520mn 190,000 $2,737 Retoolingandnewequipmentfornewproducts
2016 Honda Indiana $40mn 60,000 $667 AddingCR‐Vtotheproduction
2016 Hyundai Alabama $52mn 130,000 $400 RetoolingfornewSantaFeSportproduction
Average $1,264
Median $1,035
Year OEM Location Investment Capacity $/Unit Notes
2006 Kia Georgia $1.0bn 300,000 $3,333 Openedin2009
2008 Volkswagen Tennessee $1.0bn 150,000 $6,667 Openedin2011
2012 Nissan Aguascalientes,Mexico $2.0bn 175,000 $11,429 Openedin2013
2012 Volkswagen/Audi SanJoseChiapa,Mexico $1.3bn 150,000 $8,667 Toopenin2016
2014 BMW SanLuisPotosi,Mexico $1.0bn 150,000 $6,667 Toopenin2019
2014 Honda Celaya,Mexico $800mn 200,000 $4,000 Openedin2014
2014 Kia NuevoLeon,Mexico $1.0bn 300,000 $3,333 Toopenin2016
2015 Toyota Guanajuato,Mexico $1.0bn 200,000 $5,000 Toopenin2019
2015 Renault‐Nissan/Mercedes Aguascalientes,Mexico $1.36bn 300,000 $4,533 Toopenin2017
2015 Volvo SouthCarolina $500mn 100,000 $5,000 Toopenin2018
Average $5,863
Median $5,000
May 18, 2016 Tesla Motors Inc. (TSLA)
Goldman Sachs Global Investment Research 9
factory which we believe would be required to achieve management’s growth goals of 1mn
units of vehicle production by 2020 and for which capital spend would likely begin in late
2018/early 2019.
Net working capital –
We include an elevated level of net working capital based on our
modeling assumptions applied to management’s goal of 500k vehicles by 2018. As a result,
under these conditions we would expect net working capital to be a use of cash to the tune of
$2.4bn through 2018 as the company ramps up production and deliveries (Exhibit 3).
As suggested in
Exhibit 3, we expect these costs to be partially offset by both the
company’s ABL facility and cash generation which we detail below:
ABL – The company has $1.0bn asset-based credit facility, of which $565mn is outstanding
including $30mn on a swing-line loan sub-facility. However, the company has paid back
$350mn as of April, leaving $785mn of capacity for additional borrowing.
EBITDA less cash interest and taxes – Under this scenario, we would expect the company to
generate $5.7bn in cash from EBITDA less cash interest and taxes through 2018 using
management’s goals of reaching 500k units by 2018.
In comparison with our hypothetical Model 3 capex exercise discussed above, our
actual estimates contemplate a similarly sized $1bn capital raise, but there are a few
major differences.
There is limited difference in the Model 3 capex assumptions as these
costs will need to be taken before the program launches next year, but in 2018 we continue
to include construction costs for a new manufacturing facility as the company looks to
expand production beyond Fremont. In addition, our EBITDA estimates are lower in our
model compared to the Model 3 exercise as we model in fewer vehicle deliveries compared
to management goals. However, this is offset by lower net working capital in our model as
a result of the lower shipment volumes. Lastly, our model factors in the ability to upsize the
company’s existing asset-backed facility given increased shipments which also provides an
important liquidity offset. Taken together, we arrive at a similar $1bn level of cash need for
the company.

May 18, 2016 Tesla Motors Inc. (TSLA)
Goldman Sachs Global Investment Research 10
Model X has shown improvement, but delivery ramp still a
question mark
Reviewing multiple Tesla forums, we have seen a marked decline in Model X
complaints, and many of those that remain are for more minute details. As a result,
we believe that Tesla has worked through a large number of initial quality issues and
are now able to produce vehicles with greater initial quality and potentially less
rework. We believe this quality improvement is indicative of increased manufacturing
performance and should allow Model X production to ramp going forward. That said,
there has been a recent dip in production as indicated by vehicle delivery cadence –
though this follows typical Model S monthly seasonality.
Initial production issues fading, but customers still experiencing some smaller
bugs/design issues
Roughly eight months into the Model X launch, the delivery ramp continues to be weak as
Tesla works through the initial quality issues. However, after perusing online forums, we
believe that anecdotally customers are now reporting much better initial quality in their new
deliveries. In particular, we note that there are fewer complaints on fit and finish issues such
as those surrounding panel gaps and interior blemishes. We have also seen fewer complaints
with regards to the operation of the Falcon Wing doors and other software-related issues.
Instead, the majority of complaints on the forums deal with the prolonged delays with
deliveries and in some instances, the customer service received while waiting for the order as
well as Tesla’s attempts to upsell certain options or packages that would lead to an earlier
production date. That said, we believe that some product issues likely remain as we have
encountered posts regarding the latching mechanism on the front doors as well as some who
have reported having numerous squeaks and rattles, which we believe is likely accentuated
by the quiet operation of the drivetrain. Additionally, we note that while forum members
have been reporting the panoramic windshield “ghosting” issue which has been well-
documented by the press, we believe that the issue is due, in large part, to the physics of
using laminated glass, which is angled as well as curved at the top – also as detailed in press
reports. Furthermore, the windshield “ghosting” effect is not exclusive to Tesla (press reports
have indicated other vehicles like the Toyota Prius, Dodge Durango, and Chevrolet Camaro
have experienced similar issues) but we think the windshield design (the curve towards the
top as it meets the roof)could exaggerate the effect.
While initial quality is improving, it appears Model X production has recently taken a
step-back; however, this follows a similar Model S monthly pattern
We believe that Tesla has worked through a large number of initial quality issues through
either software fixes or enhanced quality control measures and are now able to produce
vehicles with greater initial quality and potentially less rework. That said, the delivery ramp
decreased considerably following the company’s announcement that it had hit a 750
vehicle build rate by the end of March. We do not see this decline as alarming as: (1) the
third row seat recall likely negatively impacted production, (2) the company narrative
continues to point to material progress in manufacturing quality, and (3) Model X volumes
have followed the typical intra-quarter seasonality as the well-established Model S (
Exhibit
8
and 9). While it is difficult to make a call on Model X production based on the evidence
we have, as mentioned earlier, we believe any throughput improvement documented by
the company or through monthly deliveries would have a positive impact on the stock
given low investor expectations.

May 18, 2016 Tesla Motors Inc. (TSLA)
Goldman Sachs Global Investment Research 11
Exhibit 8: We believe Model X production has taken a
step back following 1Q16’s finish...
US Model X deliveries
Exhibit 9: ...but this is similar to the typical monthly
pattern of the Model S
US Model S/X deliveries
Source: InsideEVs, Goldman Sachs Global investment Research.
Source: InsideEVs, Goldman Sachs Global Investment Research.
6
4
5
199
370
400
1,860
850
0
500
1,000
1,500
2,000
Sep‐15 Oct‐15 Nov‐15 Dec‐15 Jan‐16 Feb‐16 Mar‐16 Apr‐16
ModelXDeliveries
0
1,000
2,000
3,000
4,000
5,000
0
500
1,000
1,500
2,000
Sep‐15 Oct‐15 Nov‐15 Dec‐15 Jan‐16 Feb‐16 Mar‐16 Apr‐16
ModelXDeliveries(LHS) ModelSDeliveries(RHS)

May 18, 2016 Tesla Motors Inc. (TSLA)
Goldman Sachs Global Investment Research 12
Can history repeat itself? Tesla timeline aggressive, but it has been
done before
During the company’s 1Q16 earnings report, management outlined what we consider to be an
aggressive production growth cadence – hitting 500k vehicle production in 2018 and
approximately 1mn vehicles in 2020. Of course, this begs the question, has it been done before?
Looking back over 100 years ago, production of the Model T also had a similar growth path as
the market for automobiles experienced rapid growth. In fact, the ramp curve implied by Tesla
management is very similar to that of the Model T. As we detail in
Exhibit 10, using approx.
20,000 vehicle production as a starting point (Year 1: 1910 for Ford and 2013 for Tesla), we see a
very similar ramp cadence. Notably, the average units implied by our upside cases (which we
weight at 35% in our valuation) is very similar to the implied production curve that we believe
would be needed to hit the company’s ambitious targets. We still believe production will take
on a slower pace at Tesla and model a much more modest production growth cadence, but it’s
interesting to see that it was done before.
Exhibit 10: Tesla’s estimated production ramp is very similar to that of Ford’s Model T 100 years ago
Tesla vehicle deliveries vs. Ford’s Model T
*Model T Year 1 is 1910; Tesla Year 1 is 2013.
Source: Company data, Goldman Sachs Global Investment Research.
0
100,000
200,000
300,000
400,000
500,000
600,000
700,000
800,000
900,000
1,000,000
Year1
Year2
Year3
Year4
Year5
Year6
Year7
Year8
FordModelT TeslaModelS,X,and3(mgmt.implied)
GSestimates:BaseCase GSestimates:Avg.UpsideCase

May 18, 2016 Tesla Motors Inc. (TSLA)
Goldman Sachs Global Investment Research 13
We see Model 3 as a potential market share leader, and Model S/X
as competitive segment entries
Looking at our analysis of the end markets, we believe that Model S and Model X can
gain top five market share in their respective luxury vehicle segments. However, we
believe that the Model 3 could be a potential category leader given its price point,
cachet of the brand, and initial demand levels – as implied by reservations to date.
As previously presented in our recent note, Taking a deeper look into TSLA value following
Model 3 order strength, published on April 25, 2016, our deep dive competitive
benchmarking analysis for Tesla’s current product offerings is outlined below in
Exhibit 12.
Effectively, we see the Model S and Model X products gaining enough global shares
against their respective competition to attain top five positions. On the other hand, Tesla’s
Model 3 could grow to top market share within the segment by 2025, in our view. We
believe that it’s price point relative to competition, the cachet of the Tesla brand (a
technology company vs. a traditional OEM), the vehicle’s base level of features (e.g. semi-
autonomous driving and over-the-air updateability), and the strong response from
reservation demand to date position the product well versus peers.
As a result, our base case sees Tesla’s Model S and X products gaining an average 8%
market share by 2025 and for the Model 3 to be a category leader in entry-level luxury,
taking 17% market share. Our approach to valuing Tesla also includes an upside case,
where Tesla not only becomes an able competitor but effectively disrupts the industry; for
this, the implied market share is in the 20% range for Models S and X and 30% for the
Model 3 (
Exhibit 11). Similarly, we also present the implied share from our downside case
where the roll out of the Model 3 takes a slower path.
Exhibit 11: We estimate Tesla to reach ~300k sales by 2020 and over 625k by 2025 in our base case
Tesla unit sales scenario analysis
Source: Goldman Sachs Global Investment Research.
2015 2016 2017 2018 2019 2020 2021 2022 2023 2024 2025
Model S/X
Base Case 50,557 81,810 98,172 112,898 124,188 134,148 160,977 177,075 193,012 206,522 217,881
Downside Case 50,557 81,810 98,172 112,898 124,188 134,148 140,855 143,672 143,672 139,362 132,394
Average Transformative Case 50,557 81,810 189,065 250,972 337,885 369,567 406,678 422,506 463,877 494,979 503,508
Market Share of Model S/X Landscape
Base Case
2.1% 3.4% 4.0% 4.5% 5.0% 5.5% 6.5% 7.3% 8.0% 8.3% 8.5%
Downside Case
2.1% 3.4% 4.0% 4.5% 5.0% 5.5% 5.7% 5.9% 5.9% 5.6% 5.2%
Average Transformative Case
2.1% 3.4% 7.7% 10.0% 13.7% 15.1% 16.5% 17.4% 19.2% 20.0% 19.6%
Model 3
Base Case 0 0 2,000 52,500 103,250 152,075 205,301 272,024 353,631 388,995 408,444
Downside Case 0 0 2,000 52,500 103,250 152,075 179,449 208,160 239,384 265,717 292,288
Average Transformative Case 0 0 3,852 116,707 331,801 468,770 549,541 574,772 648,309 705,763 661,482
Market Share of Model 3 Landscape
Base Case
0.0% 0.0% 0.1% 2.4% 4.7% 6.8% 9.0% 11.7% 15.0% 16.5% 17.4%
Downside Case
0.0% 0.0% 0.1% 2.4% 4.7% 6.8% 7.8% 9.0% 10.1% 11.3% 12.4%
Average Transformative Case
0.0% 0.0% 0.2% 5.3% 15.0% 20.9% 24.0% 24.8% 27.5% 30.0% 28.1%
Gen IV
Base Case 00000000000
Downside Case 00000000000
Average Transformative Case00000139,111604,313665,631840,5031,189,3021,528,576
Total Tesla
Base Case 50,557 81,810 100,172 165,398 227,438 286,223 366,278 449,099 546,643 595,517 626,325
Downside Case 50,557 81,810 100,172 165,398 227,438 286,223 320,303 351,832 383,056 405,078 424,682
Average Transformative Case 50,557 81,810 192,917 367,679 669,686 977,448 1,560,532 1,662,908 1,952,688 2,390,045 2,693,566

May 18, 2016 Tesla Motors Inc. (TSLA)
Goldman Sachs Global Investment Research 14
Exhibit 12: Tesla’s product offerings generally compete in luxury markets against well-known market leaders
Market landscape for Model S, Model X, and Model 3 vs. top luxury models
Source: IHS, Goldman Sachs Global Investment Research.
Tesla Model S Market Landscape
Model Avera
g
e MSRP 2015 2016 2017 2018 2019 2020 2021 2022 2023 2024 2025
BMW 5 Series $64,180 363,382 345,406 380,090 408,822 392,104 387,915 380,807 376,284 363,445 396,190 419,151
Audi A6 $57,945 292,779 275,583 240,640 237,702 274,412 271,333 264,307 261,004 260,632 243,370 272,633
Mercedes E Class $70,145 277,167 320,150 349,744 352,650 333,157 326,176 319,125 313,545 325,509 374,002 376,922
Mercedes S Class $120,149 102,599 100,498 96,684 88,944 82,875 80,986 105,759 100,886 95,640 93,926 89,123
BMW 7 Series $105,715 39,796 61,775 63,204 58,831 54,215 53,200 48,184 49,911 63,078 64,069 60,763
Total Model S Market 1,353,398 1,402,958 1,440,276 1,497,435 1,486,347 1,467,942 1,452,971 1,433,026 1,437,469 1,500,732 1,591,694
Tesla Model S Base Case $100,000 50,343 49,415 59,298 68,193 75,012 82,513 107,050 120,411 133,178 142,500 148,503
Market Share of Landscape
BMW 5 Series 26.8% 24.6% 26.4% 27.3% 26.4% 26.4% 26.2% 26.3% 25.3% 26.4% 26.3%
Audi A6 21.6% 19.6% 16.7% 15.9% 18.5% 18.5% 18.2% 18.2% 18.1% 16.2% 17.1%
Mercedes E Class 20.5% 22.8% 24.3% 23.6% 22.4% 22.2% 22.0% 21.9% 22.6% 24.9% 23.7%
Mercedes S Class 7.6% 7.2% 6.7% 5.9% 5.6% 5.5% 7.3% 7.0% 6.7% 6.3% 5.6%
BMW 7 Series 2.9% 4.4% 4.4% 3.9% 3.6% 3.6% 3.3% 3.5% 4.4% 4.3% 3.8%
Tesla Model S Base Case 3.7% 3.5% 4.1% 4.6% 5.0% 5.6% 7.4% 8.4% 9.3% 9.5% 9.3%
Tesla Model X Market Landscape
Model Avera
g
e MSRP 2015 2016 2017 2018 2019 2020 2021 2022 2023 2024 2025
BMW X5 $70,295 169,750 162,332 156,745 155,172 151,349 149,134 149,911 150,537 146,468 143,313 134,062
Toyota Land Cruiser $84,820 163,814 152,195 153,839 154,721 153,702 150,500 167,124 175,609 175,230 172,152 171,003
Mercedes ML/GLE-Class $71,193 136,978 168,119 170,337 167,311 165,830 170,649 168,523 166,516 162,140 159,334 154,683
Land Rover Range Rover Sport $81,719 88,885 82,752 78,789 75,076 67,499 69,632 78,083 77,017 73,589 71,510 69,681
Porsche Cayenne $78,378 76,673 69,960 67,739 73,267 72,342 66,069 66,062 65,699 64,823 62,191 70,961
Total Model X Market 1,035,847 1,024,875 1,016,360 1,017,284 977,137 973,857 1,005,983 1,000,773 984,238 974,099 974,131
Tesla Model X Base Case $120,000 214 32,395 38,874 44,705 49,176 51,634 53,927 56,664 59,834 64,022 69,378
Market Share of Landscape
BMW X5 16.4% 15.8% 15.4% 15.3% 15.5% 15.3% 14.9% 15.0% 14.9% 14.7% 13.8%
Toyota Land Cruiser 15.8% 14.9% 15.1% 15.2% 15.7% 15.5% 16.6% 17.5% 17.8% 17.7% 17.6%
Mercedes ML/GLE-Class 13.2% 16.4% 16.8% 16.4% 17.0% 17.5% 16.8% 16.6% 16.5% 16.4% 15.9%
Land Rover Range Rover Sport 8.6% 8.1% 7.8% 7.4% 6.9% 7.2% 7.8% 7.7% 7.5% 7.3% 7.2%
Porsche Cayenne 7.4% 6.8% 6.7% 7.2% 7.4% 6.8% 6.6% 6.6% 6.6% 6.4% 7.3%
Tesla Model X Base Case 0.0% 3.2% 3.8% 4.4% 5.0% 5.3% 5.4% 5.7% 6.1% 6.6% 7.1%
Tesla Model 3 Market Landscape
Model Avera
g
e MSRP 2015 2016 2017 2018 2019 2020 2021 2022 2023 2024 2025
Mercedes C Class $51,470 454,006 414,223 396,123 383,405 351,503 326,120 359,409 419,529 412,860 400,040 395,308
BMW 3 Series $51,419 438,694 419,909 404,759 376,802 418,429 435,934 410,670 384,153 374,994 363,717 344,109
Audi A3 $39,580 369,057 355,434 350,615 343,982 308,427 346,713 386,514 383,009 377,160 370,965 355,241
Audi A4 $45,281 314,616 366,935 377,725 368,835 341,046 326,307 319,634 305,256 374,040 388,652 382,007
Mercedes CLA $43,458 138,349 132,466 128,202 116,577 126,982 129,369 124,264 127,276 126,490 124,528 123,277
Total Model 3 Market 2,307,363 2,297,731 2,263,300 2,209,631 2,209,888 2,246,768 2,288,971 2,316,670 2,358,874 2,353,435 2,350,773
Tesla Model 3 Base Case $45,000 0 0 2,000 52,500 103,250 152,075 205,301 272,024 353,631 388,995 408,444
Market Share of Landscape
Mercedes C Class 19.7% 18.0% 17.5% 17.4% 15.9% 14.5% 15.7% 18.1% 17.5% 17.0% 16.8%
BMW 3 Series 19.0% 18.3% 17.9% 17.1% 18.9% 19.4% 17.9% 16.6% 15.9% 15.5% 14.6%
Audi A3 16.0% 15.5% 15.5% 15.6% 14.0% 15.4% 16.9% 16.5% 16.0% 15.8% 15.1%
Audi A4 13.6% 16.0% 16.7% 16.7% 15.4% 14.5% 14.0% 13.2% 15.9% 16.5% 16.3%
Mercedes CLA 6.0% 5.8% 5.7% 5.3% 5.7% 5.8% 5.4% 5.5% 5.4% 5.3% 5.2%
Tesla Model 3 Base Case 0.0% 0.0% 0.1% 2.4% 4.7% 6.8% 9.0% 11.7% 15.0% 16.5% 17.4%

May 18, 2016 Tesla Motors Inc. (TSLA)
Goldman Sachs Global Investment Research 15
TSLA maintains relevance despite increased competition
So what makes us confident that these aforementioned market share gains can be
achieved? While we see incremental credible competition coming down the road for
Tesla, comparing offerings based on price per mile of range indicates that Tesla’s
portfolio of products should continue to stack up well against pure EV competition.
As also discussed in our April 25, 2016 note, numerous OEMs have made
announcements on the EV front (e.g. Chevy Bolt, Audi Q6 e-tron, and Hyundai Ioniq)
in recent months which have added to the growing EV market.
In particular, we note
that the Bolt has received considerable attention given its low price point and solid range,
which were confirmed during GM’s reveal at CES. In addition, the Bolt has received some
positive early reviews and would have at least a year’s head start on the Model 3, as the
Bolt is expected to go into production at the end of 2016 and assuming Tesla’s production
schedule for the Model 3 holds.
But we believe that the Bolt and Model 3 are not likely to be pure competitors. First,
Tesla has a fairly unique position as an innovative Silicon Valley based brand. Some
investors have argued that its popularity may in fact have little to do with the fact that it’s
an EV, and more to do with the scarcity of the product and the fact that people want to
identify with an innovative company that’s looking to enact a broader industry
transformation. Secondly, the performance will be different with base acceleration of the
Model 3 offering a 0-60 time of less than six seconds vs. less than seven seconds for the
Bolt, we expect that the production Model 3 will likely offer a slightly more sports-oriented
driving experience compared to the Bolt. Finally, we believe the technological content is
also likely to be quite different, with the Model 3 offering Autopilot and firmware updates
among other technological features that are important competitive differentiators.
Exhibit 13: OEMs have continued to announce new EVs, with some improving substantially to challenge Tesla
Battery electric vehicle competitive landscape
Source: Company data, InsideEVs.com, plugincars.com, Goldman Sachs Global Investment Research.
Manufacturer Productname Category
Type
Launch Battery AssumedAveragePrice
U.S Bottom Top
A
verage kWh USD
Tesla ModelS LuxurySedan
BEV
2012 240 294 267 70‐90 $109,950.0
Tesla
ModelX
LuxuryCrossover
BEV
2015 237 257 247 75‐90 $118,575.0
Tesla
Model3
SmallSedan
BEV
2017 215 NA 215 60‐85 $47,500.0
Audi Q6e‐tron LuxuryCrossover
BEV
2018 310 310 310 95 $90,000.0
Audi Q8e‐tron LuxuryCrossover BEV 2019 370 370 370 102 $130,000.0
Audi R8e‐tron LuxurySport
BEV
2016 280 280 280 92 $200,000.0
BMW i3 SmallHatchback
BEV
2014 72 81 76.5 22 $49,620.0
Porsche MissionE LuxurySedan
BEV
2020 310 331 320.5 NA $150,000.0
Mercedes B‐classElectricDrive SmallHatchback BEV 201487878728 $47,155.0
Chevrolet Bolt SmallHatchback
BEV
2016 200 200 200 60 $41,500.0
Chevrolet SparkEV SmallHatchback
BEV
2014 82 82 82 21 $26,677.5
VW E‐Golf SmallHatchback BEV 201483838324 $33,115.0
VW e
‐Up SmallHatchback
BEV
2013 81 81 81 19 $23,500.0
Ford FocusElectric SmallHatchback BEV 2012 100 100 100 23 $30,840.0
Mitsubishi i‐MiEV CompactHatchback
BEV
2011 62 62 62 16 $25,050.0
Kia SoulEV SmallCrossover
BEV
2014 93 93 93 27 $35,500.0
Fiat 500e CompactHatchback
BEV
2013 87 87 87 24 $33,877.5
Smart ElectricCoupe MiniHatchback BEV 2011 68 68 68 18 $27,269.5
Smart ElectricCabrio MiniConvertible
BEV
2011 68 68 68 18 $30,269.5
Nissan Leaf SmallHatchback
BEV
2011 84 107 95.5 24‐30 $33,437.5
Honda FitEV Smallcar BEV 2013 82 82 82 20 $36,625.0
Hyundai IoniqElectric Smallcar
BEV
2017 110 110 110 28 $32,500.0
Range(miles)

May 18, 2016 Tesla Motors Inc. (TSLA)
Goldman Sachs Global Investment Research 16
As battery electric vehicle announcements and offerings have continued to proliferate,
we clearly see two groups of vehicles on offer.
As shown in Exhibit 14, the first revolves
around smaller vehicles, typically in hatchback form, with smaller batteries and low
mileage ranges around the $25k-$45k price point such as the BMW i3, Nissan Leaf, and VW
e-Golf. For the most part, these vehicles can be purchased today. The second appears to be
a group offering significantly higher range but also at a much higher price. These vehicles
also offer additional body styles including coupes, SUVs, and sedans. Aside from the Tesla
Model S and Model X, we note that future Audi/Porsche vehicles are the main competitors,
most notably, the Audi Q6 e-tron which is expected to offer range of 310 miles and was
confirmed for 2018. Interestingly, the Chevrolet Bolt and Model 3 are expected to compete
separately from both groups, offering significantly more range than comparably priced EVs.
Exhibit 14: TSLA’s products currently lead, but Audi/Porsche keep things interesting
Battery electric vehicle landscape
Source: Company data, InsideEVs.com, plugincars.com, Goldman Sachs Global Investment Research.
When we break down the dollar cost per mile of range, TSLA remains towards the
middle of the high end product group, but at the forefront of the lower cost group.
Specifically when compared to the over $90k product group, Tesla’s Model S and Model X
costs per mile of range are $411 and $481, respectively, which are well below that of the
Audi R8 e-tron at $714. However, the Audi Q6 e-tron and Q8 e-tron could potentially
undercut the Tesla Model S and Model X if our price estimates of $90,000 and $130,000,
respectively hold true. When looking at the sub $50k product category, the Model 3
price/range ratio of ~$209 compares well with the Chevrolet Bolt.
$0
$50,000
$100,000
$150,000
$200,000
$250,000
0 50 100 150 200 250 300 350 400
Range(miles)
ModelS
ModelX
Model3
Q6e‐tron
Q8e‐tron
R8e‐tron
i3
MissionE
B‐classElectricDrive
Bolt
SparkEV
E‐Golf
e‐Up
FocusElectric
i‐MiEV
SoulEV
500e
ElectricCoupe
ElectricCabrio
Leaf
FitEV
TeslaOfferings
IoniqElectric

May 18, 2016 Tesla Motors Inc. (TSLA)
Goldman Sachs Global Investment Research 17
Exhibit 15: Tesla looks to lead with the Model 3, but high end offerings from Audi pose a threat to Model S/X
Cost per mile of range
Source: Company data, InsideEVs.com, plugincars.com, Goldman Sachs Global Investment Research.
Part of what drives this less crowded field in our view is Tesla’s advantage in battery cost.
As we have highlighted in the past, Tesla has been very successful in taking cost out of its
battery packs over time, bringing the cost down from $550/kWh for the original Roadster to
about $250/kWh at the start of production for the Model S. We estimate cost has further
declined to approx. ~$180/kWh based on new chemistries, several manufacturing redesigns,
and scale benefits. Tesla expects costs of roughly $150/kWh once the Gigafactory ramps
with the company on its way to achieving its target of below $100/kWh by 2020. By contrast,
industry projections place Li-ion cost at $250/kWh in 2020 for the larger form factor
batteries used by most of Tesla’s competitors.
$0
$100
$200
$300
$400
$500
$600
$700
$800
Sub$50,000offerings
$90,000+offerings

May 18, 2016 Tesla Motors Inc. (TSLA)
Goldman Sachs Global Investment Research 18
We see 22% upside to shares from our valuation work
We value Tesla in Exhibit 16 by modeling three “disruptive” automotive upside cases, in
addition to our automotive base and downside cases, through 2025 and by incorporating the
per share value from the Tesla Energy business (
Appendix 1). Our base case forecast calls
for 286k units by 2020 with volumes growing to 626k by 2025. Our downside case builds off
our 2020 assumption and ultimately contemplates the company reaching only 425k by 2025.
For our three “disruptive” cases, we draw on the experience of past technologies like the
iPhone, the Ford Model-T, and selected consumer durables like refrigerators/laundry
appliances/dishwashers – all of which were widely adopted new technologies that
revolutionized consumption patterns – in order to generate potential volume paths out to 2025
which show significant upside to our base and downside cases. Coincidentally, the average of
these scenarios’ volume paths chart a course similar to what Tesla management recently laid
out – with total deliveries hitting 500k in 2018. We weigh our upside/base/ downside cases
35%/45%/20% – which we recently raised from 25%/50%/25% given our increased comfort in
Model 3 demand coming to fruition. However, our high annual discount rate of 20% remains
given our concerns on execution. See our note, Taking a deeper look into TSLA value following
Model 3 order strength, published on April 25, 2016 for more detail.
For our valuation, our implied present value for Tesla’s automotive business is $213 per
share. We then layer on our Tesla Energy “stationary storage” valuation of $37 per share. As
a result, the total implied value from our combined methodologies comes to $250, implying
20% upside to shares on a 6-month time horizon. For more detail on our disruptive scenarios
and price target methodology, see our March 18, 2014 report, Quantifying Disruption –
TSLA’s impact on Auto and grid storage seems to be discounted.

May 18, 2016 Tesla Motors Inc. (TSLA)
Goldman Sachs Global Investment Research 19
Exhibit 16: Our 6-month price target for TSLA is $250
Valuation summary of upside/downside scenarios for automotive business plus the Tesla Energy business
Source: Company data, Goldman Sachs Global Investment Research.
Price target risks: Where could we be wrong?
TSLA shares fundamentally remain a concept stock and broader investor sentiment
continues to play a large role. Should global growth/US recession trepidation be dialed up
again, investors’ appetite for TSLA shares may be lower.
The company has struggled with the launch of its Model X SUV so far. We ultimately
believe they will be able to ramp production into the 1,000 per week range – given the
eventual success with the Model S production ramp. But should the production curve be
pushed out further Tesla may not be able to offset the delay with sales of the Model S,
which is an aging product. For this reason we model at the bottom end of the company’s
2016 delivery guidance range of 80k-90k vehicles.
Tesla is a growth company that continues to spend significantly in the form of incremental
R&D, SG&A and Capex. Should the company continue to vertically integrate its business
model, we could see upside to these expenditures.
ElonasSteve
Jobs
ElonasHenry
Ford
ElonastheMaytag
Repairman
Basecase Downsidecase
Probability
Weighted
Disruptivetechnology iPhone FordModelT
LaundryAppliance/
Dishwasher/Refrigerator
EV/Model3EV/Model3
Category
Consumer
electronics
Automobiles Consumerdurables Automobiles Automobiles
Historicalreferenceperiod 2007‐2016E 1909‐1917
1916‐1924/1947‐1955/
1930‐1938
2017‐2025E 2017‐2025E
2025GlobalEVmarket(000)
1
4,357 5,974 3,317 2,020 1,633
2025EVmarketshareofglobalLVsales
1
4.2% 5.7% 3.2% 1.9% 1.6%
2025Teslaunits(000)
1
2,759 3,422 1,900 626 425
2025TeslaEVmarketshare
2
63% 57% 57% 31% 26%
2025Revenue$mn $140,254 $176,693 $102,543 $40,159 $26,676
2025Margin 12.6% 12.7% 12.8% 11.8% 11.0%
2025EPS $53.36 $68.68 $39.55 $15.28 $9.41
P/EMultiple
3
26.6x 39.9x 25.8x 25.6x 14.6x
Futurevaluepershare
4
$949 $1,307 $769 $281 $124 valuation
Presentvaluepershare
5
$414 $485 $343 $125 $61 $213
TeslaEnergy
Plus:TeslaEnergyvaluepershare $37 $37 $37 $37 $37 $37
Scenariovaluepershare $451 $522 $380 $162 $98
PotentialUpside 120% 155% 86% ‐21% ‐52% 6‐month
pricetarget
ScenarioLikelihood 11.7% 11.7% 11.7% 45.0% 20.0% $250
1
Longrange/pureEVsonly
Upside:22%
2
ConsumerdurablessharebasedonFordModelT
3
Basedonaveragemultiplesappliedin2019‐2025
4
Basedonaverageof2019‐2025values
5
Basedonaverage2019‐2025futurevaluesdiscountedbackat20%/15%costofequityduringhigh/lowgrowthperiods
Note:upsidepotentialisbasedoff5/17/2016closingprice
Automotive

May 18, 2016 Tesla Motors Inc. (TSLA)
Goldman Sachs Global Investment Research 20
Appendix 1: Our Tesla Energy valuation points to $37 per share
We continue to see stationary storage – through its Tesla Energy business, as a very
meaningful opportunity for Tesla, with a potentially significant Total Addressable Market
(TAM) and with the company’s Gigafactory launch expected to bring much needed scale to
the industry. Our Tesla Energy P&L and valuation, outlined below in
Exhibit 17, points to
$37 of present value per Tesla share driven by our assumption of 30GWh devoted to
storage by 2020.
We note that only the stationary storage piece of the Gigafactory is accretive to our auto
projections, as the dedicated capacity to EV packs and cells will largely be used by Tesla
and is embedded in the cost of goods sold in our automotive forecasts. As shown in detail
below, we assume TSLA goes well above the 15GWh pack capacity that will be dedicated
to stationary storage (we use 30GWh), as we project some slack on the automotive side
(from production, not demand) given our volume forecast that we assume can be
redeployed. We project a cost of $100/kWh (by 2020) at ~14% margins – slightly higher than
corporate average once fully ramped. On our estimates, this would yield $3.2bn in revenue
by 2020E and $410mn in EBT; factoring in $34mn in capital cost on $675mn of investment
(30% of the $2.25bn Tesla plans to spend for its part in the whole factory) we get to $1.63 in
EPS accretion in 2020E. Again, given the substantial growth opportunity that lies ahead, we
would be comfortable using a 1.0-1.5x PEG implying a 40x P/E in 2020E. The net of this
would be $65 of value in 2020; discounted at an appropriately high 20% cost of equity, this
would yield $37 in value today.
Exhibit 17: Tesla Energy business opportunity adds $37 to our valuation on a present value basis
Stationary storage potential P&L and valuation from 2016E to 2020E
Source: Company data, Goldman Sachs Global Investment Research.
TeslaEnergybusiness
2015E 2016E 2017E 2018E 2019E 2020E Comment
EVunits 51 82 100 165 227 286 GSbasecaseforTeslavehiclevolumes
GWh 4 7 8 12 16 20 AllofthisisusedintheproductionprocessandisnotaseparateP&Lopportunity
Cellcapacity(GWh) 8 15 25 35 50
TeslaEnergypackcapacity(GWh) 1 7131930TeslaEnergyisaseparateP&Lopportunity
Avg.pack(kWh) 5050505050Assumption
Impliednumberofpacks 27,059 138,071 253,541 374,295 599,520
Costper(kWh)
Auto
175$ 160$ 145$ 125$ 110$
Teslaimplied
Costper(kWh)TeslaEnergy
149$ 136$ 123$ 106$ 94$
Use15%lowercostforstationarystorageduetolowerdutycycle
Totalcost($mn)
201$ 939$ 1,562$ 1,988$ 2,803$
Operatingmargin 0.2% 6.1% 9.4% 13.1% 13.7% Marginsbelowautoduringramp,thenabovewithscale
Impliedrevenue
202$ 1,000$ 1,724$ 2,288$ 3,247$
Guideof$400mnto$500mnin2016;then5xthatlevelin2017‐‐weassumeslowerramp
yoy%change 396% 73% 33% 42%
EBITcontribution
0$ 61$ 162$ 299$ 445$
TheP&Limpactwillbe100%TSLA,partnernottakinganequitystake
Capitalcost
(34)$ (34)$ (34)$ (34)$ (34)$
On30%ofassumed$2.25bnTeslainvestment@5%debtcost
EBTimpact (33)$ 27$ 128$ 266$ 411$
Taxrate
30.8% 24.0% 24.0% 24.0% 24.0%
Corptaxrate
Sharesoutstanding 161 170 177 184 191 Basecasesharecount
EPSimpact (0.14)$ 0.12$ 0.55$ 1.10$ 1.63$
yoy%change ‐184% 357% 99% 49%
Multiple 80.0x 60.0x 50.0x 40.0x
Futurevalue 10$ 33$ 55$ 65$
PEG 1.7 1.6 1.2 Givensignificantgrowthopportunity,wefeel1.0‐1.5earningsPEGisappropriate
Futurevalue 65$ Using2020futurevalueafterbusinesshasramped
Discountrate 20.0%
Present
value 37$

May 18, 2016 Tesla Motors Inc. (TSLA)
Goldman Sachs Global Investment Research 21
Disclosure Appendix
Reg AC
We, Patrick Archambault, CFA, David Tamberrino, CFA and Jay Yang, hereby certify that all of the views expressed in this report accurately reflect
our personal views about the subject company or companies and its or their securities. We also certify that no part of our compensation was, is or
will be, directly or indirectly, related to the specific recommendations or views expressed in this report.
Unless otherwise stated, the individuals listed on the cover page of this report are analysts in Goldman Sachs' Global Investment Research division.
Investment Profile
The Goldman Sachs Investment Profile provides investment context for a security by comparing key attributes of that security to its peer group and
market. The four key attributes depicted are: growth, returns, multiple and volatility. Growth, returns and multiple are indexed based on composites
of several methodologies to determine the stocks percentile ranking within the region's coverage universe.
The precise calculation of each metric may vary depending on the fiscal year, industry and region but the standard approach is as follows:
Growth is a composite of next year's estimate over current year's estimate, e.g. EPS, EBITDA, Revenue. Return is a year one prospective aggregate
of various return on capital measures, e.g. CROCI, ROACE, and ROE.
Multiple is a composite of one-year forward valuation ratios, e.g. P/E, dividend
yield, EV/FCF, EV/EBITDA, EV/DACF, Price/Book.
Volatility is measured as trailing twelve-month volatility adjusted for dividends.
Quantum
Quantum is Goldman Sachs' proprietary database providing access to detailed financial statement histories, forecasts and ratios. It can be used for
in-depth analysis of a single company, or to make comparisons between companies in different sectors and markets.
GS SUSTAIN
GS SUSTAIN is a global investment strategy aimed at long-term, long-only performance with a low turnover of ideas. The GS SUSTAIN focus list
includes leaders our analysis shows to be well positioned to deliver long term outperformance through sustained competitive advantage and
superior returns on capital relative to their global industry peers. Leaders are identified based on quantifiable analysis of three aspects of corporate
performance: cash return on cash invested, industry positioning and management quality (the effectiveness of companies' management of the
environmental, social and governance issues facing their industry).
Disclosures
Coverage group(s) of stocks by primary analyst(s)
Patrick Archambault, CFA: America-Autos & Auto Parts, America-Autos Dealers. David Tamberrino, CFA: America-Autos & Auto Parts, America-Tires.
America-Autos & Auto Parts: BorgWarner Inc., Dana Holding, Delphi Automotive Plc, Ford Motor Co., General Motors Co., Harley-Davidson Inc.,
Harman International Industries Inc., Johnson Controls Inc., Lear Corp., Magna International Inc., Magna International Inc., Meritor Inc., Metaldyne
Performance Group, Nemak, Tenneco Inc., Tesla Motors Inc..
America-Autos Dealers: AutoNation Inc., Group 1 Automotive Inc., Penske Automotive Group, Sonic Automotive Inc..
America-Tires: Cooper Tire & Rubber Co., Goodyear Tire & Rubber Co., Titan International Inc..
Company-specific regulatory disclosures
The following disclosures relate to relationships between The Goldman Sachs Group, Inc. (with its affiliates, "Goldman Sachs") and companies
covered by the Global Investment Research Division of Goldman Sachs and referred to in this research.
Goldman Sachs beneficially owned 1% or more of common equity (excluding positions managed by affiliates and business units not required to be
aggregated under US securities law) as of the month end preceding this report: Tesla Motors Inc. ($204.66)
Goldman Sachs has received compensation for investment banking services in the past 12 months: Tesla Motors Inc. ($204.66)
Goldman Sachs expects to receive or intends to seek compensation for investment banking services in the next 3 months: Tesla Motors Inc. ($204.66)
Goldman Sachs had an investment banking services client relationship during the past 12 months with: Tesla Motors Inc. ($204.66)
Goldman Sachs had a non-investment banking securities-related services client relationship during the past 12 months with: Tesla Motors Inc.
($204.66)
Goldman Sachs had a non-securities services client relationship during the past 12 months with: Tesla Motors Inc. ($204.66)
Goldman Sachs has managed or co-managed a public or Rule 144A offering in the past 12 months: Tesla Motors Inc. ($204.66)
Goldman Sachs makes a market in the securities or derivatives thereof: Tesla Motors Inc. ($204.66)
Distribution of ratings/investment banking relationships
Goldman Sachs Investment Research global Equity coverage universe
Rating Distribution Investment Banking Relationships
Buy Hold Sell Buy Hold Sell
Global 32% 53% 15% 65% 58% 51%
As of April 1, 2016, Goldman Sachs Global Investment Research had investment ratings on 3,029 equity securities. Goldman Sachs assigns stocks as
Buys and Sells on various regional Investment Lists; stocks not so assigned are deemed Neutral. Such assignments equate to Buy, Hold and Sell for
the purposes of the above disclosure required by the FINRA Rules. See 'Ratings, Coverage groups and views and related definitions' below. The
Investment Banking Relationships chart reflects the percentage of subject companies within each rating category for whom Goldman Sachs has
provided investment banking services within the previous twelve months.
May 18, 2016 Tesla Motors Inc. (TSLA)
Goldman Sachs Global Investment Research 22
Price target and rating history chart(s)
Regulatory disclosures
Disclosures required by United States laws and regulations
See company-specific regulatory disclosures above for any of the following disclosures required as to companies referred to in this report: manager
or co-manager in a pending transaction; 1% or other ownership; compensation for certain services; types of client relationships; managed/co-
managed public offerings in prior periods; directorships; for equity securities, market making and/or specialist role. Goldman Sachs trades or may
trade as a principal in debt securities (or in related derivatives) of issuers discussed in this report.
The following are additional required disclosures:
Ownership and material conflicts of interest: Goldman Sachs policy prohibits its analysts,
professionals reporting to analysts and members of their households from owning securities of any company in the analyst's area of
coverage.
Analyst compensation: Analysts are paid in part based on the profitability of Goldman Sachs, which includes investment banking
revenues.
Analyst as officer or director: Goldman Sachs policy prohibits its analysts, persons reporting to analysts or members of their
households from serving as an officer, director, advisory board member or employee of any company in the analyst's area of coverage.
Non-U.S.
Analysts:
Non-U.S. analysts may not be associated persons of Goldman, Sachs & Co. and therefore may not be subject to FINRA Rule 2241 or FINRA
Rule 2242 restrictions on communications with subject company, public appearances and trading securities held by the analysts.
Distribution of ratings: See the distribution of ratings disclosure above. Price chart: See the price chart, with changes of ratings and price targets in
prior periods, above, or, if electronic format or if with respect to multiple companies which are the subject of this report, on the Goldman Sachs
website at http://www.gs.com/research/hedge.html.
Additional disclosures required under the laws and regulations of jurisdictions other than the United States
The following disclosures are those required by the jurisdiction indicated, except to the extent already made above pursuant to United States laws
and regulations.
Australia: Goldman Sachs Australia Pty Ltd and its affiliates are not authorised deposit-taking institutions (as that term is defined in
the Banking Act 1959 (Cth)) in Australia and do not provide banking services, nor carry on a banking business, in Australia. This research, and any
access to it, is intended only for "wholesale clients" within the meaning of the Australian Corporations Act, unless otherwise agreed by Goldman
Sachs. In producing research reports, members of the Global Investment Research Division of Goldman Sachs Australia may attend site visits and
other meetings hosted by the issuers the subject of its research reports. In some instances the costs of such site visits or meetings may be met in part
or in whole by the issuers concerned if Goldman Sachs Australia considers it is appropriate and reasonable in the specific circumstances relating to
the site visit or meeting.
Brazil: Disclosure information in relation to CVM Instruction 483 is available at
http://www.gs.com/worldwide/brazil/area/gir/index.html. Where applicable, the Brazil-registered analyst primarily responsible for the content of this
research report, as defined in Article 16 of CVM Instruction 483, is the first author named at the beginning of this report, unless indicated otherwise at
the end of the text.
Canada: Goldman Sachs Canada Inc. is an affiliate of The Goldman Sachs Group Inc. and therefore is included in the company
specific disclosures relating to Goldman Sachs (as defined above). Goldman Sachs Canada Inc. has approved of, and agreed to take responsibility for,
this research report in Canada if and to the extent that Goldman Sachs Canada Inc. disseminates this research report to its clients.
Hong
Kong:
Further information on the securities of covered companies referred to in this research may be obtained on request from Goldman Sachs
(Asia) L.L.C.
India: Further information on the subject company or companies referred to in this research may be obtained from Goldman Sachs
(India) Securities Private Limited, Research Analyst - SEBI Registration Number INH000001493, 951-A, Rational House, Appasaheb Marathe Marg,
Prabhadevi, Mumbai 400 025, India, Corporate Identity Number U74140MH2006FTC160634, Phone +91 22 6616 9000, Fax +91 22 6616 9001. Goldman
Sachs may beneficially own 1% or more of the securities (as such term is defined in clause 2 (h) the Indian Securities Contracts (Regulation) Act,
1956) of the subject company or companies referred to in this research report.
Japan: See below. Korea: Further information on the subject
company or companies referred to in this research may be obtained from Goldman Sachs (Asia) L.L.C., Seoul Branch.
New Zealand: Goldman
Sachs New Zealand Limited and its affiliates are neither "registered banks" nor "deposit takers" (as defined in the Reserve Bank of New Zealand Act
1989) in New Zealand. This research, and any access to it, is intended for "wholesale clients" (as defined in the Financial Advisers Act 2008) unless
otherwise agreed by Goldman Sachs.
Russia: Research reports distributed in the Russian Federation are not advertising as defined in the Russian
legislation, but are information and analysis not having product promotion as their main purpose and do not provide appraisal within the meaning of
the Russian legislation on appraisal activity.
Singapore: Further information on the covered companies referred to in this research may be obtained
from Goldman Sachs (Singapore) Pte. (Company Number: 198602165W).
Taiwan: This material is for reference only and must not be reprinted
without permission. Investors should carefully consider their own investment risk. Investment results are the responsibility of the individual
investor.
United Kingdom: Persons who would be categorized as retail clients in the United Kingdom, as such term is defined in the rules of the
Financial Conduct Authority, should read this research in conjunction with prior Goldman Sachs research on the covered companies referred to
herein and should refer to the risk warnings that have been sent to them by Goldman Sachs International. A copy of these risks warnings, and a
glossary of certain financial terms used in this report, are available from Goldman Sachs International on request.
European Union: Disclosure information in relation to Article 4 (1) (d) and Article 6 (2) of the European Commission Directive 2003/125/EC is available
at http://www.gs.com/disclosures/europeanpolicy.html which states the European Policy for Managing Conflicts of Interest in Connection with
Investment Research.
Japan: Goldman Sachs Japan Co., Ltd. is a Financial Instrument Dealer registered with the Kanto Financial Bureau under registration number Kinsho
69, and a member of Japan Securities Dealers Association, Financial Futures Association of Japan and Type II Financial Instruments Firms
61
84
95
104
118
170
200
210
216
214
224
233
236
234
230
235
202
3,000
3,500
4,000
4,500
5,000
5,500
0
50
100
150
200
250
300
Tesla Motors Inc. (TSLA)
Goldman Sachs rating and stock price target histor
y
Stoc k Price Currency : U.S. Dollar
Source: Goldman Sachs Investment Research for ratings and price targets; FactSet closing prices as of 3/31/2016.
The price targets show n should be considered in the context of all prior published Goldman Sachs research, which may or
may not have included pr ice targets, as w ell as developments relating to the company, its indus try and f inancial markets .
Rating
Pric e tar get
Price target at removal
Covered by Patrick Arc hambault, CFA
Not covered by current analyst
NASDA Q Compos ite
Index Price
Stock Price
Apr 1, 2013 B
May 9
M
N
J J A S O N D J F M A M J J A S O N D J F M A M J J A S O N D J F M
2013 20 14 2015 2016
May 18, 2016 Tesla Motors Inc. (TSLA)
Goldman Sachs Global Investment Research 23
Association. Sales and purchase of equities are subject to commission pre-determined with clients plus consumption tax. See company-specific
disclosures as to any applicable disclosures required by Japanese stock exchanges, the Japanese Securities Dealers Association or the Japanese
Securities Finance Company.
Ratings, coverage groups and views and related definitions
Buy (B), Neutral (N), Sell (S) -Analysts recommend stocks as Buys or Sells for inclusion on various regional Investment Lists. Being assigned a Buy
or Sell on an Investment List is determined by a stock's return potential relative to its coverage group as described below. Any stock not assigned as
a Buy or a Sell on an Investment List is deemed Neutral. Each regional Investment Review Committee manages various regional Investment Lists to a
global guideline of 25%-35% of stocks as Buy and 10%-15% of stocks as Sell; however, the distribution of Buys and Sells in any particular coverage
group may vary as determined by the regional Investment Review Committee. Regional Conviction Buy and Sell lists represent investment
recommendations focused on either the size of the potential return or the likelihood of the realization of the return.
Return potential represents the price differential between the current share price and the price target expected during the time horizon associated
with the price target. Price targets are required for all covered stocks. The return potential, price target and associated time horizon are stated in each
report adding or reiterating an Investment List membership.
Coverage groups and views: A list of all stocks in each coverage group is available by primary analyst, stock and coverage group at
http://www.gs.com/research/hedge.html. The analyst assigns one of the following coverage views which represents the analyst's investment outlook
on the coverage group relative to the group's historical fundamentals and/or valuation.
Attractive (A). The investment outlook over the following 12
months is favorable relative to the coverage group's historical fundamentals and/or valuation.
Neutral (N). The investment outlook over the
following 12 months is neutral relative to the coverage group's historical fundamentals and/or valuation.
Cautious (C). The investment outlook over
the following 12 months is unfavorable relative to the coverage group's historical fundamentals and/or valuation.
Not Rated (NR). The investment rating and target price have been removed pursuant to Goldman Sachs policy when Goldman Sachs is acting in an
advisory capacity in a merger or strategic transaction involving this company and in certain other circumstances.
Rating Suspended (RS). Goldman
Sachs Research has suspended the investment rating and price target for this stock, because there is not a sufficient fundamental basis for
determining, or there are legal, regulatory or policy constraints around publishing, an investment rating or target. The previous investment rating and
price target, if any, are no longer in effect for this stock and should not be relied upon.
Coverage Suspended (CS). Goldman Sachs has suspended
coverage of this company.
Not Covered (NC). Goldman Sachs does not cover this company. Not Available or Not Applicable (NA). The
information is not available for display or is not applicable.
Not Meaningful (NM). The information is not meaningful and is therefore excluded.
Global product; distributing entities
The Global Investment Research Division of Goldman Sachs produces and distributes research products for clients of Goldman Sachs on a global
basis. Analysts based in Goldman Sachs offices around the world produce equity research on industries and companies, and research on
macroeconomics, currencies, commodities and portfolio strategy. This research is disseminated in Australia by Goldman Sachs Australia Pty Ltd
(ABN 21 006 797 897); in Brazil by Goldman Sachs do Brasil Corretora de Títulos e Valores Mobiliários S.A.; in Canada by either Goldman Sachs
Canada Inc. or Goldman, Sachs & Co.; in Hong Kong by Goldman Sachs (Asia) L.L.C.; in India by Goldman Sachs (India) Securities Private Ltd.; in
Japan by Goldman Sachs Japan Co., Ltd.; in the Republic of Korea by Goldman Sachs (Asia) L.L.C., Seoul Branch; in New Zealand by Goldman Sachs
New Zealand Limited; in Russia by OOO Goldman Sachs; in Singapore by Goldman Sachs (Singapore) Pte. (Company Number: 198602165W); and in
the United States of America by Goldman, Sachs & Co. Goldman Sachs International has approved this research in connection with its distribution in
the United Kingdom and European Union.
European Union: Goldman Sachs International authorised by the Prudential Regulation Authority and regulated by the Financial Conduct Authority
and the Prudential Regulation Authority, has approved this research in connection with its distribution in the European Union and United Kingdom;
Goldman Sachs AG and Goldman Sachs International Zweigniederlassung Frankfurt, regulated by the Bundesanstalt für
Finanzdienstleistungsaufsicht, may also distribute research in Germany.
General disclosures
This research is for our clients only. Other than disclosures relating to Goldman Sachs, this research is based on current public information that we
consider reliable, but we do not represent it is accurate or complete, and it should not be relied on as such. The information, opinions, estimates and
forecasts contained herein are as of the date hereof and are subject to change without prior notification. We seek to update our research as
appropriate, but various regulations may prevent us from doing so. Other than certain industry reports published on a periodic basis, the large
majority of reports are published at irregular intervals as appropriate in the analyst's judgment.
Goldman Sachs conducts a global full-service, integrated investment banking, investment management, and brokerage business. We have
investment banking and other business relationships with a substantial percentage of the companies covered by our Global Investment Research
Division. Goldman, Sachs & Co., the United States broker dealer, is a member of SIPC (http://www.sipc.org).
Our salespeople, traders, and other professionals may provide oral or written market commentary or trading strategies to our clients and principal
trading desks that reflect opinions that are contrary to the opinions expressed in this research. Our asset management area, principal trading desks
and investing businesses may make investment decisions that are inconsistent with the recommendations or views expressed in this research.
The analysts named in this report may have from time to time discussed with our clients, including Goldman Sachs salespersons and traders, or may
discuss in this report, trading strategies that reference catalysts or events that may have a near-term impact on the market price of the equity
securities discussed in this report, which impact may be directionally counter to the analyst's published price target expectations for such stocks. Any
such trading strategies are distinct from and do not affect the analyst's fundamental equity rating for such stocks, which rating reflects a stock's
return potential relative to its coverage group as described herein.
We and our affiliates, officers, directors, and employees, excluding equity and credit analysts, will from time to time have long or short positions in,
act as principal in, and buy or sell, the securities or derivatives, if any, referred to in this research.
The views attributed to third party presenters at Goldman Sachs arranged conferences, including individuals from other parts of Goldman Sachs, do
not necessarily reflect those of Global Investment Research and are not an official view of Goldman Sachs.
Any third party referenced herein, including any salespeople, traders and other professionals or members of their household, may have positions in
the products mentioned that are inconsistent with the views expressed by analysts named in this report.
This research is not an offer to sell or the solicitation of an offer to buy any security in any jurisdiction where such an offer or solicitation would be
illegal. It does not constitute a personal recommendation or take into account the particular investment objectives, financial situations, or needs of
individual clients. Clients should consider whether any advice or recommendation in this research is suitable for their particular circumstances and, if
appropriate, seek professional advice, including tax advice. The price and value of investments referred to in this research and the income from them
May 18, 2016 Tesla Motors Inc. (TSLA)
Goldman Sachs Global Investment Research 24
may fluctuate. Past performance is not a guide to future performance, future returns are not guaranteed, and a loss of original capital may occur.
Fluctuations in exchange rates could have adverse effects on the value or price of, or income derived from, certain investments.
Certain transactions, including those involving futures, options, and other derivatives, give rise to substantial risk and are not suitable for all investors.
Investors should review current options disclosure documents which are available from Goldman Sachs sales representatives or at
http://www.theocc.com/about/publications/character-risks.jsp. Transaction costs may be significant in option strategies calling for multiple purchase
and sales of options such as spreads. Supporting documentation will be supplied upon request.
All research reports are disseminated and available to all clients simultaneously through electronic publication to our internal client websites. Not all
research content is redistributed to our clients or available to third-party aggregators, nor is Goldman Sachs responsible for the redistribution of our
research by third party aggregators. For research, models or other data available on a particular security, please contact your sales representative or
go to http://360.gs.com.
Disclosure information is also available at http://www.gs.com/research/hedge.html or from Research Compliance, 200 West Street, New York, NY
10282.
© 2016 Goldman Sachs.
No part of this material may be (i) copied, photocopied or duplicated in any form by any means or (ii) redistributed without the prior
written consent of The Goldman Sachs Group, Inc.
