
The Use of Phosphoric Acid to Stiffen
Asphalt Binders
PUBLICATION NO. FHWA-HRT-14-086 NOVEMBER 2014
Research, Development, and Technology
Turner-Fairbank Highway Research Center
6300 Georgetown Pike
McLean, VA 22101-2296

FOREWORD
The Use of Phosphoric Acid to Stiffen Hot Mix Asphalt Binders provides guidelines for the use of
the different commercially available grades of phosphoric acid to enhance the high temperature
performance grade of asphalt binders derived from different crude oil sources for use in hot mix
paving applications. The expected effect on pavement life, in terms of oxidative aging, moisture
resistance, fatigue, rutting, and use with different types of aggregates are presented. Analytical
procedures for detecting the presence of phosphoric acid using X-ray fluorescence spectroscopy
as well as a simple rapid test method are included.
The guidelines presented in this report will be useful to producers of asphalt binders, hot mix
paving contractors, State departments of transportation, and local highway agencies.
Jorge E. Pagán-Ortiz
Director, Office of Infrastructure
Research and Development
Notice
This document is disseminated under the sponsorship of the U.S. Department of Transportation
in the interest of information exchange. The U.S. Government assumes no liability for the use of
the information contained in this document.
The U.S. Government does not endorse products or manufacturers. Trademarks or
manufacturers’ names appear in this report only because they are considered essential to the
objective of the document.
Quality Assurance Statement
The Federal Highway Administration (FHWA) provides high-quality information to serve
Government, industry, and the public in a manner that promotes public understanding. Standards
and policies are used to ensure and maximize the quality, objectivity, utility, and integrity of its
information. FHWA periodically reviews quality issues and adjusts its programs and processes to
ensure continuous quality improvement.

TECHNICAL REPORT DOCUMENTATION PAGE
1. Report No.
FHWA-HRT-14-086
2. Government Accession No.
3. Recipient’s Catalog No.
4. Title and Subtitle
The Use of Phosphoric Acid to Stiffen Hot Mix Asphalt Binders
5. Report Date
November 2014
6. Performing Organization Code
7. Author(s)
Terence Stanley Arnold CChem FRIC
8. Performing Organization Report No.
9. Performing Organization Name and Address
Federal Highway Administration
Pavement Materials Team (HRDI-10)
6300 Georgetown Pike
McLean, VA 22101-2296
10.Work Unit No.
11.Contract or Grant No.
12.Sponsoring Agency Name and Address
Office of Infrastructure Research and Development
Federal Highway Administration
6300 Georgetown Pike
McLean, VA 22101-2296
13.Type of Report and Period
14.Sponsoring Agency Code
HRDI-10
15.Supplementary Notes
16.Abstract
This document offers guidelines for the use of phosphoric acid to stiffen asphalt binders for hot mix paving
applications. Data are presented on the likely effect on pavement life, moisture resistance, and use with limestone
aggregates and liquid amine antistrip additives. Analytical methods for the detection of phosphoric acid in asphalt
binders are also presented. Asphalt producers, hot-mix paving contractors, and State departments of transportation
are the main audiences.
17. Key Words
Asphalt, aggregate, phosphoric acid,
superphosphoric acid, polyphosphoric acid, lime,
antistrip additives, X-ray fluorescence
spectroscopy
18. Distribution Statement
No restrictions. This document is available to the public
through the National Technical Information Service,
Springfield, VA 22161.
http://www.ntis.gov
19. Security Classif. (of this
report) Unclassified
20. Security Classif. (of this page)
Unclassified
21. No. of Pages
87
22. Price
Form DOT F 1700.7 (8-72) Reproduction of completed page authorized

SI* (MODERN METRIC) CONVERSION FACTORS
APPROXIMATE CONVERSIONS TO
SI UNITS
Symbol When You
Know
Multiply By To Find Symbol
LENGTH
in inches
25.4 millimeters mm
ft feet 0.305 meters m
yd yards 0.914 meters m
mi miles 1.61
kilometer
s km
AREA
in
2
square inches 645.2 square millimeters
mm
2
ft
2
square feet 0.093 square mete
rs m
2
yd
2
square yard 0.836 square
meters
m
2
ac acres 0.405 h
ec
t
ar
es
ha
mi
2
square miles 2.59 square kilometer
s km
2
VOLUME
fl oz
fluid ounces 29.57 milliliters
mL
gal gallons
3.785 liters L
ft
3
cubic feet 0.028 cubic meters m
3
yd
3
cubic yards
0.765
cubic meters m
3
NOTE: volumes greater than 100
0 L shall be shown in m
3
MASS
oz
o
unces 2
8
.3
5
g
ra
m
s
g
l
b po
und
s 0.
454 kil
ogra
ms k
g
T short tons (2000
lb) 0.907
megagrams (
or "m
etric ton") Mg (or "t")
TEMPERATURE (exact
degrees)
o
F Fahren
heit 5 (F-
32)/9 Celsius
o
C
or (F-32)
/1.8
ILLUMINATION
fc fo
ot-
cand
les 1
0.7
6
lux lx
fl f
oo
t-L
amb
ert
s 3.426 candela/m
2
cd/m
2
FORCE and PRESSURE or
STRESS
lbf poundforce 4.45 newtons N
lbf/in
2
poundforce p
er square inch 6.89
kilopascals kPa
APPROXIMATE CONVERSIONS F
ROM SI UNITS
Sy
mbol When You Know Multiply By To Find Symbol
LENGTH
mm millimeters 0.039 inches in
m meters 3.28 feet ft
m meters 1.09 yards yd
km kilometers 0.621 miles mi
AREA
mm
2
square millimeters 0.0016 square inches in
2
m
2
square meters 10.764
square feet ft
2
m
2
s
qua
re meters 1
.195
square yards yd
2
ha hectares 2.47 a
cre
s ac
km
2
square kilometers 0.386 square miles mi
2
VOLUME
mL
milliliters 0.034 fluid ounces fl oz
L liters 0.264 gallons gal
m
3
cubic meters 35.314 cubic feet
ft
3
m
3
cubic meters
1.307 cubic yards yd
3
MASS
g gr
ams 0.03
5 o
unces oz
kg k
ilogram
s 2
.202
p
ounds l
b
Mg (or "t")
megagrams (
or "metric ton") 1.103
short tons (2000 lb) T
TEMPERAT
URE (exact degrees)
o
C Celsius 1.8C+32 Fahrenheit
o
F
ILLUMINATION
lx lux 0.0929 foot-candles fc
cd/m
2
c
andela/m
2
0.2919
foot-Lamberts fl
FORCE and PRESSURE or STRESS
N new
tons 0.225 poundforce lbf
kPa kilopascals 0.145 poundforce per square inch lbf/in
2
*SI is the symbol for th International System of Units. Appr
opriate rounding should be made to comply with Section 4 of ASTM E380. e
(Revised March 2003
)
ii
TABLE OF CONTENTS
CHAPTER 1. INTRODUCTION ................................................................................................ 1
BACKGROUND ....................................................................................................................... 1
SOME PHOSPHORIC ACID CHEMISTRY ........................................................................ 2
HOW PHOSPHORIC ACID IS USED TO MODIFY ASPHALT BINDERS.................... 3
RESEARCH PLAN .................................................................................................................. 3
Analysis ................................................................................................................................... 3
Effect of Acid Grade and Binder Types ................................................................................. 4
Aging ....................................................................................................................................... 4
Reaction With Lime and Limestone Aggregates .................................................................... 4
Moisture .................................................................................................................................. 4
CHAPTER 2. ANALYTICAL METHODS ................................................................................ 7
QUANTITATIVE ANALYSIS OF ASPHALT BINDERS FOR PHOSPHORIC
ACID .................................................................................................................................... 7
A SIMPLE QUALITATIVE TEST TO DETECT THE PRESENCE OF
PHOSPHORIC ACID IN ASPHALT BINDERS .......................................................... 12
Reagents ................................................................................................................................ 12
Procedure .............................................................................................................................. 13
SATURATE, AROMATIC, RESIN, AND ASPHALTENE ANALYSIS OF
ASPHALT BINDERS MODIFIED WITH PHOSPHORIC ACID ............................. 14
Findings ................................................................................................................................. 19
HOW DOES THE PHOSPHORIC ACID REACT WITH THE BINDER? .................... 21
MAJOR CONCLUSIONS FROM CHAPTER 2, ANALYTICAL METHODS .............. 22
CHAPTER 3. EFFECT OF ACID GRADE AND BINDER TYPE ....................................... 23
EFFECT OF ASPHALT TYPE ............................................................................................. 23
EFFECT OF PHOSPHORIC ACID GRADE...................................................................... 24
EFFECT OF TANK AGING AT 165 °C .............................................................................. 26
CONCLUSIONS ..................................................................................................................... 28
CHAPTER 4. AGING ................................................................................................................ 29
DOES PHOSPHORIC ACID CATALYZE ASPHALT OXIDATION IN HOT MIX
ASPHALT BINDERS? ..................................................................................................... 29
CONCLUSIONS ..................................................................................................................... 33
CHAPTER 5. LIME AND LIMESTONE AGGREGATES ................................................... 35
LIME ........................................................................................................................................ 35
LIMESTONE .......................................................................................................................... 38
CONCLUSIONS ..................................................................................................................... 41
CHAPTER 6. MOISTURE ........................................................................................................ 43
EFFECT OF WATER ON ASPHALT MASTICS WITH AND WITHOUT
PHOSPHORIC ACID ...................................................................................................... 43
Conclusions ........................................................................................................................... 45
EFFECT OF WATER ON NEAT ASPHALT BINDERS .................................................. 46
Conclusions ........................................................................................................................... 52
iii
EFFECT OF PHOSPHORIC ACID MODIFICATION IN THE USE OF
ANTISTRIP ADDITIVES ............................................................................................... 52
Conclusions ........................................................................................................................... 61
APPENDIX .................................................................................................................................. 65
IATROSCAN® TEST METHOD FOR SARA ANALYSIS OF ASPHALT
BINDERS ........................................................................................................................... 65
Apparatus .............................................................................................................................. 65
Asphaltene/Material Separation ............................................................................................ 65
Iatroscan® TH-10 Procedure ................................................................................................ 66
Report .................................................................................................................................... 67
EFFECT OF OVEN AGING 12 DAYS AT 165 °C ON ASPHALT STIFFNESS ............ 68
DOES PHOSPHORIC ACID CAUSE OXIDATION IN ASPHALT BINDERS? ........... 72
REFERENCES ............................................................................................................................ 75
ADDITIONAL READING ......................................................................................................... 77
iv
LIST OF FIGURES
Figure 1. Photo. XRF cup (inverted) with plastic membrane. .........................................................7
Figure 2. Photo. XRF cup (inverted) filled with asphalt. .................................................................8
Figure 3. Photo. Steel XRF cup holder. ...........................................................................................8
Figure 4. Photo. Interior of XRF spectrometer. ...............................................................................8
Figure 5. Chart. XRF spectrum of asphalt AAB-1 modified with 1 percent of 105-percent
phosphoric acid. ...................................................................................................................9
Figure 6. Chart. XRF spectrum of asphalt AAB-1. .......................................................................10
Figure 7. Chart. XRF Calibration chart for phosphoric acid. ........................................................10
Figure 8. Chart. Plot of XRF signal of SHRP reference asphalts modified with
superphosphoric acid content. ............................................................................................11
Figure 9. Chart. X-ray fluorescence of SHRP reference asphalts modified with
superphosphoric acid corrected for baseline fluorescence. ................................................11
Figure 10. Chart. Accuracy of PPA analysis using XRF. ..............................................................12
Figure 11. Photo. Phosphoric acid detected by the blue color developed in the Susan P.
Needham test. .....................................................................................................................13
Figure 12. Chart. Results of SARA fractionation of AAD-1 and AAD-1 modified with
1 percent of 105-percent phosphoric acid or 0.75-percent phosphorus pentoxide. ...........15
Figure 13. Chart. Results of SARA fractionation of asphalt AAK-1 modified with 1 percent
of 105-percent phosphoric acid or 0.75-percent phosphorus pentoxide. ...........................15
Figure 14. Chart. Results of SARA fractionation of asphalt AAM-1 modified with 1 percent
of 115-percent phosphoric acid , 1 percent of 105-percent phosphoric acid, or 0.75-
percent phosphorus pentoxide............................................................................................16
Figure 15. Chart. Results of SARA fractionation of asphalt ABM-1 modified with 1 percent
of 115-percent phosphoric acid or 0.75-percent phosphorus pentoxide. ...........................16
Figure 16. Chart. Results of SARA separation of asphalt AAD-1 modified with 115-percent
phosphoric acid. .................................................................................................................17
Figure 17. Chart. Results of SARA separation of asphalt AAK-1 modified with 115-percent
phosphoric acid. .................................................................................................................18
Figure 18. Chart. Results SARA separation of asphalt AAM-1 modified with 115-percent
phosphoric acid . ................................................................................................................18
Figure 19. Chart. Results of SARA separation of asphalt ABM-1 modified with 115-percent
phosphoric acid. .................................................................................................................19
Figure 20. Chart. Results of SARA separation of B6317 Venezuelan asphalt modified with
115-percent phosphoric acid. .............................................................................................19
Figure 21. Chart. NMR spectrum of heptane-insoluble fraction of phosphoric acid-modified
asphalt. ...............................................................................................................................21
Figure 22. Chart. NMR spectrum of heptane soluble fraction of phosphoric acid-modified
asphalt. ...............................................................................................................................22
Figure 23. Chart. Initial stiffness of SHRP reference binders modified with 115-percent
phosphoric acid. .................................................................................................................24
Figure 24. Chart. Effect of phosphoric acid grade on the stiffness of asphalt AAD-1. .................25
Figure 25. Chart. Effect of phosphoric acid grade on the stiffness of asphalt AAK-1. .................25
Figure 26. Chart. Effect of phosphoric acid grade on the stiffness of asphalt AAM-1. ................26
Figure 27. Chart. Effect of phosphoric acid grade on the stiffness of asphalt ABM-1. ................26
v
Figure 28. Chart. Simulated tank aging of binders modified with 1 percent of 105-percent
phosphoric acid. .................................................................................................................27
Figure 29. Chart. PAV aging of asphalt AAD-1 modified with 1-percent phosphoric acid at
100 °C under air. ................................................................................................................29
Figure 30. Chart. PAV aging of asphalt AAK-1 modified with 1-percent phosphoric acid at
100 °C under air. ................................................................................................................30
Figure 31. Chart. PAV aging of asphalt AAM-1 modified with 1-percent phosphoric acid at
100 °C under air. ................................................................................................................30
Figure 32. Chart. PAV aging of asphalt ABM-1 modified with 1-percent phosphoric acid at
100 °C under air. ................................................................................................................31
Figure 33. Chart. PAV aging of asphalt AAD-1 modified with 1-percent phosphoric acid at
100 °C under nitrogen. .......................................................................................................31
Figure 34. Chart. PAV aging of asphalt AAK-1 modified with 1-percent phosphoric acid at
100 °C under nitrogen. .......................................................................................................32
Figure 35. Chart. PAV aging of asphalt AAM-1 modified with 1-percent phosphoric acid at
100 °C under nitrogen. .......................................................................................................32
Figure 36. Chart. PAV aging of asphalt ABM-1 modified with 1-percent phosphoric acid, at
100 °C under nitrogen. .......................................................................................................33
Figure 37. Chart. Performance grades of binders after treatment with lime. .................................36
Figure 38. Chart. Effect of lime content on asphalt stiffness.........................................................37
Figure 39. Chart. Flow number for the mixture modified with binder from Lion Oil...................37
Figure 40. Chart. Flow number for the mixture modified with binder from HollyFrontier®
asphalt. ...............................................................................................................................38
Figure 41. Chart. PGs of phosphoric acid-modified binders recovered from limestone mixes. ....40
Figure 42. Chart. Plot of moisture absorption of Citgo® 50-percent asphalt/sand mastic
modified with 115-percent phosphoric acid. .....................................................................43
Figure 43. Chart. Plot of moisture absorption of Citgo® 50-percent asphalt/diabase mastic
modified with 115-percent phosphoric acid. .....................................................................44
Figure 44. Chart. Moisture absorption of Venezuelan 50-percent asphalt/gravel mastic
modified with 115-percent phosphoric acid. .....................................................................44
Figure 45. Chart. Moisture absorption of Citgo® 50-percent asphalt/montmorillonite mastic
modified with 115-percent phosphoric acid. .....................................................................45
Figure 46. Chart. Fifty-percent montmorillonite asphalt binder mastic after water immersion
for 105 days........................................................................................................................46
Figure 47. Chart. Plot of water absorption of Venezuelan asphalt beams modified with
115-percent phosphoric acid. .............................................................................................47
Figure 48. Chart. Plot of stiffness of phosphoric acid modified Citgo® asphalt after 245 days
of water immersion. ...........................................................................................................47
Figure 49. Chart. Plot of phosphate extracted from Lion Oil binder diabase aggregate
gyratory specimen. .............................................................................................................49
Figure 50. Chart. Plot of phosphate extracted from BP Whiting binder diabase aggregate
gyratory specimen. .............................................................................................................49
Figure 51. Chart. Plot of phosphate extracted from Lion Oil binder granite aggregate
gyratory specimen. .............................................................................................................50
Figure 52. Chart. Plot of phosphate extracted from BP Whiting binder granite aggregate
gyratory specimen. .............................................................................................................50
vi
Figure 53. Chart. Plot of phosphate extracted from Lion Oil binder diabase aggregate
loose mix. ...........................................................................................................................51
Figure 54. Chart. Plot of phosphate extracted from BP Whiting binder diabase aggregate
loose mix. ...........................................................................................................................52
Figure 55. Chart. Hamburg rut test of Citgo® asphalt sandstone aggregate. ................................53
Figure 56. Chart. Hamburg rut test of Citgo® asphalt limestone aggregate. ................................54
Figure 57. Chart. Hamburg rut test of Citgo® asphalt granite aggregate. .....................................54
Figure 58. Chart. Hamburg rut test of Citgo® asphalt lime-treated sandstone aggregate. ............55
Figure 59. Chart. Hamburg rut test of Citgo® asphalt lime-treated limestone aggregate. ............55
Figure 60. Chart. Hamburg rut test of Citgo® asphalt lime-treated granite aggregate..................56
Figure 61. Chart. Hamburg rut test of Citgo® asphalt AD-HERE® LA-2 antistrip-treated
sandstone aggregate. ..........................................................................................................56
Figure 62. Chart. Hamburg rut test of Citgo® asphalt AD-HERE® LA-2 antistrip-treated
limestone aggregate. ..........................................................................................................57
Figure 63. Chart. Hamburg rut test of Citgo® asphalt AD-HERE® LA-2 antistrip-treated
granite aggregate. ...............................................................................................................57
Figure 64. Chart. Hamburg rut test of Citgo® asphalt AD-HERE® LOF 65-00
antistrip-treated sandstone aggregate. ................................................................................58
Figure 65. Chart. Hamburg rut test of Citgo® asphalt AD-HERE® LOF 65-00
antistrip-treated limestone aggregate. ................................................................................58
Figure 66. Chart. Hamburg rut test of Citgo® asphalt AD-HERE® LOF 65-00
antistrip-treated granite aggregate. .....................................................................................59
Figure 67. Chart. Hamburg rut test of Citgo® asphalt Innovalt®-W antistrip-treated
sandstone aggregate. ..........................................................................................................59
Figure 68. Chart. Hamburg rut test of Citgo® asphalt Innovalt®-W antistrip-treated
limestone aggregate. ..........................................................................................................60
Figure 69. Chart. Hamburg rut test of Citgo® asphalt Innovalt®-W antistrip-treated granite
aggregate. ...........................................................................................................................60
Figure 70. Equation. Calculation of maltene concentration ..........................................................66
Figure 71. Equation. Calculation of n-heptane filtrate ..................................................................66
vii
LIST OF TABLES
Table 1. History of State regulations on the use of phosphoric acid to modify asphalt. .................2
Table 2. Materials used in the study. ...............................................................................................5
Table 3. Properties of the SHRP asphalt binders. ..........................................................................23
Table 4. Commercial grades of phosphoric acid used. ..................................................................23
Table 5. Stiffness (|G*|/Sin ) of simulated tank-aged binders modified with 105-percent
phosphoric acid. .................................................................................................................27
Table 6. Stiffness sensitivity of reference binders to PPA modification. ......................................28
Table 7. Limestone mix designs. ...................................................................................................39
Table 8. Phosphorus in recovered asphalt binders. ........................................................................39
Table 9. High temperature PGs of phosphoric acid-modified binders recovered from
limestone mixes. ................................................................................................................40
Table 10. Percentage of the added phosphoric acid extracted after 245 days of immersion in
water. ..................................................................................................................................51
Table 11. Summary of Hamburg rut testing results with antistrip additives. ................................61
Table 12. Change in stiffness of asphalt AAD-1 with phosphoric acid modification
immediately after mixing and after 24 h at 165 °C. ...........................................................67
Table 13. Change in stiffness of asphalt AAM-1 with phosphoric acid modification
immediately after mixing and after 24 h at 165 °C. ...........................................................67
Table 14. Change in stiffness of asphalt AAK-1 with phosphoric acid modification
immediately after mixing and after 24 h at 165 °C. ...........................................................68
Table 15. Change in stiffness of asphalt ABM-1 with phosphoric acid modification
immediately after mixing and after 24 hours at 165 °C. ....................................................68
Table 16. Oven aging at 165 °C asphalt AAD-1 modified with 115-percent phosphoric acid . ...68
Table 17. Oven aging at 165 °C asphalt AAD-1 modified with 105-percent phosphoric acid. ....68
Table 18. Oven aging at 165 °C asphalt AAD-1 modified with 85-percent phosphoric acid. ......69
Table 19. Oven aging at 165 °C asphalt AAD-1 modified with 75-percent phosphoric acid. ......69
Table 20. Oven aging at 165 °C asphalt AAD-1 modified with 50-percent “green”
phosphoric acid. .................................................................................................................69
Table 21. Oven aging at 165 °C asphalt AAK-1 modified with 115-percent phosphoric acid . ...69
Table 22. Oven aging at 165 °C asphalt AAK-1 modified with 105-percent phosphoric acid. ....69
Table 23. Oven aging at 165 °C asphalt AAK-1 modified with 85-percent phosphoric acid. ......70
Table 24. Oven aging at 165 °C asphalt AAK-1 modified with 75-percent phosphoric acid. ......70
Table 25. Oven aging at 165 °C asphalt AAK-1 modified with 50-percent “green”
phosphoric acid. .................................................................................................................70
Table 26. Oven aging at 165 °C asphalt AAM-1 modified with 115-percent phosphoric acid .....70
Table 27. Oven aging at 165 °C asphalt AAM-1 modified with 105-percent phosphoric acid. ....71
Table 28. Oven aging at 165 °C asphalt AAM-1 modified with 85-percent phosphoric acid. ......71
Table 29. Oven aging at 165 °C asphalt AAM-1 modified with 75-percent phosphoric acid. ......71
Table 30. Oven aging at 165 °C asphalt AAM-1 modified with 50-percent “green”
phosphoric acid. .................................................................................................................71
Table 31. Oven aging at 165 °C asphalt ABM-1 modified with 115-percent phosphoric acid .....71
Table 32. Oven aging at 165 °C asphalt ABM-1 modified with 105-percent phosphoric acid. ....72
Table 33. Oven aging at 165 °C asphalt ABM-1 modified with 85-percent phosphoric acid. ......72
Table 34. Oven aging at 165 °C asphalt ABM-1 modified with 75-percent phosphoric acid. ......72
δ
viii
Table 35. Oven aging at 165 °C asphalt ABM-1 modified with 50-percent “green”
phosphoric acid. .................................................................................................................72
Table 36. PAV aging asphalt ABM-1 under air pressure at 100 °C. .............................................72
Table 37. PAV aging asphalt AAD-1 under air pressure at 100 °C. .............................................73
Table 38. PAV aging asphalt AAK-1 under air pressure at 100 °C. .............................................73
Table 39. PAV aging asphalt AAM-1 under air pressure at 100 °C. .............................................73
Table 40. PAV aging asphalt ABM-1 under nitrogen pressure at 100 °C. ....................................73
Table 41. PAV aging asphalt AAD-1 under nitrogen pressure at 100 °C. ....................................73
Table 42. PAV aging asphalt AAK-1 under nitrogen pressure at 100 °C. ....................................73
Table 43. PAV aging asphalt AAM-1 under nitrogen pressure at 100 °C. ....................................74
ix
LIST OF ACRONYMS AND ABBREVIATIONS
AASHTO American Association of State Highway and Transportation Officials
BBR Bending Beam Rhometer
DSR Dynamic Shear Rheometer
FID Flame Ionized Detection
HDPE High Density Polyethylene
HMA Hot Mix Asphalt
NMR Nuclear Magnetic Resonance
NYSDOT New York State Department of Transportation
PAV Pressure Aging Vessel
PG Performance Grade
PPA Polyphosphoric Acid
RH Relative Humidity
RTFOT Rolling Thin Film Oven Test
SARA Saturate, Aromatic, Resin, and Asphaltene
SBS Styrene–Butadiene–Styrene
SHRP Strategic Highway Research Program
TCE Trichloroethylene
TFHRC Turner Fairbank Highway Research Center
XRF X-Ray Fluorescence Spectroscopy
x
CHAPTER 1. INTRODUCTION
BACKGROUND
An unsolved mystery regarding the premature failure of I-80 in Nebraska led in part to this
study. The transverse cracking problems that occurred there, as well as highway performance
problems in other States attributed to the use of phosphoric acid but without forensic support,
caused State agencies to question the use of phosphoric acid as an asphalt modifier despite its use
for 30 years. A number of preconceived objections exist. These include the following:
• Phosphoric acid is used as a blowing additive to make roofing asphalt. It will cause
premature aging in paving asphalt.
• Phosphoric acid is an acid; it will react with limestone aggregates.
• Phosphoric acid is an acid; it will react with lime anti-strip additives.
• Phosphoric acid is an acid; it will react with liquid amine antistrip additives (which are
alkaline).
• Phosphoric acid is very hydrophilic; it will promote moisture damage.
• Phosphoric acid is very hydrophilic; it will be leached from asphalt pavements and could
pollute the surrounding ground water.
The American Association of State Highway and Transportation Officials (AASHTO) carried
out surveys in December 2005 and again in October 2008. States were asked, “Do you allow the
use of acid-modified binders?”
The 2005 survey went out to the 50 States as well as the Canadian provinces. Of 31 respondents,
11 allowed phosphoric acid, 16 banned it, 1 restricted its use, and 3 did not specifically address
the issue. Because the Superpave specification is supposed to be blind to additives, it is likely
that phosphoric acid would have been allowed in the latter three States.
In the 2008 follow-up survey, five States specifically allowed phosphoric acid, eight States
banned it, four placed restrictions on its use, and three had a specification for elastic recovery or
phase angle, which would preclude the use of phosphoric acid as the sole modifier. Ten States
did not address the issue. Twenty-three States did not respond to the survey.
The more recent 2009–2010 survey conducted by the Asphalt Institute indicated that the use of
phosphoric acid is banned by 16 States. Thirty-two States do not specifically address the issue,
which would imply that it is allowed, although 20 of these States have either an elastic recovery
or phase angle specification, (which would preclude the use of phosphoric acid or merely force
the inclusion of polymers), leaving 12 States that would allow phosphoric acid as the sole
modifier. One State, Minnesota, has a requirement to carry out the binder tests out after the
addition of 0.5-percent liquid amine antistrip additives. Because amines are alkaline, phosphoric
acid would be expected to react with the amines and might preclude the use of phosphoric acid.
Binder tests are usually carried out before the addition of amine antistrip additives.
1

The results of these three surveys are summarized in table 1.
Table 1. History of State regulations on the use of phosphoric acid to modify asphalt.
Status
AASHTO 2005
AASHTO 2008
AI 2009/2010
Allowed
11
5
3
Banned
16
8
16
Not Addressed
3
10
12
Restricted
1
4
0
With Polymers
0
3
20
No Response
21
23
0
Undecided
1
0
0
Total Responses
53
53
51
AASHTO = American Association of Highway and Transportation Officials
AI = Asphalt Institute
SOME PHOSPHORIC ACID CHEMISTRY
Phosphoric acid exists in different strengths or concentrations, with physical forms ranging from
a clear odorless colorless liquid or a transparent solid, depending on the concentration and
temperature.
The most common form is orthophosphoric acid (H
3
PO
4
)
.
It is commonly called phosphoric acid,
and is one of the oldest known and most important phosphorous compounds. It is made in vast
quantities, usually as an 85-percent acid, by the direct reaction of ground phosphate rock
(calcium phosphate or apatite) with sulfuric acid. This yields “green acid,” which contains
typically 25- to 50-percent H
3
PO
4
and is heavily contaminated with impurities, including anions
such as chloride and sulfate (likely an excess of sulfuric acid), which might be expected to cause
equipment corrosion problems if used to modify asphalt. Green acid is mainly used to produce
fertilizer; some is further refined to phosphoric acid of food-grade quality.
Phosphoric acid is also made by the direct burning of phosphorus and subsequent hydration of
the oxide commonly known as P
2
O
5
.
(Its actual chemical formula is P
4
O
10
but for historical
reasons, it is still called P
2
O
5
.)
The pure acid is crystalline, and the hydrates have tetrahedral PO
4
groups connected by hydrogen
bonds. These persist in the concentrated solutions and are responsible for its syrupy nature.
The grades of phosphoric acid (i.e., orthophosphoric acid (H
3
PO
4)
)) available commercially have
acid concentrations of 50, 75, 85, 100, 105, and 115 percent.
Polyphosphoric acids (PPA) exist and have the general formula H
n+2
P
n
O
3n+1
for n > 1. They
range from pyrophosphoric acid (H
4
P
2
O
7
(n=2)) through the metaphosphoric acid (large values
of n).
Although pyrophosphoric acid may be crystallized in several forms, other grades of phosphoric
acid all have equilibrium distributions of molecules and are known only in liquid or glassy form.
The viscosity of these acids increases greatly as n becomes large.
2

The PPA offered commercially is a mixture of orthophosphoric acid with pyrophosphoric acid,
triphosphoric acid, and higher acids, and is sold on the basis of its calculated content of H
3
PO
4.
HOW PHOSPHORIC ACID IS USED TO MODIFY ASPHALT BINDERS
There are three uses for phosphoric acid in the modification of asphalt binders:
• As an additive: Polymers are often used to improve the performance grade (PG) of
asphalt binders. Some of these polymers are difficult to disperse in asphalt. For example,
U.S. Patents 6,117,926 and 6,399,680 (Engberger and Reinke) describe the use of
phosphoric acid to facilitate the dispersion of these polymers in asphalt binders.
(1,2)
• Synergistic effect with polymers: The most common use is to allow the reduction in the
amount of styrene–butadiene–styrene (SBS) polymer so that the pressure aging vessel
(PAV) dynamic shear rheometer (DSR) value of < 5,000 KPa can be achieved and still
meet the elastic recovery requirements of the other Strategic Highway Research Program
(SHRP) Superpave Plus specifications. It is also used as a supplemental additive to SBS-
modified asphalt that is marginal on the rolling thin film oven test (RTFOT). This test is
intended to mimic the aging of asphalt that occurs in a hot mix plant. The test requires the
dynamic shear (|G*|/Sin ) to increase from a minimum of 1.00 kPa to 2.20 kPa after the
test. Polymer-modified asphalts that are marginal will usually pass the test if stiffened
with small amounts of phosphoric acid.
• Grade bumping: Phosphoric acid is the sole asphalt modifier used to deliberately alter the
asphalt PG.
RESEARCH PLAN
The plan objective is to develop a best practices guide for the use of phosphoric acid as an
asphalt modifier and to address the industry perceptions such as effect on aging, moisture
damage, and reaction with limestone aggregates. Elements of the plan include the analysis, effect
of acid grade and binder types, aging, reaction with limestone aggregates, and moisture, as
described below.
Analysis
Analysis will focus on the following tasks:
• Develop quantitative and qualitative analytical methods for detecting the presence of
phosphoric acid in asphalt.
• Determine the effect on key asphalt binder components (e.g., the saturate, asphaltene,
resin and aromatics content).
δ
3
Effect of Acid Grade and Binder Types
In this area, researchers will determine the following:
• Stiffening effect of phosphoric acid added to asphalt from different crude oil sources and
determine if the effect changes during tank storage.
• Effect of different grades of phosphoric acid.
Aging
Researchers will determine whether phosphoric acid increases the aging rate of asphalt binders.
Some concerns have been expressed on this issue because phosphoric acid is used as a blowing
catalyst in the production of roofing asphalt.
Reaction With Lime and Limestone Aggregates
Some State agencies treat their aggregates with lime (calcium hydroxide) to improve the
moisture resistance of their asphalt mixes. Lime is a strong alkali and might be expected to react
with phosphoric acid in the mix. Limestone (calcium carbonate) is not an alkali but is readily
attacked by acids. In either case, if the phosphoric acid is effectively removed from the binder by
chemical reaction, it could result in softening of the binder. Testing will determine whether
phosphoric acid-modified asphalt will soften if used with limestone aggregates in asphalt mixes.
Moisture
Most liquid antistrip additives are alkaline amines, which might be expected to react with
phosphoric acid. This could result in change in binder stiffness. Tests will be carried out to
determine whether this is the case.
Because phosphoric acid is very hydrophilic, there is a possibility that it would increase the
sensitivity of the mix to moisture damage. Mixes made with aggregates known to be
nonstripping and stripping will be tested for moisture damage using the Hamburg wheel tracker.
The team will determine whether the benefits obtain by modification are permanent. In
particular, phosphoric acid is very soluble in water—is it leached from the mix by rain?
Table 2 lists the materials used in the study.
4

Table 2. Materials used in the study.
Supplier
Name
TFHRC
Reference
Description
SHRP
AAD-1
—
Asphalt Binder California Coastal
SHRP
AAM-1
—
Asphalt Binder West Texas Intermediate
SHRP
AAK-1
—
Asphalt Binder Boscan
SHRP
ABM-1
—
Asphalt Binder California Valley
Citgo®
—
B6362
Asphalt Binder Venezuela 94-Percent Bachaquero-13,
6-Percent Merey-16
BP Whiting
—
B6364
Asphalt Binder Canadian Crude and Gulf Coast Sour
Ergon®/Lion Oil
—
B6367
Asphalt Binder Saudi and Arkansas Crudes
Various
Phosphoric Acid
—
Phosphoric Acid 115-, 105-, 75-, and 50-percent grades
Keystone
Aggregates MD
—
—
Sandstone Aggregate
Mellot Company
MD
—
—
Limestone Aggregate
Arr-Maz
AD-HERE ®
LOF65-00
—
Amine Antistrip Additive
Arr-Mazz
AD-HERE® LA2
—
Amine Antistrip Additive
Innophos
Innovalt®
—
2-Ethylhexyl Phosphate Antistrip Additive
Chemical Lime
Company
Lime
—
Calcium Hydroxide
— Indicates not applicable
TFHRC = Turner Fairbank Highway Research Center
SHRP = Strategic Highway Research Program
5

CHAPTER 2. ANALYTICAL METHODS
QUANTITATIVE ANALYSIS OF ASPHALT BINDERS FOR PHOSPHORIC ACID
X-ray fluorescence spectroscopy (XRF) is an analytical technique by which all the elements in
the periodic table from sodium to uranium can be quantitatively and rapidly detected with
minimal sample preparation. Test samples are irradiated with an X-ray beam, and the resulting
spectrum can be used to provide quantitative information on each element present.
The use of XRF to quantitatively determine the amount of phosphoric acid contained in asphalt
binders was developed by Puzic et al.
(3)
The method has been refined by Reinke et al.
(4)
Samples are placed in cups consisting of two concentric polypropylene rings over which a thin
plastic film is stretched like a drum skin. The X rays are able penetrate the film with no
attenuation of the beam. Initially, 6-micron Mylar® polyester film was chosen for its strength. It
was discovered that it contains the equivalent 0.1-percent phosphoric acid and was discarded in
favor of polypropylene, which contains none. Pictures of the inverted cups are shown in figure 1
and figure 2. A drop of water has been placed on the film of the empty cup in figure 1 to make
the film visible. Warm asphalt is poured into the empty cup while it is sitting on a ¼-inch thick
aluminum plate. The plate acts as a heat sink and prevents the heat of the asphalt from melting
the plastic film. The asphalt temperature is not critical; the asphalt just needs to be molten.
Typical pouring temperatures are 140 °C.
The plastic cup, filled with asphalt, is then placed inside a stainless steel cup holder (figure 3),
which is placed inside the spectrometer (figure 4). Each sample takes 20 to 25 min to run. The
program runs automatically, and the spectrometer is capable of analyzing up to 52 samples
unattended.
Figure 1. Photo. XRF cup (inverted) with plastic membrane.
7

Figure 2. Photo. XRF cup (inverted) filled with asphalt.
Figure 3. Photo. Steel XRF cup holder.
Figure 4. Photo. Interior of XRF spectrometer.
8

All asphalt binders contain a significant amount of sulfur; they do not contain phosphorus.
Because sulfur and phosphorus are next to each other in the periodic table they have very similar
XRF energies. The major K peak energy for phosphorus is 2.013 KeV and for sulfur
2.307 KeV. This proximity causes the peaks in the XRF spectrum from these two elements to
overlap. Because the amount of sulfur in asphalt is very much higher than the amounts of
phosphoric acid typically used for modification, the sulfur peak is very much larger. It
overwhelms the phosphorus peak. This negatively affects the accuracy of the analysis. The XRF
spectrometer software “sees” a phosphorus peak when none may be present. This phenomenon is
clearly shown in figure 6, the XRF spectrum of asphalt AAB-1. At the energy level of
approximately 2.0 KeV on the x-axis, the software has labeled the spectrum P-Ka1 indicating a
phosphorus K peak when none is present. The software is using the intensity of the first part of
the sulfur peak and interprets it incorrectly. Ninety samples of unmodified asphalt binders
showed a phosphoric acid level of 0 to 0.2 percent when we know that none was actually present.
Compare this with figure 5, the XRF spectrum of the same asphalt, AAB-1, modified with
1 percent of 105-percent phosphoric acid where the phosphorus peak can be clearly seen. There
is no fixed detection limit. The results may also depend on the spectrometer used; however, these
results suggest that XRF analyses indicating the presence of low levels of approximately
0.2 percent or less might be misleading.
The accuracy of the phosphoric acid analysis was improved markedly by entering into the
spectrometer software phosphoric acid calibration standards, the known sulfur content of the
binder used. The sulfur levels in the binders were determined using XRF. Accuracy was
improved further by using the published sulfur contents of the SHRP reference binders.
(5)
Figure 5. Chart. XRF spectrum of asphalt AAB-1 modified with 1 percent of 105-percent
phosphoric acid.
α
α
Phosphorous Kα
Sulfur Kα
9
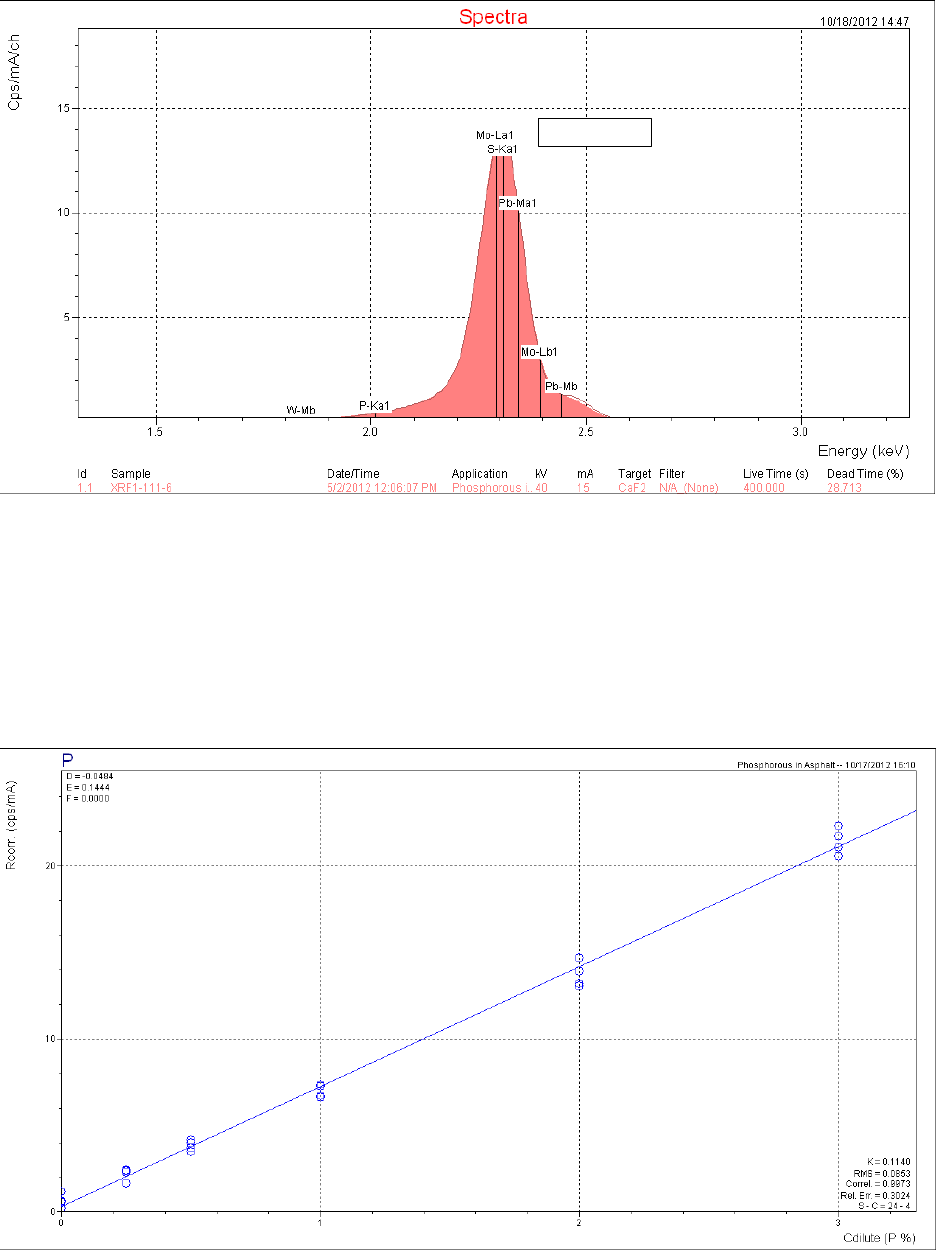
Figure 6. Chart. XRF spectrum of asphalt AAB-1.
Reference standards for the XRF analyses were prepared by blending 105-percent phosphoric
acid in asphalt at 165 °C while stirring briskly with a propeller stirrer under air for 30 min. The
hot asphalt was then poured into XRF cups for analysis. Addition levels of superphosphoric acid
used were 0.25, 0.5, 1.0, 2.0, and 3.0 percent. The correlation chart showing phosphoric acid
concentration plotted against the XRF intensity (measured in counts per second per milliamp of
current), taken from the spectrometer is shown in figure 7. The R
2
correlation is 0.9973.
Figure 7. Chart. XRF Calibration chart for phosphoric acid.
Sulfur Kα
10

Figure 8 shows that the XRF signals of the four SHRP reference asphalts at zero phosphoric acid
addition differ slightly.
Figure 9 shows the same data corrected for the difference in zero acid addition.
Figure 8. Chart. Plot of XRF signal of SHRP reference asphalts modified with
superphosphoric acid content.
The XRF up to 1-percent acid modification is the same for the four asphalts. However, at higher
modification levels, the curves diverge, indicating some asphalt dependency. Test results were
found to be less accurate at higher modification levels as shown in figure 10.
Figure 9. Chart. X-ray fluorescence of SHRP reference asphalts modified with
superphosphoric acid corrected for baseline fluorescence.
0
5
10
15
20
25
30
0 1 2 3 4
C
P
S
/
m
A
Phosphoric Acid %
AAD
AAP
AAF
AAB
0
5
10
15
20
25
0 1
2
3 4
C
P
S
/
m
A
Phosphoric Acid %
AAD
AAP
AAF
AAB
11

Figure 10. Chart. Accuracy of PPA analysis using XRF.
A SIMPLE QUALITATIVE TEST TO DETECT THE PRESENCE OF PHOSPHORIC
ACID IN ASPHALT BINDERS
Because not all State agencies have access to XRF spectrometers, a simple procedure, the “Susan
P. Needham Test,” was developed. It is a very simple technique; it requires no special
equipment—just the use of a few simple chemicals. The test is very sensitive, and care must be
taken that the equipment used and chemical used do not contain phosphates. This is particularly
true for the use of metal cans that contain a phosphate film on the surface because they will give
a positive result. The test has been submitted to AASHTO and is published as provisional test
method TP 78-09, “Detecting the Presence of Phosphorus in Asphalt Binder.” The following
describes the reagents and procedures used in the test method.
Reagents
• Antimonyl Tartrate/Ammonium Molybdate Solution: Dissolve 0.13 g of potassium
antimonyl tartrate hydrate [C
8
H
4
K
2
O
12
Sb
2
∙H
2
O] in 50 mL of distilled water. Add 5.6 g of
ammonium molybdate [(NH
4
)
6
Mo
7
O
24
∙4 H
2
O] and swirl until dissolved.
• 1N Sulfuric Acid Solution (H
2
SO
4
): This can be purchased in 1-L polyethylene bottles.
• Stock Solution Mixture: Mix (solution 1) and approximately 950 mL of (solution 2)
above. This can be done by adding solution 1 to the 1 L of solution 2 if there is sufficient
space in the bottle. The exact amount of solution 2 is not critical. This stock solution is
stable for 1 year.
0
0.5
1
1.5
2
2.5
3
3.5
1 2
3 4 5 6
7 8 9 10 11 12 13 14
105% PPA Content
Sample Number
Actual
Found
12

• Ascorbic Acid Color Reagent: Dissolve 0.50 g of L-Ascorbic Acid [C
6
H
8
O
6
] in 100 mL
of solution 3. This reagent is stable for a week if stored at 4 °C; otherwise, prepare the
reagent fresh daily or as needed.
• Iso Butanol ((CH
3
)
2
CHCH
2
OH) (n-butanol can also be used).
Procedure
Description:
• Heat the asphalt and pour 1 to 2 g into a small container, glass beaker, or test tube.
• Place the container in an oven for 10 min to ensure the asphalt is fluid.
• Remove the container and immediately add 2 mL of solution 5 while swirling the
container.
• Continue to swirl the container and add 2 mL of distilled water.
• While still swirling the container, add 2 mL of solution 4.
Identification:
• If phosphoric acid is present in the asphalt, a blue color (figure 11) will develop at the
bottom of the tube within 5 to10 min. (Decant into a second 1 oz can/glass tube if unable
to see color.)
Figure 11. Photo. Phosphoric acid detected by the blue color developed in the
Susan P. Needham test.
13
SATURATE, AROMATIC, RESIN, AND ASPHALTENE ANALYSIS OF ASPHALT
BINDERS MODIFIED WITH PHOSPHORIC ACID
Solvent separation of asphalt binders (saturate, aromatic, resin, and asphaltene (SARA) analysis)
was accomplished using Chromarods® (thin layer chromatography) run on the Iatroscan®
TH-10 hydrocarbon analyzer. This method results in the separation of the four operationally
defined fractions inherently present in all petroleum-derived asphalt and asphaltic residuals,
namely are asphaltenes, resins, aromatics, and saturates.
Asphaltenes are the viscosity builders in asphalt. They are black amorphous solids that contain
the bulk of the heteroatoms (nitrogen, sulfur, and oxygen) found in asphalt. Trace elements, such
as nickel and vanadium, are also present. Asphaltenes are highly polar aromatic materials of
aggregated molecular weights of 750 (number average), and constitute approximately 5 to
25 percent of the weight of asphalt.
Resins (polar aromatics) are dark-colored, solid or semi-solid, very adhesive fractions of
relatively high molecular weight present in the maltenes. They are the dispersing agents or
peptizers for the asphaltenes, and the ratio of resins to asphaltenes governs, to a degree, the sol-
or gel-type character of asphalts. Resins separated from bitumen are found to have molecular
weights of 800 to 2,000 (number average) but there is a wide molecular distribution. This
component constitutes 15 to 25 percent of the weight of asphalts.
Cyclics (naphthenic aromatics) comprise the compounds of lowest molecular weight in bitumen
and represent the major portion of the dispersion medium for the peptized asphaltenes. They
constitute 45 to 60 percent by weight of the total asphalt and are dark viscous liquids. They are
compounds with aromatic and naphthenic aromatic nuclei with side chain constituents and have
molecular weights of 500 to 900 (number average).
Saturates comprise predominately the straight-and-branched-chain aliphatic hydrocarbons
present in bitumen, together with alkyl naphthenes and some alkyl aromatics. The average
molecular weight range is approximately similar to that of the cyclics, and the components
include the waxy and non-waxy saturates. This fraction forms 5 to 20 percent of the weight of
asphalts.
The test method used was kindly provided by Dr. Gaylon Baumgardner of Ergon® Inc. A copy
of the method is provided in the appendix.
The four test asphalts, AAD-1, AAK-1, AAM-1, and ABM-1 were dosed with the equivalent of
1-percent acid. For phosphorus pentoxide, the stoichiometry calculates to 0.75 percent. The
samples were conditioned overnight at 165 °C. Separation was carried out according the
aforementioned procedure. The results are shown in figure 12 to figure 15.
14

Figure 12. Chart. Results of SARA fractionation of AAD-1 and AAD-1 modified with
1 percent of 105-percent phosphoric acid or 0.75-percent phosphorus pentoxide.
Figure 13. Chart. Results of SARA fractionation of asphalt AAK-1 modified with 1 percent
of 105-percent phosphoric acid or 0.75-percent phosphorus pentoxide.
18.2
19.7
21.6
6.1
5.9
5.4
36.5
33.5
38.1
38.9
40.1
34.5
0%
10%
20%
30%
40%
50%
60%
70%
80%
90%
100%
Control P2O5 105
Resins
Cyclics
Saturates
Asphaltenes
16.6
17.9
20.9
21.3
3.4
3.8
3
3.3
43.2
42.2
52.4
44.3
36.8
35.4
23.7
30.6
0%
10%
20%
30%
40%
50%
60%
70%
80%
90%
100%
Control P2O5
105 105
Resins
Cyclics
Saturates
Asphaltenes
15

Figure 14. Chart. Results of SARA fractionation of asphalt AAM-1 modified with 1 percent
of 115-percent phosphoric acid , 1 percent of 105-percent phosphoric acid, or 0.75-percent
phosphorus pentoxide.
Figure 15. Chart. Results of SARA fractionation of asphalt ABM-1 modified with 1 percent
of 115-percent phosphoric acid or 0.75-percent phosphorus pentoxide.
The Iatroscan® technique is very sensitive to temperature, humidity, and time. Test results in the
Turner Fairbank Highway Research Center (TFHRC) chemistry laboratory showed a high degree
of variability because, at the time of this research, the building temperature and humidity were
not well controlled. This variability precluded the detection of any trend at low levels of acid
modification in the components separated by the technique. The tests were repeated, with higher
3.6
3.6
5.9
8.8
7.1
8.1
8.2
5.3
4.6
4.7
4.1
4.1
50.2
51.4
52.3
51.8
55.2
51.4
37.7
38.9
36.8
34.3
33.6
36.1
0%
10%
20%
30%
40%
50%
60%
70%
80%
90%
100%
Control Control P2O5 115 105 105
Resins
Cyclics
Saturates
Asphaltenes
3.9
4
7.5
5.1
8.5
4.6
49.9
46.2
47.4
41
41.4
40.5
0%
10%
20%
30%
40%
50%
60%
70%
80%
90%
100%
Control P2O5 115
Resins
Cyclics
Saturates
Asphaltenes
16

levels of acid than would be expected to be used in practice, to see whether a definite trend could
be determined.
Samples of the four SHRP test asphalts were dosed with 115-percent phosphoric acid at acid
levels from 1 to 4 percent (based on 100-percent acid) and the samples aged overnight at 165 °C.
The variability of the technique is evident from the shapes of the curves shown in the following
four charts (figure 16 through figure 20). The data do, however, illustrate trends.
Figure 16. Chart. Results of SARA separation of asphalt AAD-1 modified with 115-percent
phosphoric acid.
0
10
20
30
40
50
0 1 2 3 4
%
Acid %
Asphaltenes
Saturates
Cyclics
Resins
17

Figure 17. Chart. Results of SARA separation of asphalt AAK-1 modified with 115-percent
phosphoric acid.
Figure 18. Chart. Results SARA separation of asphalt AAM-1 modified with 115-percent
phosphoric acid .
0
10
20
30
40
50
0 1
2 3 4
%
Acid %
Asphaltenes
Saturates
Cyclics
Resins
0
10
20
30
40
50
0 1 2 3 4
%
Acid %
Asphaltenes
Saturates
Cyclics
Resins
18

Figure 19. Chart. Results of SARA separation of asphalt ABM-1 modified with 115-percent
phosphoric acid.
Figure 20. Chart. Results of SARA separation of B6317 Venezuelan asphalt modified with
115-percent phosphoric acid.
Findings
The following findings resulted from the SARA analysis:
1. Phosphorus pentoxide has less effect on the SARA fractions than does phosphoric acid.
0
10
20
30
40
50
0
1 2
3 4
%
Acid %
Asphaltenes
Saturates
Cyclics
Resins
0
10
20
30
40
50
0 1 2 3 4
%
Acid %
Asphaltenes
Saturates
Cyclics
Resins
19
2. The heptane insoluble fractions (labeled as asphaltenes), of all five asphalt samples increased
with increasing acid content.
3. The increase in the heptane insoluble fraction with increasing acid content was accompanied
by a decrease in one or more of the other fractions:
a. AAD-1: The increase in the heptane insoluble fraction from 19.5 to 31 percent was
accompanied by an almost equal decrease in the level of the resin fraction from 31 to
19.4 percent. The cyclic fraction varied a little but was basically unchanged while the
saturate fraction level did not change at all.
b. AAK-1: The increase in the heptane insoluble fraction from 17.5 to 33.6 percent was
accompanied by a decrease in the resin content up to the 3-percent acid level when the
resin content then increased up to the 4-percent acid level. This increase in the resin
fraction was accompanied by a decrease in the cyclic fraction, which was constant up to
the 3-percent acid level and then declined. The amount of saturates was unchanged.
c. AAM-1: The heptane insoluble fraction showed an increase from 4.6 to 21.8 percent.
This was accompanied by an overall decrease in resin content from 35.4 to 26.6 percent
although the curve shows an inflexion point at 2- to 3-percent acid. The content of cyclics
shows a steady decline from 53.7 to 44.3 percent. There is some fluctuation in the level
of saturates but overall, these remain almost unchanged.
d. ABM-1: There is a 14.85-percent straight line increase in the heptane insoluble fraction
from 4.3 to 19.15 percent. This is accompanied by a straight line decrease of 13.9 percent
in the resin content from 38.6 to 24.7 percent. The levels of saturates and cyclics remain
unchanged.
e. B6317 Venezuelan Asphalt: The heptane insoluble fraction shows a steady increase from
12.8 to 24.9 percent. The resin content declined from 33.8 to 19.6 percent and showed a
small inflection point at the 2-percent acid level.
f. Four of the charts show a positive inflection point in the resin content, and this is
accompanied by a negative inflection in the level of cyclics. Our experience with the
Iatroscan® chromatographic technique has shown that the separation of saturates is
straightforward and very reproducible. The separation of the cyclics and resins is much
more difficult and subject to variation. Each data point in the charts is the average result
of reading 10 Iatroscan® rods and so could reasonably be expected to show the true
picture. Although four of the five charts show a decline in the level of cyclics with
increasing acid, it cannot be assumed that they do actually decline. It may be some quirk
with the technique. The level of the heptane insoluble fraction is not affected because it is
not determined with the Iatroscan®. This fraction is removed before the Iatroscan® step
and determined gravimetrically.
4. The increase in the amount of heptane insoluble fraction is not necessarily accompanied by
an equivalent increase in viscosity. ABM-1, which shows no increase in stiffness when
modified with up to 1-percent of 115 percent phosphoric acid, also shows the same rate of
increase in heptane insoluble fraction as the other asphalts but, up to the 1-percent acid
20

modification level, at least this was found to be actually accompanied by a slight decrease in
stiffness (figure 15 and chapter 3).
5. The change in stiffness of the four SHRP reference binders when modified with phosphoric
acid is shown in chapter 3. The sensitivity of the stiffness change to phosphoric acid addition
found was AAK-1 > AAM-1 > AAD-1 > ABM-1. No correlation could be found between
this phosphoric acid/stiffness sensitivity to any of the chemical characteristics published in
SHRP-A-645 “SHRP Materials Reference Library: Asphalt Cements: A Concise Data
Compilation.”
(5)
HOW DOES THE PHOSPHORIC ACID REACT WITH THE BINDER?
A small amount of the asphaltenes and heptane-insoluble fractions from the initial solvent
separations was analyzed using the energy dispersive spectrometry attachment to the Amray
scanning electron microscope. This is purely a qualitative test. It showed that the heptane-
insoluble fraction contained phosphorus while the heptane-soluble maltene fraction contained
none.
This was confirmed by Liquid State
31
P nuclear magnetic resonance (NMR) spectra. The
spectrum for the heptane-insoluble fraction (asphaltenes) shown in figure 21 clearly shows the
peak due to the presence of phosphorus. In figure 22, the NMR spectrum for the heptane-soluble
fraction (maltenes) has no phosphorus peak.
Figure 21. Chart. NMR spectrum of heptane-insoluble fraction of phosphoric acid-
modified asphalt.
21

Figure 22. Chart. NMR spectrum of heptane soluble fraction of phosphoric acid-modified
asphalt.
MAJOR CONCLUSIONS FROM CHAPTER 2, ANALYTICAL METHODS
• With proper calibration, the phosphoric acid content of asphalt binders can be readily
measured using XRF spectroscopy.
• The Susan P. Needham test, which requires no specialized equipment, can be used to
detect the presence of phosphoric acid in asphalt binders.
• Addition of phosphoric acid to asphalt binders causes an increase in the heptane-insoluble
fraction, which is not necessarily accompanied by a corresponding increase in binder
stiffness.
• The phosphorus from the acid all ends up in the heptane-insoluble phase.
• The increase in the heptane-insoluble fraction is generally accompanied by a decrease in
the resin fraction. With some binders, there may have been a change in the level of
cyclics although variability in the method makes this uncertain. The level of saturates is
unaffected by the use of phosphoric acid.
22

CHAPTER 3. EFFECT OF ACID GRADE AND BINDER TYPE
This chapter addresses the issue of acid grade, that is, can all of the commercially available
grades of phosphoric acid be used, how does their effect vary with asphalt from different crude
oil sources, and how does the rheology of the modified binders change following addition.
When polymers such as SBS are added to asphalt binders, it usually takes several hours before
the full stiffening effect is achieved. To determine whether this is the case with phosphoric acid,
the stiffness (|G*|/Sin at 64 °C) was first measured immediately after mixing. Samples were
then oven aged, in air tight containers to minimize oxidation, at 165 °C to determine whether the
stiffness would be likely to change after 12 days in a storage tank.
The four SHRP reference asphalts used are shown in table 3, and the five grades of commercially
available phosphoric acid grades in table 4.
Table 3. Properties of the SHRP asphalt binders.
Origin
Grade
Asphaltenes
(percent)
Polar Aromatics
(percent)
Napthenic Aromatics
(percent)
Saturates
(percent)
AAD-1
CA Coastal
58-28
20.5
41.3
25.1
8.6
AAK-1
Venezuelan
64-22
20.1
41.8
30.0
5.1
AAM-1
West TX Int.
64-16
4.0
50.3
41.9
1.9
ABM-1
CA Valley
58-10
7.1
52.4
29.6
9.0
Table 4. Commercial grades of phosphoric acid used.
Name
Acid Strength (percent)
Water Content (percent)
Polyphosphoric Acid
115
0
Superphosphoric Acid
105
0
Phosphoric Acid
85
15
Phosphoric Acid
75
25
Green Acid
50
50
Addition levels were 0.25, 0.5, and 1.0 percent normalized to 100-percent phosphoric acid. (For
example, in the case of 50-percent green acid, the actual weight of acid would be doubled.)
The samples were prepared by adding acid to the asphalt at 165 °C while mixing with a
mechanical stirrer running at 450 rpm. Mixing was continued for 20 min after addition. The
binder stiffness, (|G*|/Sin at 64 °C) was measured using AASHTO test method T315.
EFFECT OF ASPHALT TYPE
The results shown in figure 23 indicate the change in stiffness is asphalt dependent. Asphalt
AAK-1 showed the greatest stiffness increase while ABM-1 was hardly affected by PPA
addition.
δ
δ
23

Figure 23. Chart. Initial stiffness of SHRP reference binders modified with 115-percent
phosphoric acid.
EFFECT OF PHOSPHORIC ACID GRADE
The results for each of the SHRP asphalts are shown in figure 24 to figure 27. Note that the
stiffness scales on each chart are different. The stiffening effect was generally greater with the
green acid, possibly because it contains some very strong acidic impurities such as sulfuric and
hydrofluoric acids, which might be expected to increase the stiffening effect compared with
phosphoric acid, which is a relatively weak acid. The other grades of acid showed similar effects
with some minor differences. The test results indicate that any grade could be used to modify
asphalt although the green acid might cause corrosion problems and the more dilute grades might
cause foaming as the inherent water boils off on contact with the hot asphalt.
0
1
2
3
4
5
6
7
8
9
10
0.00 0.25 0.50 0.75 1.00
|G*|/Sin δ @ 64oC)
Polyphosphoric Acid %
AAD-1
AAM-1
AAK-1
ABM-1
24

Figure 24. Chart. Effect of phosphoric acid grade on the stiffness of asphalt AAD-1.
Figure 25. Chart. Effect of phosphoric acid grade on the stiffness of asphalt AAK-1.
0
1
2
3
4
5
6
0.00
0.25 0.50 0.75 1.00
(|G*|/Sinδ| @ 64
o
C)
Phosphoric Acid %
p
50% Green Acid
75% Acid
85% Acid
105% Superphosphoric Acid
115% Polyphosphoric Acid
0
2
4
6
8
10
12
0.00 0.25 0.50 0.75 1.00
(|G*|/Sinδ @ 64
o
C)
Phosphoric Acid %
50% Green Acid
75% Acid
85% Acid
105% Superphosphoric Acid
115% Polyphosphoric Acid
25

Figure 26. Chart. Effect of phosphoric acid grade on the stiffness of asphalt AAM-1.
Figure 27. Chart. Effect of phosphoric acid grade on the stiffness of asphalt ABM-1.
EFFECT OF TANK AGING AT 165 °C
The purpose of this test was to determine whether the stiffness of PPA-modified asphalts was
likely to increase if stored in a heated tank for extended periods of time. Asphalt in storage tanks
generally has a small exposed surface area to volume ratio, essentially an anaerobic condition.
To simulate this condition on a small scale, samples of the four SHRP reference binders were
placed in ¼-pint cans fitted with lever lids and oven aged at 165 °C. Stiffness was measured as
|G*|/Sin at 64 °C. Tests were run with all five grades of phosphoric acid and addition levels of
0.00
1.00
2.00
3.00
4.00
5.00
6.00
7.00
0.00 0.25 0.50 0.75 1.00
(|G*|/Sinδ @ 64
o
C)
Phosphoric Acid %
p
50% Green Acid
75% Acid
85% Acid
105% Superphosphoric Acid
115% Polyphosphoric Acid
0
0.5
1
1.5
2
2.5
3
0.00 0.25 0.50 0.75 1.00
(|G*|/Sinδ @ 64
o
C)
Phosphoric Acid %
p
50% Green Acid
75% Acid
85% Acid
105% Superphosphoric Acid
115% Polyphosphoric Acid
δ
26

0, 0.25, 0.5, and 1 percent. The results for all 20 of these combinations are given in the appendix
in table 16 through table 35. To simplify this report, only the case for 1-percent superphosphoric
acid is presented here in figure 28. The numerical data for this case are presented in table 5,
which include the control data for zero acid modification. All unmodified binders exhibited some
increase in stiffness except ABM-1, which remained almost unchanged. The modified binders all
increased in stiffness; asphalt AAK-1 showed the largest change. In this case, the unmodified
binder stiffness changed from 2.43 to 12.9, and the 1-percent acid modified material increased
from 8.59 to 43.05. A summary chart showing the case for 1-percent superphosphoric acid is
shown in table 5.
The numerical data are shown in the appendix.
Figure 28. Chart. Simulated tank aging of binders modified with 1 percent of 105-percent
phosphoric acid.
Table 5. Stiffness (|G*|/Sin ) of simulated tank-aged binders modified with 105-percent
phosphoric acid.
Hours
AAD-1
AAK-1
AAM-1
ABM-1
0-percent
Acid
1-percent
Acid
0-percent
Acid
1-percent
Acid
0-percent
Acid
1-percent
Acid
0-percent
Acid
1-percent
Acid
0
0.89
2.87
2.43
8.49
1.69
4.23
1.65
1.13
24
—
3.74
2.80
9.69
—
3.65
—
1.28
48
—
3.37
—
13.63
—
4.1
—
—
72
—
4.34
—
—
—
4.41
—
—
96
—
5.62
—
—
—
—
120
1.33
6.44
10.5
17.77
1.96
3.36
1.52
1.37
288
5.92
9.52
12.9
43.05
11.68
7.11
1.81
3.36
— Indicates not measured.
0
5
10
15
20
25
30
35
40
45
0 50 100 150 200 250 300
Stiffness |G*|/ Sinδ at 64degC
Hours @ 165 DegC
AAD-1
AAK-1
AAM-1
ABM-1
δ
27

CONCLUSIONS
The following conclusions can be drawn:
• The stiffening effect of phosphoric acid is asphalt dependent; AAK-1 showed the greatest
stiffness response. ABM-1 stiffness was hardly affected by acid modification. Both
AAD-1 and AAM-1 gave very similar stiffness values on modification with acid. For
these reference binders in these tests, no real correlation could be found between their
published properties
(5)
and their stiffness sensitivity to phosphoric acid modification. This
ranking is shown in table 6.
Table 6. Stiffness sensitivity of reference binders to PPA modification.
Origin
Grade
Stiffening
Rank
Asphaltenes
(percent)
Polar
Aromatics
(percent)
Napthenic
Aromatics
(percent)
Saturates
(percent)
AAD-1
CA Coastal
58-28
2
20.5
41.3
25.1
8.6
AAK-1
Venezuelan
64-22
1
20.1
41.8
30.0
5.1
AAM-1
West TX Int.
64-16
3
4.0
50.3
41.9
1.9
ABM-1
CA Valley
58-10
4
7.1
52.4
29.6
9.0
• There was some increase in stiffness after oven aging for at 165 °C, especially for asphalt
AAK-1. This suggests that the stiffness of asphalt like AAK-1 might increase if stored
molten in a tank for extended periods of time.
• Any grade of phosphoric acid can be used. The impurities in green acid may cause some
equipment corrosion.
28

CHAPTER 4. AGING
DOES PHOSPHORIC ACID CATALYZE ASPHALT OXIDATION IN HOT MIX
ASPHALT BINDERS?
Phosphoric acid is used as a blowing catalyst in producing asphalt for roofing; consequently,
fears have been expressed that its use as a binder modifier will cause premature aging of paving
asphalts. To test this concern, samples were modified with 105- and 115-percent phosphoric acid
and aged at 100 °C in the PAV under air pressure. Because phosphorus pentoxide has been used
as a blowing catalyst, it was included in the study.
Samples were stored in open ¼-pint cans. The level of acid used was 1 percent (calculated as
100-percent acid). The stiffness was measured as |G*|/Sin at 64 °C. The results are shown in
figure 29 to figure 32, and the numerical data are shown in the appendix in table 36 through
table 39.
To determine whether any stiffness change was due to oxidation or simple the result of exposure
to 100 °C temperature for 300 hours, the tests were repeated under nitrogen pressure instead of
air. Figure 33 to figure 36 show the data graphically; the numerical results are in table 40 through
table 43.
Figure 29. Chart. PAV aging of asphalt AAD-1 modified with 1-percent phosphoric acid at
100 °C under air.
δ
0
5
10
15
20
25
30
35
40
0 50 100 150 200 250 300
Stiffness(|G*|/SinδkPa at 64
o
C
Hours
Control
105%
115%
P2O5
Control
29

Figure 30. Chart. PAV aging of asphalt AAK-1 modified with 1-percent phosphoric acid at
100 °C under air.
Figure 31. Chart. PAV aging of asphalt AAM-1 modified with 1-percent phosphoric acid at
100 °C under air.
0
5
10
15
20
25
30
35
40
0 50 100 150 200
250 300
Stiffness(|G*|/SinδkPa at 64
o
C
Hours
Control
105%
115%
P2O5
0
5
10
15
20
25
30
35
40
0 50 100 150 200 250 300
Stiffness(|G*|/SinδkPa at 64
o
C
Hours
Control
105%
115%
P2O5
30

Figure 32. Chart. PAV aging of asphalt ABM-1 modified with 1-percent phosphoric acid at
100 °C under air.
Figure 33. Chart. PAV aging of asphalt AAD-1 modified with 1-percent phosphoric acid at
100 °C under nitrogen.
0
5
10
15
20
25
30
35
40
0 50 100 150 200
250 300
Stiffness(|G*|/SinδkPa at 64
o
C
Hours
Control
105%
115%
P2O5
0
5
10
15
20
25
30
35
40
0 50
100
150 200
250 300
Stiffness(|G*|/SinδkPa at 64
o
C
Hours
Control
50% Acid
85% Acid
115% Acid
31

Figure 34. Chart. PAV aging of asphalt AAK-1 modified with 1-percent phosphoric acid at
100 °C under nitrogen.
Figure 35. Chart. PAV aging of asphalt AAM-1 modified with 1-percent phosphoric acid at
100 °C under nitrogen.
0
5
10
15
20
25
30
35
40
0 50 100 150
200 250 300
Stiffness(|G*|/SinδkPa at 64
o
C
Hours
Control
50%
85%
115%
0
5
10
15
20
25
30
35
40
0 50 100 150 200 250 300
Stiffness(|G*|/SinδkPa at 64
o
C
Hours
Control
50% Acid
85% Acid
115% Acid
32

Figure 36. Chart. PAV aging of asphalt ABM-1 modified with 1-percent phosphoric acid, at
100 °C under nitrogen.
CONCLUSIONS
• Except for binder AAK-1, the phosphoric acid modified binders aged less than the
unmodified controls.
• With the exception of AAK-1, phosphorus pentoxide did not cause increased stiffness
compared to acids.
• The increase in stiffness of the samples aged under nitrogen was much less than those
aged under air pressure. This suggests that any increase in stiffness is due to asphalt
oxidation rather than chemical reaction of the binders with phosphoric acid.
0
5
10
15
20
25
30
35
40
0 50 100 150 200 250 300
Stiffness(|G*|/SinδkPa at 64
o
C
Hours
Control
50%
85%
115%
33
CHAPTER 5. LIME AND LIMESTONE AGGREGATES
LIME
When lime (calcium hydroxide) is used as an antistrip additive in asphalt binders, it is common
to use 1 percent of lime based on the weight of aggregate. Concerns have been expressed that
any phosphoric acid in the binder would react with the lime so that it would no longer be
effective as an antistrip additive.
The chemistry of this reaction is given in the following equation:
Stoichimetrically, 74 lb of lime would react with 98 lb of phosphoric acid yielding 172 lb of
calcium phosphate. If the mix contains 1 percent of lime based on the aggregate and 1 percent of
phosphoric acid based on the binder content, then there is a large excess of lime, about 25 times.
To determine whether or not the phosphoric acid in the binder would react with lime (calcium
hydroxide), six different phosphoric acid Modified PG 64 binders were used; two from Citgo®,
two from HollyFrontier®, one from Lion Oil, and one from BP Whiting. The binders were
modified with 1-percent phosphoric acid and then mixed with 20-percent lime by weight of the
asphalt at 165 °C using a propeller stirrer to blend the lime into the hot asphalt. To account for
any possible reactions of lime with the binders themselves, samples of the unmodified binders
were also treated with 20-percent lime.
The lime was removed by solvent extraction, the lime was filtered out, and the binder recovered
by evaporation of the solvent. All the binders, both modified and unmodified, were put through
the same extraction and recovery process.
The results given in figure 37 show the following:
• The PG of phosphoric acid-modified binders (black bars) was different for each binder
and considerably higher than that of the unmodified binders.
• The PG of the recovered unmodified binders (purple bars) was slightly lower than the
original.
• The PG of the recovered binders treated with lime alone (green bars) was lower than the
original, particularly so with the binders from HollyFrontier®.
• The PG of the phosphoric acid treated binders after lime treatment and recovery to
remove the lime (red bars) was lower than the phosphoric acid-modified binders and was
close to the PG of the original binders.
Ca(OH)
2
+ H
3
PO
4
= CaHPO
4
.2H2O
35

Figure 37. Chart. Performance grades of binders after treatment with lime.
This study clearly shows that lime reacts with the phosphoric acid in a phosphoric acid-modified
binder. To what extend this would occur in a mix is unknown.The stiffening effect of the acid is
clearly lost after treatment with lime if the lime is removed during the binder recovery process. It
is a complex issue because as figure 38 shows, the addition of an alkali like lime sometimes
causes an increase in binder stiffness (PG). One might argue that if the mix is already treated
with lime, then the addition of phosphoric acid to the binder might be superfluous.
52
58
64
70
76
82
CITGO #1
CITGO #2
BP Whiting Lion Oil Holly Oil #1 Holly Oil #2
degree C
Asphalt ID
PG of Recovered Binders after Lime Treatment
Original Binder Original Binder-Recovered Lime Treated Binder-Recovered Original Binder + PPA PPA + Lime Treated Binder-Recovered
36

Figure 38. Chart. Effect of lime content on asphalt stiffness.
As part of another research effort, the flow numbers of gyratory specimens containing lime,
phosphoric acid, and SBS polymer were measured using AASHTO test method TP-79 “Standard
Method of Test for Determining the Dynamic Modulus and Flow Number for Asphalt Mixtures
using the Asphalt Mixture Performance Tester (AMPT).” The aggregate in these specimens was
diabase, and the asphalts were grade PG 64 from Lion Oil (binder B) and HollyFrontier®
(binder C). The results are given in figure 39 and figure 40.
Figure 39. Chart. Flow number for the mixture modified with binder from Lion Oil.
67
68
69
70
71
72
73
0 0.25 0.5 0.75 1
Performance Grade
Lime %
Citgo
BP Whiting
Lion Oil
0
200
400
600
800
1000
1200
1400
1600
1800
2000
Control 2%PPA 2%SBS 1.5%SBS+0.5%PPA
Flow Number (cycle)
No Lime
1% Lime
37

Figure 40. Chart. Flow number for the mixture modified with binder from HollyFrontier®
asphalt.
Lime addition to the HollyFrontier® asphalt samples showed no increase in flow number for the
control, and the Lion Oil showed a modest increase. The addition of 2-percent phosphoric acid (a
very high level of modification not generally used in practice) to the lime-treated samples
showed a slight increase for the HollyFrontier® asphalt sample and a slight decrease for the Lion
Oil binder. Modification with 2-percent SBS polymer showed a significant increase in flow
number as would be expected. The addition of lime to the SBS modified samples appears to have
a synergisitc effect, with a substantial increase in flow number especially in the case of the
HollyFrontier® asphalt binder. This synergy appeared to be almost totally absent when the
binder was modified with 1.5-percent SBS and 0.5-percent phosphoric acid.
LIMESTONE
This experiment was designed to determine whether phosphoric acid in the binder would react
with basic aggregates, e.g., limestone (primarily calcium carbonate). Several HMA samples were
made with different limestone aggregates. The asphalt was recovered, tested for the high
temperature PG, and the phosphorus content determined. The asphalt type and limestone
aggregate sources were varied to see the effect.
Three asphalts from different sources were used: Citgo® (B6362), BP Whiting (B6364), and
Lion Oil (B6367). Three aggregates were used: Maryland limestone (designated as MD) and two
limestone samples from New York State Department of Transportation (NYSDOT) (designated
NY3 and NY4).
The initial high temperature performance grade was 64 °C for all three asphalts. The asphalts
were modified with 1-percent phosphoric acid by weight of the binder and DSR measurements of
the original and RTFOT samples were made. The resulting high temperature PG of the
phosphoric acid modified asphalts was 70 °C.
Loose mix was made with both the control and the phosphoric acid-modified asphalt for each
aggregate. This resulted in 18 loose mix samples. All of the loose mix samples were short-term
0
200
400
600
800
1000
1200
1400
1600
1800
2000
Control
2%PPA 2%SBS
1.5%SBS+0.5%PPA
Flow Number (cycle)
No Lime
1% Lime
38

oven aged at 135 °C for 4 h. The job mix formula for NY3 and NY4 aggregate was provided by
NYSDOT and is summarized in table 7.
Table 7. Limestone mix designs.
Aggregate
MD
NY3
NY4
Percent
Percent
Percent
Fine
56
50
37
Middle
—
—
31
Coarse
44
50
32
Asphalt
5.5
6.5
5.4
— Indicates not applicable.
The loose mix was extracted using AASHTO: T164 “Quantitative Extraction of Asphalt Binder
from Hot-Mix Asphalt (HMA)” and recovered using AASHTO: T170 “Recovery of Asphalt
from Solution by Abson Method.” The extraction solvent was trichloroethylene (TCE). Every
attempt was made to minimize the amount of aging that took place during the procedures by
following the times and temperatures specified in the methods. The recovered binders were
analyzed by Fourier transform infrared spectroscopy to ensure that no residual TCE solvent was
present. DSR measurements were made, and the high temperature and continuous high
temperature PG (using the RTFOT criteria of 2.2 kPa) was calculated. All of the recovered
binder samples were analyzed for the presence of phosphoric acid with XRF as described earlier
in this report.
The results summarized in table 8, show that all the recovered phosphoric acid-modified binders
contained phosphorus.
Table 8. Phosphorus in recovered asphalt binders.
Phosphorus Present?
Binder
Only
Recovered
NY4
NY3
MD
CITGO®
Unmodified
1% phosphoric acid
no
no
no
no
(B-6362)
yes
yes
yes
yes
BP Whiting
Unmodified
1% phosphoric acid
no
no
no
no
(B-6364)
yes
yes
yes
yes
Lion Oil
Unmodified
1% phosphoric acid
no
no
no
no
(B-6367)
yes
yes
yes
yes
While there was a slight increase in the continuous grade temperature in some of the modified
binders recovered from the limestone mixes, this was less than 6 °C, indicating no change in the
PG. The binder grade did not decrease in any of the samples in contrast to the case with lime.
Figure 41 shows a plot of the data grouped by aggregate type; the DSR results are in table 9.
39

Figure 41. Chart. PGs of phosphoric acid-modified binders recovered from limestone
mixes.
Table 9. High temperature PGs of phosphoric acid-modified binders recovered from
limestone mixes.
RTFOT
Binder
PG
Recovered Binder
Aggregate type
NY4
NY3
MD
CITGO®
PG
64
70
70
70
Continuous PG
66.2
70.7
70.0
72.0
CITGO® and
1-percent PPA
PG
70
70
70
70
Continuous PG
74.8
71.0
70.9
71.3
BP Whiting
PG
64
64
64
70
Continuous PG
66.0
69.2
69.6
71.9
BP Whiting and
1-percent phosphoric
acid
PG
70
70
70
76
Continuous PG 73.0 72.2 71.1 77.1
Lion Oil
PG
64
64
64
70
Continuous PG
66.9
68.5
68.6
71
Lion Oil and
1-percent phosphoric
acid
PG
70
70
70
70
Continuous PG 70.8 70.4 69.7 73.1
58
64
70
76
82
NY4
NY3
MD
Performance Grade
deg C
Aggregate Type
CITGO
CITGO & 1% PPA
BP Whiting
BP Whiting & 1% PPA
Lion Oil
Lion Oil & 1% PPA
40
CONCLUSIONS
• Lime (calcium hydroxide) in HMA can react with the phosphoric acid in phosphoric
acid-modified binders.
• Limestone aggregates in HMA do not readily react with the phosphoric acid in
phosphoric acid-modified binders.
41

CHAPTER 6. MOISTURE
EFFECT OF WATER ON ASPHALT MASTICS WITH AND WITHOUT PHOSPHORIC
ACID
Phosphoric acid is a very hydrophilic material. Some concerns were expressed that its use may
negatively affect the moisture resistance of asphalt mixes. Tests were performed that involved
immersing samples of mastics and binders in water for extended periods of time. This condition
is rarely found in practice, and therefore represents an extreme case and should not be interpreted
as an indication of what would happen on a real highway.
To measure the moisture resistance, mastics containing 50-percent aggregate fines (sand,
diabase, gravel, and montmorillonite) were cast into silicone rubber molds in the shape of either
direct tension dog bones or Bending Beam Rhometer (BBR) samples. (These were the only
silicon rubber molds available.) Montmorillonite was used because it is water-sensitive
expansive clay. The presence of such materials can have a deleterious effect on asphalt
pavements. The asphalt binder used (B6317) was supplied by Citgo® and was a blend of
60-percent Bachaquero and 40-percent Menemota 21.
The mastic samples were weighed and then immersed in a water bath at 7 °C. At intervals over
the next 105 days, the dog bones were dried with a paper towel, weighed, and the amount of
water absorbed calculated. The results are shown in the figure 42 through figure 45. The effect
on the stiffness of soaked specimens of Citgo® asphalt are shown in figure 46.
Figure 42. Chart. Plot of moisture absorption of Citgo® 50-percent asphalt/sand mastic
modified with 115-percent phosphoric acid.
-0.10
0.00
0.10
0.20
0.30
0.40
0.50
0.60
0.70
0 20 40 60 80 100
Water Absorption %
Days In Water
Control
Control
0.5% PPA
0.5% PPA
1.0% PPA
1.0% PPA
1.5% PPA
1.5% PPA
2.0% PPA
2.0% PPA
43

Figure 43. Chart. Plot of moisture absorption of Citgo® 50-percent asphalt/diabase mastic
modified with 115-percent phosphoric acid.
Figure 44. Chart. Moisture absorption of Venezuelan 50-percent asphalt/gravel mastic
modified with 115-percent phosphoric acid.
-0.10
0.00
0.10
0.20
0.30
0.40
0.50
0.60
0.70
0 20 40 60 80 100
Water Absorption %
Days in Water
Control
Control
0.5% PPA
0.5% PPA
1.0% PPA
1.0% PPA
1.5% PPA
1.5% PPA
2.0% PPA
2.0% PPA
-0.10
0.00
0.10
0.20
0.30
0.40
0.50
0.60
0.70
0 20 40 60 80 100
Water Absorption %
Days in Water
g p
Control
Control
0.5% PPA
0.5% PPA
1.0% PPA
1.0% PPA
1.5% PPA
1.5% PPA
2.0% PPA
2.0% PPA
`
44

Figure 45. Chart. Moisture absorption of Citgo® 50-percent asphalt/montmorillonite
mastic modified with 115-percent phosphoric acid.
Conclusions
• The amount of water absorbed by the control samples after 105 days was independent of
the aggregate. Most of the mastics absorbed 0.2 to 0.3 percent. The exception was
montmorillonite, which was expected to be water sensitive. It absorbed 105 percent
water.
• The water absorption of the mastics tended to increase with increasing acid levels
although the differences are rather small. Again the exception was montmorillonite,
which showed the opposite effect; moisture absorption decreased with increasing acid
levels.
• The most significant effect of phosphoric acid modification was with the mastics
containing montmorillonite clay, which is well known for its water absorption properties.
The unmodified control samples absorbed 105 percent water over the 105-day test period
whereas the samples containing phosphoric acid absorbed only 3 to 4 percent water. This
is clearly demonstrated in figure 46 with asphalt from the BP Whiting Refinery.
0.00
0.50
1.00
1.50
2.00
2.50
3.00
3.50
4.00
4.50
5.00
0 20 40 60
80
100
Water Absorption %
Days in Water
Control
Control
0.5% PPA
0.5% PPA
1% PPA
1% PPA
1.5% PPA
1.5% PPA
2% PPA
2% PPA
45

Figure 46. Chart. Fifty-percent montmorillonite asphalt binder mastic after water
immersion for 105 days.
EFFECT OF WATER ON NEAT ASPHALT BINDERS
Similar tests to those described above were carried out using BBR beams of neat Venezuelan
asphalt (B6317) modified with 115-percent phosphoric acid at levels up to 4 percent. The results
are shown in figure 47 indicate the following:
Most samples, including the unmodified control, lost 0.1- to 0.25-percent weight almost
immediately. These samples subsequently gained weight and ultimately had an overall weight
gains. This suggests the possibility that water-soluble materials are initially being extracted from
the asphalt itself; however, no attempt was made to identify the nature of this material.
The control, 0.5- and 1-percent modified samples all showed approximately the same level of
increase in weight after 126 days of immersion in water. This weight gain was between 0 and
0.1 percent.
Long immersions and increasing phosphoric acid levels resulted in higher levels of water
absorption.
46

Figure 47. Chart. Plot of water absorption of Venezuelan asphalt beams modified with
115-percent phosphoric acid.
The effect of this water absorption on the stiffness of the Citgo® asphalt was examined; the
results are shown in figure 48.
Figure 48. Chart. Plot of stiffness of phosphoric acid modified Citgo® asphalt after 245
days of water immersion.
As mentioned earlier, phosphoric acid is a very hydrophilic material; it is very water soluble. To
determine whether there is a risk of rain leaching phosphoric acid from a pavement, a number of
soaking tests were devised. Because there is no standard test to determine leachates from HMA
pavments, a test protocol was established for comparison purposes. The amount of phosphoric
acid extracted from a pavement on a daily basis is likely to be below the limits of detection. To
-0.20
0.00
0.20
0.40
0.60
0.80
1.00
1.20
1.40
1.60
0 25 50 75 100 125 150 175 200 225
% Water Absorption
Days Water Immersion 7 degC
Control
0.50%
1.00%
1.50%
2.00%
3.00%
4.00%
0
5
10
15
20
25
30
35
40
45
0 1 2 3 4
|G*|/Sin Delta 70 Deg C KPa
Polyphosphoric Acid %
Original
Soaked
47
determine whether this could become an issue over a period of time, the following procedure was
used to test the likelihood of this event.
The test consisted of immersing gyratory specimens in distilled water contained in clean high
density polyethylene (HDPE) buckets. Periodically, the phosphate content of the water over
245 days was measured. This is an extreme case—the specimens were completely immersed in
water whereas pavements rarely are.
Gyratory specimens 6 by 4.5 inches were made using the standard TFHRC Accelerated Loading
Facility dense coarse graded 12.5-mm nominal maximum aggregate size Superpave mix with a
5-percent binder content. The aggregate was a diabase. Each core contained approximately
4,885 g of aggregate and 258 g of binder (Citgo® binder referenced earlier). The binder was
modified with levels of PPA from 0 to 4 percent. The cores were placed in new clean HDPE
buckets to which 2.5 L of distilled water were added; this amount was sufficient to cover the
specimens. The phosphoric acid content of the water was measured over a period of 245 days
using ion exchange chromatography (Dionex™ ICS-2000). The calculations were made
assuming the phosphate was present in the water as orthophosphoric acid.
To determine whether there was any asphalt or aggregate dependency, a second suite of samples
was tested. In this case, two asphalt binders were used with two different aggregates, namely a
Lion Oil (B6367) and BP Whiting (B6364) binder and diabase and Georgia granite aggregates.
To gain some insight on the effect of air void content, the samples were tested as both gyratory
specimens and uncompacted loose mix. Six levels of PPA modification were chosen; 0, 0.5,
0.75, 1.0, 1.5, and 3 percent.
The results are presented graphically in figure 49 through figure 52, and the percent of the added
phosphoric acid extracted is given in table 10, which shows that only a very small percent of the
phosphoric acid is extracted after 245 days in water.
The amount of phosphate leached from the gyratory specimens made with diabase or granite
aggregates was the same for both the Lion Oil and BP Whiting binders although extraction levels
for the granite specimens was significantly higher, some being leached even at a phosphoric acid
modification level as low as 0.5 percent. As would be expected, more phosphate was leached
from the loose mixes compared with the compacted gyratory specimens. Slightly more
phosphate was leached from the loose mix made with the Lion Oil binder. The results for the
loose mixes are presented in figure 53 and figure 54.
48

Figure 49. Chart. Plot of phosphate extracted from Lion Oil binder diabase aggregate
gyratory specimen.
Figure 50. Chart. Plot of phosphate extracted from BP Whiting binder diabase aggregate
gyratory specimen.
0
1
2
3
4
5
6
0
50
100 150
200
250
Phosphate Extracted ppm
Days Water Immersion
Control
0.5% PPA
0.75% PPA
1.0% PPA
1.5% PPA
3.0% PPA
49

Figure 51. Chart. Plot of phosphate extracted from Lion Oil binder granite aggregate
gyratory specimen.
Figure 52. Chart. Plot of phosphate extracted from BP Whiting binder granite aggregate
gyratory specimen.
0
5
10
15
20
25
30
35
40
0 50 100 150 200 250
Phosphate Extracted ppm
Days Water Immersion
Control
0.5% PPA
0.75% PPA
1.0% PPA
1.5% PPA
3.0% PPA
50

Table 10. Percentage of the added phosphoric acid extracted after 245 days of immersion in
water.
PPA
Percent
B6317/
Diabase
Lion Oil/
Diabase
BP/
Diabase
Lion Oil/
Granite
BP
Granite
Lion Oil/
Diabase
BP/
Diabase
Gyratory
Gyratory
Gyratory
Gyratory
Gyratory
Loose Mix
Loose Mix
0
0
0
0
0
0
0
0
0.5
0
0
0
0.39
0.39
0.85
0
0.75
0
0
0
0.31
0.31
—
0
1.0
0.14
0
0
0.39
0.31
0.66
0
1.5
0.14
0
0.05
0.36
0.36
0.72
0.18
2.0
0.28
0
—
—
—
—
—
3.0
0.78
0.04
0.06
0.44
0.93
0.54
0.39
4.0
1.63
—
—
—
—
—
—
— Indicates not measured
Figure 53. Chart. Plot of phosphate extracted from Lion Oil binder diabase aggregate loose
mix.
51

Figure 54. Chart. Plot of phosphate extracted from BP Whiting binder diabase aggregate
loose mix.
Conclusions
• Mastics binders and mixes modified with phosphoric acid soaked in water absorbed more
moisture than the unmodified controls except for the mastics containing montmorillonite.
• The absorption increased with increasing phosphoric acid levels.
• Some limited sensitivity in the gyratory specimens to aggregate type was found but the
evidence suggests that the extraction rate is independent of the binder type.
• The effect of water soaking on asphalt binder moisture content (figure 47) and stiffness
(figure 48) as well as the data for mastics (figure 42 through figure 45) suggest that
phosphoric acid modification levels above 0.5 to 0.75 percent or so might negatively
influence the moisture resistance of the pavement.
• The amount of phosphoric acid leached from compacted gyratory specimens even after
the extreme case of 245 days soaking in water was very small.
• The increased leaching from uncompacted mixes suggests some consideration might be
given to the leaching that might occur if a phosphoric acid modified binder were used in a
porous mix such as an open graded friction course for example.
EFFECT OF PHOSPHORIC ACID MODIFICATION IN THE USE OF ANTISTRIP
ADDITIVES
One of the preconceived notions on the use of phosphoric acid as an asphalt binder was that it
could not be used with liquid amine antistrip additives because it is an acid and would react with
the basic components in the additives. It was also proposed that nonamine liquid antistrip
additives, for example 2-ethylhexyl phosphate, could be used because they would not react
chemically with the phosphoric acid.
0
5
10
15
20
25
30
35
0 50 100 150 200 250
Phosphate Extracted ppm
Days Water Immersion
Control
0.5% PPA
0.75% PPA
1.0% PPA
1.5% PPa
3.0% PPA
52

To confirm that phosphoric acid reacts chemically with liquid amine antistrip additives, samples
were dissolved in ethanol (they are not soluble in water) and titrated with phosphoric acid using a
standard acid/base indicator. One g of AD-HERE® LOF 65-00 was found to be equivalent to
0.49 g PPA and AD-HERE® LA-2 to 0.57 g PPA. If the binder contains 0.5 percent of antistrip
additive and 1 percent of PPA, then the PPA is in excess, with about 25 percent being neutralized
by the amine.
In this study, a number of commercially available liquid amine antistrip additives were evaluated
with several different aggregates and binders to test the validity of these concerns and the effect
that phosphoric acid modification would have on moisture resistance of HMA pavements.
The antistrip additives were the following:
• ArrMaz®, AD-HERE® LOF65-00 AD-HERE® LA2.
• Innophos: Innovalt®-W (2-ethyl-hexyl phosphate).
• Chemical Lime Company: Lime.
The aggregates used were sandstone (Keystone Aggregates, MD), limestone (H.B. Mellot, MD),
and granite from Georgia (unknown origin). The binder was supplied by Citgo®.
The stripping tests were carried out using the Hamburg wheel tracker. The water temperature
was 50 °C and the pass/fail criterion 20,000 cycles with a maximum rut depth of 12.5 mm.
Results are shown in figure 55 through figure 69.
Figure 55. Chart. Hamburg rut test of Citgo® asphalt sandstone aggregate.
0
5
10
15
20
25
30
35
0 2000 4000 6000 8000 10000 12000 14000 16000 18000 20000
Rut Depth mm
Passes
Control
Control
1% PPA
1% PPA
3%PPA
3% PPA
53

Figure 56. Chart. Hamburg rut test of Citgo® asphalt limestone aggregate.
Figure 57. Chart. Hamburg rut test of Citgo® asphalt granite aggregate.
0
5
10
15
20
25
30
35
0 2000 4000 6000 8000 10000 12000 14000 16000 18000 20000
Rut Depth mm
Passes
Control
Control
1% PPA
1% PPA
0
5
10
15
20
25
30
35
0 2000 4000 6000 8000 10000 12000 14000 16000 18000 20000
Rut Depth mm
Passes
Control
Control
1% PPA
1% PPA
54

Figure 58. Chart. Hamburg rut test of Citgo® asphalt lime-treated sandstone aggregate.
Figure 59. Chart. Hamburg rut test of Citgo® asphalt lime-treated limestone aggregate.
0
5
10
15
20
25
30
35
0 2000 4000 6000 8000 10000 12000 14000 16000 18000 20000
Rut Depth mm
Passes
Control
1% Lime
1% Lime 0.5% PPA
1% Lime 3% PPA
0
5
10
15
20
25
30
35
0 2000 4000 6000 8000 10000 12000 14000 16000 18000 20000
Rut Depth mm
Passes
Control
Control
1% Lime
1% Lime
1% Lime 1% PPA
1% Lime 1% PPA
55

Figure 60. Chart. Hamburg rut test of Citgo® asphalt lime-treated granite aggregate.
Figure 61. Chart. Hamburg rut test of Citgo® asphalt AD-HERE® LA-2 antistrip-treated
sandstone aggregate.
0
5
10
15
20
25
30
35
0 2000 4000 6000 8000 10000 12000 14000 16000 18000 20000
Rut Depth mm
Passes
Control
Control
1% Lime
1% Lime
1% Lime 1% PPA
1% Lime 1% PPA
0
5
10
15
20
25
30
35
0
2000
4000 6000 8000
10000
12000 14000
16000
18000 20000
Rut Depth mm
Passes
Control
Control
0.5% LA-2
0.5% LA-2
0.5% LA-2 1% PPA
0.5% LA-2 1% PPA
56

Figure 62. Chart. Hamburg rut test of Citgo® asphalt AD-HERE® LA-2 antistrip-treated
limestone aggregate.
Figure 63. Chart. Hamburg rut test of Citgo® asphalt AD-HERE® LA-2 antistrip-treated
granite aggregate.
0
5
10
15
20
25
30
35
0 2000 4000 6000 8000 10000 12000 14000 16000 18000 20000
Rut Depth mm
Passes
0.5% LA-2
0.5% LA-2
0.5% LA-2 1% PPA
0.5% LA-2 1% PPA
Control
Control
0
5
10
15
20
25
30
35
0 2000 4000 6000 8000 10000 12000 14000 16000 18000 20000
Rut Depth mm
Passes
Control
Control
0.5% LA-2
0.5% LA-2
57

Figure 64. Chart. Hamburg rut test of Citgo® asphalt AD-HERE® LOF 65-00 antistrip-
treated sandstone aggregate.
Figure 65. Chart. Hamburg rut test of Citgo® asphalt AD-HERE® LOF 65-00 antistrip-
treated limestone aggregate.
0
5
10
15
20
25
30
35
0 2000 4000 6000 8000 10000 12000 14000 16000 18000 20000
Rut Depth mm
Passes
Control
Control
0.5% LOF 65-00
0.5% LOF 65-00
0.5% LOF65-00 1% PPA
0.5% LOF 65-00 1% PPA
0
5
10
15
20
25
30
35
0 2000 4000 6000 8000 10000 12000 14000 16000 18000 20000
Rut Depth mm
Passes
0.5% LOF 65-00
0.5% LOF 65-00
0.5% LOF 65-00 1% PPA
0.5% LOF 65-00 1% PPA
Control
Control
58

Figure 66. Chart. Hamburg rut test of Citgo® asphalt AD-HERE® LOF 65-00 antistrip-
treated granite aggregate.
Figure 67. Chart. Hamburg rut test of Citgo® asphalt Innovalt®-W antistrip-treated
sandstone aggregate.
0
5
10
15
20
25
30
35
0 2000 4000 6000 8000 10000 12000 14000 16000 18000 20000
Rut Depth mm
Passes
Control
Control
0.5% LOF65-00
0.5% LOF 65-00
0.5% LOF65-00 1% PPA
0.5% LOF65-00 1% PPA
0
5
10
15
20
25
30
35
0 2000 4000 6000 8000 10000 12000 14000 16000 18000 20000
Rut Depth mm
Passes
Control
Control
0.5% Innovalt-W
0.5% Innovalt-W
0.5% Innovalt-W 1% PPA
0.5% Innovalt-W 1% PPA
59

Figure 68. Chart. Hamburg rut test of Citgo® asphalt Innovalt®-W antistrip-treated
limestone aggregate.
Figure 69. Chart. Hamburg rut test of Citgo® asphalt Innovalt®-W antistrip-treated
granite aggregate.
The data are summarized table 11. The results are compared with the control for each aggregate.
The results are the average of the duplicate specimens that were tested. Bold indicates the
samples performed better than the control; those in italic were worse than the control.
0
5
10
15
20
25
30
35
0 2000 4000 6000 8000 10000 12000 14000 16000 18000 20000
Rut Depth mm
Passes
0.5% Innovalt-W
0.5% Innovalt-W
0.5% Innovalt-W+ 1% PPA
0.5% Innovalt-W+ 1% PPA
Control
Control
0
5
10
15
20
25
30
35
0 2000 4000 6000 8000 10000 12000 14000 16000 18000 20000
Rut Depth mm
Passes
Control
Control
0.5% Innovalt-W
0.5% Innovalt-W
0.5% Innovalt-W 1% PPA
0.5% Innovalt-W 1% PPA
60

Table 11. Summary of Hamburg rut testing results with antistrip additives.
Aggregate
Additive
Cycles to
12.5 mm
Failure
Cycles
Depth at 20,000
Cycles mm
Sandstone
Control
12,500
—
29
1 Percent Phosphoric Acid
9,500
14,300
—
3 Percent Phosphoric Acid
14,550
—
19
AD-HERE® LA-2
14,350
—
24
AD-HERE® LA-2 + 1 Percent Phosphoric Acid
8,700
13,000
—
AD-HERE® LOF 65-00
15,150
—
22
AD-HERE® LOF 65-00 + 1 Percent Phosphoric Acid
17,300
—
18
1 Percent Lime
—
—
10
1Percent Lime+0.5 percent Phosphoric Acid
—
—
12
1 percent Lime+3 percent Phosphoric Acid
—
—
12
Innovalt®-W
18,200
—
14
Innovalt®-W+1 Percent Phosphoric Acid
9,300
13,200
—
Limestone
Control
9,200
11,800
—
1 Percent PPA
5,800
9,050
—
AD-HERE® LA-2
10,600
14,400
—
AD-HERE® LA-2+1% Phosphoric Acid
6,100
9,700
—
AD-HERE® LOF 65-00
11,250
14,650
—
AD-HERE® LOF 65-00 + 1 percent Phosphoric Acid
6,900
10,100
—
1 percent Lime
17,000
—
19
1 percent Lime+0.5 percent Phosphoric Acid
14,700
—
21
Innovalt®-W
10,350
16,550
—
Innovalt®-W+1% Phosphoric Acid
11,150
15,450
—
Granite
Control
17,450
—
17
1 Percent Phosphoric Acid
10,250
14,250
—
AD-HERE® LA-2
—
—
9
AD-HERE® LA-2 + 1Percent Phosphoric Acid
—
—
7
AD-HERE® LOF 65-00
—
—
9
AD-HERE® LOF 65-00 + 1 Percent Phosphoric Acid
—
—
7
1 Percent Lime
—
—
5
1 Percent Lime + 0.5 Percent Phosphoric Acid
—
—
6
Innovalt®-W
—
—
8
Innovalt®-W+1 Percent Phosphoric Acid
—
—
10
Bold indicates sample performed better than the control sample
Italic indicates sample performed worse than the control sample
— Indicates not applicable
Conclusions
• The moisture resistance was worse with PPA modification for all three aggregates, with
the exception of the 3-percent case with sandstone. This was likely the result of the high
level of modification stiffening the asphalt.
• The enhanced performance of antistrip additive AD-HERE® LA-2 was worse with
phosphoric acid for sandstone and limestone but was not affected with the granite
aggregate.
61
• The enhanced performance of antistrip additive AD-HERE® LOF 65-00 with phosphoric
acid was not affected in the case of limestone (where it actually showed some
improvement) and granite but was worse in the limestone samples.
• Lime performed well with all three aggregates and was not affected by phosphoric acid
modification.
• The enhanced performance of Innovalt®-W, the nonamine phosphate ester antistrip
additive, was worse with phosphoric acid modification for sandstone but was unaffected
in the limestone and granite samples.
• All the antistrip additives performed very well with granite aggregate, and none were
affected by phosphoric acid modification.
62
CHAPTER 7. SUMMARY OF CONCLUSIONS
The following summarizes the conclusions of this study:
• The phosphoric acid content of binders can be readily measured using XRF, and from the
phosphorus content, a presumed level of phosphoric acid can be calculated.
• The addition of phosphoric acid to asphalt binders causes an increase in the heptane
insoluble fraction, which is not necessarily accompanied by a corresponding increase in
binder stiffness. The phosphorus from the acid all ends up in the heptane insoluble phase.
• The stiffening effect of phosphoric acid is asphalt dependent.
• Any grade of phosphoric acid can be used.
• Phosphoric acid does not appear to cause increased binder aging except in the binder
AAK-1 used in the study.
• Phosphoric acid in asphalt binders reacts with lime (calcium hydroxide).
• Phosphoric acid in asphalt binders does not readily react with limestone aggregates.
• Phosphoric acid is not readily leached from HMA mixes although some consideration
might be given to the possible environmental impact of very high levels of modification.
• According to the Hamburg test results, phosphoric acid can negatively affect the stripping
of asphalt mixes. It may also negate the effect of some liquid amine antistrip additives. It
works very well with lime-treated aggregates.
63
APPENDIX
IATROSCAN® TEST METHOD FOR SARA ANALYSIS OF ASPHALT BINDERS
The heavy metals (typically vanadium and nickel) present in the asphaltene portion of asphalt
binders have a tendency to contaminate the silica coating on the chromatographic rods. For this
reason, the asphaltenes are first separated by extracting the binder with n-heptane and removing
the insoluble asphaltenes by filtration. The n-heptane soluble portion is then absorbed on
5-micron silica-gel coated glass rods (Chromarods®) and fractionated by upward elution using
specific solvent types, development methods, and duration. The three separated fractions are then
burned from the rods using flame ionized detection (FID). As the materials burn the ionic
combustion products can be detected by a FID system. The FID system provides specific
response to organic compounds; therefore, three chromatographic fractions are separated and
identified as resins, cyclics, and saturates. These, together with asphaltenes, comprise the four
generic fractions found in asphalt. The FID system provides specific response to compounds
containing nitrogen and or halogens.
Apparatus
The following apparatus is used to conduct the test:
• Iatroscan® TH-10 hydrocarbon analyzer.
• Utilities—110-volt AC, compressed air (dry), compressed hydrogen, drying oven.
• Flasks—250-mL Erlenmeyer with ground-glass joint
• Condensers—400-mm type with ground-glass joint
• Filtering Apparatus—47 mm, Millipore all glass.
• Squeeze Bottle—pint size.
• Forceps—fine to medium pointed.
• Analytical Balance.
• Filter Disc—Whatman® GF/C microfiber 47 mm.
• Magnetic-Stirrer.
• Hot Plate—equipped with regulator.
• Reagent Bottles—8-oz amber glass with ground-glass stopper.
• Whatman® Chromatographic Paper ICHR (cat no 3001917) 46 cm by 570 cm.
• Glass Solvent Tanks, 1.5 by 7 inches.
• Reagents.
o n-Heptane—99.0 min. mol% (pure grade).
o n-Pentane—HPLC grade.
o Toluene—HPLC grade.
o Chloroform—HPLC grade.
Asphaltene/Material Separation
• Asphaltenes—The asphaltene fraction is obtained in accordance with ASTM D3279
Standard Test Method for the n-Heptane Insoluble Fraction.
65

• Maltenes—The maltene fraction (resins, cyclics, saturates) is contained in the n-heptane
filtrate after asphaltene extraction.
Iatroscan® TH-10 Procedure
Sample Preparation
During the asphaltene oven drying period, obtain the volume of filtrate by pouring it into a
graduated cylinder. Note this volume because it will be needed to calculate the maltene
concentration. Pour n-heptane filtrate into an amber glass bottle and place in a cool, dark area for
2 + 0.10 h.
During this period, asphaltenes analysis may be completed. After obtaining the asphaltene
weight, calculate the maltene concentration as follows:
Maltene Concentration = (Sample Wt. – Asphaltene Wt.)/Volume n-Heptane Filtrate
Figure 70. Equation. Calculation of maltene concentration
Report this concentration in micrograms per milliliter ( g mL
–1
).
Approximately 20 g of maltenes are needed on each Chromarod® for analysis. Therefore, the
quantity of n-heptane filtrate in L (microliters) may be calculated as follows:
Quantity ( g) = Quantity Required (µg)/Concentration ( g mL
–1
) x (1000)
Figure 71. Equation. Calculation of n-heptane filtrate
Report the value in microliters ( L) and round up to the nearest whole unit. This is the volume to
be injected on each Chromarod®.
Solvent Preparation
Use two solvent tanks (1.5 by 7 inches) as solvent baths. Place clean filter paper on the inside of
the back of the tank to enhance vapor transmission in the tank. Fill the first solvent tank with n-
pentane (chromatographic grade) to a point just below the spotting point on the rack
(approximately 1 inch). The next tank should be filled to the same level as the pentane tank with
a 90/10 volume percent ratio toluene/chloroform (chromatographic grade) solvent mixture.
Spotting Chromarods®
To spot the sample on the Chromarods®, use a syringe capable of delivering 0.2 L. Using SIII
Chromarods®, spot the calculated quantity in applications of 0.2 L, rotating the rod to cover the
circumference of the rod to yield five even spots around the circumference of the rod.
Component Separation
After spotting the rods, allow 2 min in the desiccator at room temperature and 50 + 5% relative
humidity (RH) for drying. Place the rods in the n-pentane tank for 20 minutes allowing the
solvents to migrate upwards to the 10 cm mark on the rod rack. This migration will elute the
saturates portion of the maltene fraction to the 10 cm on the rod rack. When the solvent reaches
µ
µ
µ
µ
µ
µ
µ
µ
66

the 10 cm mark, remove the rods from the tank and allow 10 min at room temperature and 50+
5% RH for drying. After drying, place the rods in the 90/10 toluene/chloroform tank for 7 min,
allowing the solvents to migrate upward to the 5 cm mark on the rod rack. This migration will
elute the resins and cyclics portion of the maltene, where cyclics are moved by the blend of
toluene and chloroform, and the resins remain on the rod slightly above the original spot.
Remove the rod rack from the development tank and dry in a forced air oven at 90 °C for 15 min.
Cool in desiccator for 10 min.
Place the rods in the Iatroscan® hydrocarbon analyzer and burn them with the hydrogen flame.
The results are collected by the Iatroscan® software.
Iatroscan Settings used: Hydrogen Flow, 160 L/min., Air Flow, 2.0 L/min. Scanning Speed:
30 s for each rod. The heptane solution contained 0.25 g of maltene in 25 mL, which required a
4.0 L spot to be placed on the rods with the syringe.
Report
Report the asphalt composition in percents of each component as follows:
• Asphaltenes = A%.
• Resins = R%.
• Cyclics = C%.
• Saturates = S%.
Initial stiffness of acid-modified binders and after oven aging for 24 h at 165 °C are reported in
table 12 through table 15.
Table 12. Change in stiffness of asphalt AAD-1 with phosphoric acid modification
immediately after mixing and after 24 h at 165 °C.
Acid Strength (percent)
|G*|/Sin at 64 °C
115
0.89
1.25(1.38)
1.77(1.83)
4.23(4.47)
105
0.89
1.07(1.57)
1.44(2.20)
2.87(3.74)
85
0.89
1.45(1.57)
2.04(2.49)
3.89(3.90)
75
0.89
1.51(1.91)
2.04(2.38)
3.43(3.69)
50
0.89
1.68
2.71
5.6
Addition Level (percent)
0
0.25
0.5
1.0
Table 13. Change in stiffness of asphalt AAM-1 with phosphoric acid modification
immediately after mixing and after 24 h at 165 °C.
Acid Strength (percent)
|G*|/Sin at 64 °C
115
1.69
1.98(2.09)
2.89(2.80)
6.14 (4.48)
105
1.69
1.98(2.08)
2.59(2.58)
4.23(3.65)
85
1.69
2.07(2.19)
2.70(2.95)
3.98(4.50)
75
1.69
2.18(2.25)
2.63(3.40)
4.67(4.68)
50
1.69
2.30
3.48
6.34
Addition Level (percent)
0
0.25
0.5
1.0
µ
µ
δ
δ
67

Table 14. Change in stiffness of asphalt AAK-1 with phosphoric acid modification
immediately after mixing and after 24 h at 165 °C.
Acid Strength (percent)
|G*|/Sin at 64 °C
115
2.43
3.60(3.17)
3.85(4.65)
9.13(9.07)
105
2.43
3.24(4.09)
4.58(4.67)
8.49(9.69)
85
2.43
3.74(4.18)
4.46(4.91)
8.52(8.79)
75
2.43
3.86(3.76)
4.47(5.75)
8.04(7.69)
50
2.43
3.79
6.17
10.17
Addition Level (percent)
0
0.25
0.5
1.0
Table 15. Change in stiffness of asphalt ABM-1 with phosphoric acid modification
immediately after mixing and after 24 hours at 165 °C.
Acid Strength (percent
|G*|/Sin at 64
°C
115
1.65
1.25(1.34)
1.25(1.25)
1.43(1.58)
105
1.65
1.28(1.34)
1.23(1.33)
1.13(1.28)
85
1.65
1.41(1.59)
1.36(1.40)
2.47(1.49)
75
1.65
1.20(1.36)
1.26(1.51)
1.22
50
1.65
1.28
1.48
1.83
Addition Level (Percent)
0
0.25
0.5
1.0
EFFECT OF OVEN AGING 12 DAYS AT 165 °C ON ASPHALT STIFFNESS
Table 16. Oven aging at 165 °C asphalt AAD-1 modified with 115-percent phosphoric acid.
Hours at 165 °C
Stiffness |G*|/Sin at 65 °C
0
0.89
1.25
1.77
4.23
24
—
1.38
1.83
4.47
48
—
1.69
1.92
4.89
72
—
2.39
2.77
6.62
96
—
3.03
3.18
9.88
120
1.13
4.5
4.61
12.41
288
5.92
5.02
7.53
27.95
Acid Addition Level (percent)
0
0.25
0.5
1
— Indicates not measured
Table 17. Oven aging at 165 °C asphalt AAD-1 modified with 105-percent phosphoric acid.
Hours at 165 °C
Stiffness |G*|/Sin at 65 °C
0
0.89
1.07
1.44
2.87
24
—
1.57
2.2
3.74
48
—
1.95
1.9
3.37
72
—
2.99
2.84
4.34
96
—
4.43
3.58
5.62
120
1.13
4.85
4.26
6.44
288
5.92
7.21
7.54
9.52
Acid Addition Level (percent)
0
0.25
0.5
1
— Indicates not measured
δ
δ
δ
δ
68

Table 18. Oven aging at 165 °C asphalt AAD-1 modified with 85-percent phosphoric acid.
Hours at 165 °C
Stiffness |G*|/Sin at 65 °C
0
0.89
1.45
2.04
3.89
24
—
1.57
2.49
3.9
120
1.13
1.58
2.88
—
288
5.92
3.9
5.15
9.04
Acid Addition Level (percent)
0
0.25
0.5
1
— Indicates not measured
Table 19. Oven aging at 165 °C asphalt AAD-1 modified with 75-percent phosphoric acid.
Hours at 165 °C
Stiffness |G*|/Sin at 65 °C
0
0.89
1.51
2.04
3.43
24
—
1.91
2.38
3.69
120
1.13
2.61
3.36
4.49
288
5.92
4.66
5.46
6.67
Acid Addition Level (percent)
0
0.25
0.5
1
— Indicates not measured
Table 20. Oven aging at 165 °C asphalt AAD-1 modified with 50-percent “green”
phosphoric acid.
Hours at 165 °C
Stiffness |G*|/Sin at 65 °C
0
0.89
1.68
2.71
5.6
120
1.13
—
—
168
2.46
3.45
7.54
288
5.92
—
—
—
336
3.65
4.7
10.53
Addition Level (percent)
0
0.25
0.5
1
— Indicates not measured
Table 21. Oven aging at 165 °C asphalt AAK-1 modified with 115-percent phosphoric acid .
Hours at 165 °C
Stiffness |G*|/Sin at 65 °C
0
2.43
3.6
3.85
9.13
24
2.8
3.17
4.65
9.07
48
—
4.34
6.28
12.7
72
—
6.33
7.95
17.37
96
—
8.09
12.04
22.39
120
10.5
10.53
17.11
33.2
288
12.9
19.24
24.98
39.96
Acid Addition Level (percent)
0
0.25
0.5
1
— Indicates not measured
Table 22. Oven aging at 165 °C asphalt AAK-1 modified with 105-percent phosphoric acid.
Hours at 165 °C
Stiffness |G*|/Sin at 65 °C
0
2.43
3.24
4.58
8.49
24
2.8
4.09
4.67
9.69
48
—
5.06
5.68
13.62
120
10.5
8.49
8.94
17.77
288
12.9
17.85
19.97
43.05
Acid Addition Level (percent)
0
0.25
0.5
1
— Indicates not measured
δ
δ
δ
δ
δ
69

Table 23. Oven aging at 165 °C asphalt AAK-1 modified with 85-percent phosphoric acid.
Hours at 165 °C
Stiffness |G*|/Sin at 65 °C
0
2.43
3.74
4.46
8.52
24
2.8
4.18
4.91
8.79
120
10.5
7.88
7.97
15.42
288
12.9
14.72
16.8
30.46
Acid Addition Level (percent)
0
0.25
0.5
1
— Indicates not measured
Table 24. Oven aging at 165 °C asphalt AAK-1 modified with 75-percent phosphoric acid.
Hours at 165 °C
Stiffness |G*|/Sin at 65 °C
0
2.43
3.86
4.47
8.04
24
2.8
3.76
5.75
7.69
48
—
5.37
7.85
11.82
120
10.5
16.69
22.25
23.79
288
12.9
33.38
33.02
45.31
Acid Addition Level (percent)
0
0.25
0.5
1
— Indicates not measured
Table 25. Oven aging at 165 °C asphalt AAK-1 modified with 50-percent “green”
phosphoric acid.
Hours at 165 °C
Stiffness |G*|/Sin at 65 °C
0
2.43
3.79
6.17
10.17
24
2.8
—
—
—
120
10.5
—
—
—
168
6.03
6.65
17.01
288
12.9
—
—
—
336
—
10.6
11.62
22.94
Acid Addition Level (percent)
0—
0.25
0.5
1
— Indicates not measured
Table 26. Oven aging at 165 °C asphalt AAM-1 modified with 115-percent phosphoric acid
Hours at 165 °C
Stiffness |G*|/Sin at 65 °C
0
1.69
1.98
2.89
6.14
24
—
2.09
2.8
4.48
48
—
2.81
3.5
6.93
72
—
4.06
4.49
7.26
120
1.96
5.8
7.5
8.04
288
11.68
11.48
14.9
13.11
Acid Addition Level (percent)
0
0.25
0.5
1
— Indicates not measured
δ
δ
δ
δ
70

Table 27. Oven aging at 165 °C asphalt AAM-1 modified with 105-percent phosphoric acid.
Hours at 165 °C
Stiffness |G*|/Sin at 65 °C
0
1.69
1.98
2.59
4.23
24
—
2.08
2.58
3.65
48
—
2.61
3.44
4.1
72
—
3.59
4.07
4.41
120
1.96
5.26
5.27
3.36
288
11.68
9.15
8.74
7.11
Acid Addition Level (percent)
0
0.25
0.5
1
— Indicates not measured
Table 28. Oven aging at 165 °C asphalt AAM-1 modified with 85-percent phosphoric acid.
Hours at 165 °C
Stiffness |G*|/Sin at 65 °C
0
1.69
2.07
2.7
3.98
24
—
2.19
2.95
4.5
120
1.96
5.51
7.92
5.49
288
11.68
12.73
12.77
8.83
Acid Addition Level (percent)
0
0.25
0.5
1
— Indicates not measured
Table 29. Oven aging at 165 °C asphalt AAM-1 modified with 75-percent phosphoric acid.
Hours at 165 °C
Stiffness |G*|/Sin at 65 °C
0
1.69
2.18
2.68
4.67
24
—
2.25
3.4
4.68
120
1.96
2.32
10.17
6.49
288
11.7
12.11
14.52
13.37
Acid Addition Level (percent)
0
0.25
0.5
1
— Indicates not measured
Table 30. Oven aging at 165 °C asphalt AAM-1 modified with 50-percent “green”
phosphoric acid.
Hours at 165 °C
Stiffness |G*|/Sin at 65 °C
0
1.69
2.3
3.48
6.34
120
1.96
—
—
—
168
7.92
8.75
7.47
288
11.68
—
—
—
336
—
15.66
15.11
9.84
Acid Addition Level (percent)
0
0.25
0.5
1
— Indicates not measured
Table 31. Oven aging at 165 °C asphalt ABM-1 modified with 115-percent phosphoric acid
Hours at 165 °C
Stiffness |G*|/Sin at 65 °C
0
1.65
1.25
1.25
1.43
24
—
1.34
1.25
1.58
48
—
1.53
1.37
1.62
72
—
1.72
1.69
2.01
120
1.52
3.12
2.11
4.23
288
1.81
8.86
2.34
18.79
Acid Addition Level (percent)
0
0.25
0.5
1
— Indicates not measured
δ
δ
δ
δ
δ
71

Table 32. Oven aging at 165 °C asphalt ABM-1 modified with 105-percent phosphoric acid.
Hours at 165 °C
Stiffness |G*|/Sin at 65 °C
0
1.65
1.28
1.23
1.13
24
—
1.34
1.33
1.28
48
—
1.43
1.58
—
120
1.52
1
1.85
1.37
288
1.81
1.72
2.68
3.36
Acid Addition Level (percent)
0
0.25
0.5
1
— Indicates not measured
Table 33. Oven aging at 165 °C asphalt ABM-1 modified with 85-percent phosphoric acid.
Hours at 165 °C
Stiffness |G*|/Sin at 65 °C
0
1.65
1.41
1.36
2.47
24
—
1.59
1.4
1.49
120
1.52
1.46
2.39
2.75
288
1.81
3.54
5.49
10.47
Acid Addition Level (percent)
0
0.25
0.5
1
— Indicates not measured
Table 34. Oven aging at 165 °C asphalt ABM-1 modified with 75-percent phosphoric acid.
Hours at 165 °C
Stiffness |G*|/Sin at 65 °C
0
1.65
1.2
1.26
1.22
24
—
1.36
1.51
—
120
1.52
1.83
3.09
2.96
288
1.81
5.09
7.97
8.89
Acid Addition Level (percent)
0
0.25
0.5
1
— Indicates not measured
Table 35. Oven aging at 165 °C asphalt ABM-1 modified with 50-percent “green”
phosphoric acid.
Hours at 165 °C
Stiffness |G*|/Sin at 65 °C
0
1.65
1.28
1.48
1.83
120
1.52
—
—
—
168
4.14
6.28
6.98
288
1.81
—
—
—
336
21.45
30.37
45.27
Acid Addition Level (percent)
0
0.25
0.5
1
— Indicates not measured
DOES PHOSPHORIC ACID CAUSE OXIDATION IN ASPHALT BINDERS?
Table 36. PAV aging asphalt ABM-1 under air pressure at 100 °C.
Hours
Control
105 percent
115 percent
P
2
O
5
0
1.37
1.12
1.3
1.46
24
1.68
1.12
1.19
1.41
168
5.09
2.83
2.62
2.87
336
9.13
5.88
6.08
5.66
δ
δ
δ
δ
72

Table 37. PAV aging asphalt AAD-1 under air pressure at 100 °C.
Hours
Control
105 percent
115 percent
P
2
O
5
0
1.03
4.05
4.75
1.38
24
1.21
4.07
3.95
1.73
168
14.35
10.83
12.26
12.4
336
36.83
21.17
20.31
37.82
Table 38. PAV aging asphalt AAK-1 under air pressure at 100 °C.
Hours
Control
105 percent
115 percent
P
2
O
5
0
2.27
8.65
7.99
2.65
24
3.23
9.36
7.47
2.93
168
9.84
19.04
17.5
13.85
336
20.67
28.30
29.87
31.61
Table 39. PAV aging asphalt AAM-1 under air pressure at 100 °C.
Hours
Control
105 percent
115 percent
P
2
O
5
0
1.65
3.85
6.50
1.95
24
2.16
3.80
5.02
2.11
168
10.94
8.03
8.52
9.17
336
30.1
11.68
9.32
19.21
Table 40. PAV aging asphalt ABM-1 under nitrogen pressure at 100 °C.
Hours
Control
50 percent
85 percent
115
percent
0
0.73
24
168
7.35
4.18
3.67
336
1.17
9.37
5.3
4.41
— Indicates not measured
Table 41. PAV aging asphalt AAD-1 under nitrogen pressure at 100 °C.
Hours
Control
50 percent
85 percent
115 percent
0
0.73
24
168
7.35
4.16
3.67
336
1.17
9.37
5.3
4.41
— Indicates not measured
Table 42. PAV aging asphalt AAK-1 under nitrogen pressure at 100 °C.
Hours
Control
50 percent
85 percent
115 percent
0
2.35
24
168
15.21
8.02
9.21
336
4.37
16.38
9.64
9.53
— Indicates not measured
73

Table 43. PAV aging asphalt AAM-1 under nitrogen pressure at 100 °C.
Hours
Control
50 percent
85 percent
115 percent
0
1.38
24
168
6.34
3.95
5.22
336
2.31
7.87
3.8
4.73
— Indicates not measured
74
REFERENCES
1. Engberger, S.L. and Reinke, G.H. U.S. Patent 6,117,926 Acid-reacted polymer-modified
asphalt compositions and preparation thereof. September 12.
2. Engberger, S.L. and Reinke, G.H. U.S. Patent 6,399,680 Acid-reacted polymer-modified
asphalt compositions and preparation thereof. June 4, 2002.
3. Puzic, O. et al., “Percentage of 115% Polyphosphoric Acid in Modified Asphalt,”
ExxonMobil AmTS Procedure: R 122206, Revision No. 2, December 22, 2006.
4. Reinke, G.H. et al., Mathy Technology and Engineering Services Inc. (Private
communication 4/18/2007).
5. SHRP Materials Reference Library: Asphalt Cements: A Concise Data Compilation,
SHRP-A-645, 1993.
75
ADDITIONAL READING
Li, X. et al., “Laboratory Evaluation of Asphalt Binders and Mixtures Containing
Polyphosphoric Acid,” Journal of the Transportation Research Board, No. 2210, Asphalt
Binders and Mixtures, 4, pp. 47–56, 2011.
Baumgardner. G.L. et al., “Polyphosphoric Acid Modified Asphalt: Proposed Mechanisms,”
Association of Asphalt Paving Technologists, 74, pp. 283–305, 2005.
Orange, G. et al., “Chemical Modification of Bitumen Through Polyphosphoric Acid: Properties-
Microstructure Relationship,” in Proceedings of the Third Eurasphalt and Eurobitume Congress,
Vienna, 1, pp.733–745, May 2004.
Bishara, S.W. et al., “Modification of Binder with Acid—Advantages and Disadvantages,”
Kansas Department of Transportation Report FHWA-KS-02-2, February 2003.
De Filippis, P. et al., “Sulphur Extended Asphalt: Reaction Kinetics of H
2
S Evolution,” Fuel, 77,
No 5, pp. 459–463, 1998.
Bonemazzi, F. and Giavarini, C., “Shifting the Bitumen Structure from Sol to Gel,” Journal of
Petroleum Science and Engineering, 22, Issues 1–3, pp. 17–24, 1999.
Giavarini, C. et al., U.S. Patent 5,565,510 ,“Mixtures of Bitumen and Polymer Composition,”
October 15, 1996.
De Filippis, P. et al., “Stabilization and Partial Deasphalting of Thermal Residues by Chemical
Treatment,” Energy and Fuels, 8, pp. 141–146, 1994.
Alexander, S. U.S. Patent 3,751,278, “Method of Treating Asphalt,” August 1973.
Hoiberg, A.J., U.S. Patent 3,028,249, “Asphaltic Compositions,” April 3, 1962.
Hoiberg, A.J. et al., U.S. Patent 2,890,967, “Asphalt Coating,” June 16, 1959.
Hoiberg, A.J., U.S. Patent 2,450,756, “Air Blown Asphalt and Catalytic Preparation Thereof,”
October 5, 1948.
Hoiberg, A.J., U.S. Patent 2,421,421, “Process of Treating High Molecular Weight
Hydrocarbons,” June 3, 1947.
77

HRDI-10/11-14(WEB)E
