
State of Micro
Enterprise
Financing
Report 2023
State of Micro Enterprise
Financing Report 2023
Author: Praveen Khedale
December 2023
Published by
ACCESS Development Services
22, Hauz Khas Village, New Delhi 110 016
www.accessdev.org
Edition copyright ACCESS Development Services 2023
All rights reserved.
No part of this publication may be reproduced, transmitted, or
stored in a retrieval system, in any form or by any means, electronic,
mechanical, photocopying, recording or otherwise, without the prior
permission of the publisher.
Typeset & Printed by
Elegant Enterprises
198/41-B, Ramesh Market
East of Kailash, New Delhi, India

State of Micro Enterprise Financing Report 2023 | 3
FOREWORD
T
he Indian economy has sustained its growth momentum, with overall economic
activity remaining resilient. The Micro, Small and Medium Enterprise (MSME)
sector has a major role in contributing to the country’s economic growth and socio-
economic development through employment generation and reducing inequalities
and regional imbalances in incomes and economic opportunity. The government
envisages MSMEs to contribute USD 2 trillion to the target of becoming USD 5
trillion economy by 2024.
The MSMEs have comparatively lower capital cost than large industries, provide
low-cost raw material for different sectors, and provide employment in smaller towns
and rural areas. One of the critical indicators to assess the successful development
of MSME sector in an economy is the data on opening of new MSMEs; it depicts
the conducive environment for opening and growth of such units in an economy
as well as show the high morale of entrepreneurs in the macroeconomics of the
economy.
India has approximately 6.3 crore MSMEs out of which 31% share is of
manufacturing, 36% share of trade and 33% share is of other services. Micro sector
accounts for more than 99% of total estimated number of MSMEs and around
97% of total employment in the sector (National Sample Survey (NSS) 73rd round
conducted during 2015-16). Nearly 2 crore MSMEs are registered on the Udyam
Portal of the Ministry of MSME, Government of India, of which 19.15 crore
(96%) are micro enterprises.
MSMEs have great potential to push accelerated growth in this developing economy.
However, lack of managerial, entrepreneurial, and marketing avenues and skills,
access to and integration of advanced technology etc. are major bottlenecks for
micro enterprises for growing and sustaining their businesses. Access to affordable,
adequate and timely credit is often cited as the predominant barrier to their growth.
There is a great relevance of the availability of loan facilities from traditional banking
systems and efciency of MSMEs in India. Complicated procedures, cost of availing
credit, and the overall documentation affect the condence of entrepreneurs to start
up. High collateral requirement is another major factor affecting the capacity of
availing loans at affordable interest rates. It further adds nancial problems for small
businesses.
MSMEs is a fairly diverse ‘group’ with substantial differences in business formality,
sizes and credit needs. A large number of viable and resilient tiny enterprises —

4 | State of Micro Enterprise Financing Report 2023
with turnover of say between INR 50 lakhs - 1 crore — within the microenterprise
segment, have the potential to drive local self-employment and job creation,
including employing people with limited skills and education. These additionally
offer avenues for participation of women in the formal economy and labour force.
This is a segment of microenterprises that need loans of value higher than provided
through the micronance channel, and are not catered to by banks and other formal
nancial institutions through other products due to high risk, lack of past credit
record and other associated challenges.
Over the years, Equifax - one of the leading credit information companies, has
worked with Indian lenders to help maintain high levels of underwriting standards
and helped with assisting consumers in in understanding and managing their credit.
With the objective of providing a distilled view on the state of lending to the ‘tiny’
sub-set within the microenterprises, ACCESS has partnered with Equifax since
2020 to bring out an annual trend report titled Status of Microenterprise Lending.
This Report tracks the performance metrics of portfolio of business loans up to
Rs 25 lakhs as a proxy for reporting on loans to the tiny enterprises, in order to
draw out gaps in lending to this segment, and advocate for necessary attention from
nancial service providers and policy to address this important sub-segment of
microenterprises.
Helping tiny enterprises grow can present tremendous value for India’s development.
With the right investment, tools, and support, tiny and microenterprises offer
the benets of job creation, women economic empowerment, and boosting the
country’s economy. This Report aims to contribute to data based insights on access
to loans to this critical segment.
I thank Aditya B Chatterjee, Managing Director, Equifax India on agreeing to
this continued partnership. I place on record my appreciation for his team led by
Shruti Joshi for providing the required data on various dimensions for the report.
I appreciate Praveen Khedale’s efforts in bringing together the data analysis and
authoring the report.
With the Fourth edition of the Report, ACCESS is happy to present useful trends in
the data covering portfolio growth and quality by loan sizes, geographical trends and
performance by institutional types. The Report will be released at the 20th milestone
edition of the Global Inclusive Finance Summit on December 13, 2023.
Radhika Agashe
Executive Director
ACCESS Development Services

State of Micro Enterprise Financing Report 2023 | 5
PREFACE
E
quifax combines robust data, analytics and advanced technology to provide
actionable insights to businesses, which in turn enable them to make sound
decisions across customer acquisition, extending credit, mitigating fraud or better
managing portfolio risk.
This report was developed in partnership with ACCESS Development Services
to provide insights on the MSME Sector. The main insights highlighted from the
data points, trends and their analysis from the report are focused on MSME are
listed below:
Business Loan
Based on the analysis in the Business Loan segment, it can be seen that loans falling
under ‘Up to `3 Lakhs’ category dominate the numbers while the larger ticket sizes
contribute more signicantly to the portfolio outstanding amount despite their
small numbers. The data shows that the NBFCs lead the segment with a 36%
share in loan sanctions, highlighting the segment as a functional business venture
fueled by competitive market forces. The ‘ `5 to 7 Lakhs’ ticket size has a POS of
9% while ‘ `3 to 5 Lakhs’ ticket size has a value of 12%, revealing an imbalance
to be addressed for a healthier MSME sector. A 90+ DPD of 16% in the ‘Up to
`3 Lakhs’ category indicates that this portion requires investigation driven risk
mitigation. Hence, the data encapsulates the dynamic market shift to micro loans
suggesting the nancial institutions to perform adaptive strategies for capturing
the growing demands while maintaining economic stability in the MSME sector.
Business Loan Agriculture
The Business Loan Agriculture segment analysis afrms that the nancial share
is more evenly distributed across different loan sizes despite the smaller loans
dominating in terms of the number of loans. It is observed that there is a shift
towards larger loans marking a growth in business lending across the segment.
State-wise loan distribution species that Uttar Pradesh and Telangana have high
shares in terms of loan accounts and portfolio outstanding. The distribution also

6 | State of Micro Enterprise Financing Report 2023
indicates a disparity in the distribution of loans in rural, semi-urban, and urban
areas due to varying access and utility of nancial services. In addition to the
geographical analysis, it is noted that PSU banks contribute signicantly to the
segment lending.
Mudra Loan
As per the research on Mudra Loan segment’s data a strong tilt towards smaller
ticket loans can be perceived due to the ‘Up to `3 Lakhs’ category holding a
majority of the accounts and a signicant portion of the Portfolio Outstanding
(POS). This increase in smaller ticket size loans coupled with the year on year shift
towards the ‘ `3 to 5 Lakhs’ and ‘ `7 to 10 Lakhs’ size loans marks the segment’s
effectiveness as well as the growth of businesses in the MSME sector.
Aditya B. Chatterjee
Managing Director

State of Micro Enterprise Financing Report 2023 | 7
TABLE OF CONTENTS
FOREWORD 3
PREFACE 5
1 INTRODUCTION 9
The MSME Sector 9
About the Report 10
2 BUSINESS LOAN 12
INTRODUCTION 12
PORTFOLIO 12
Size-wise Analysis 12
Which Bucket is Full? 13
Size-wise Distribution 15
Institutions Share 16
Rural/Urban Distribution 17
REPAYMENT 20
Overdue by Ticket size 20
Overdue by Location of Borrower 20
Institution wise Overdue 21
Performance of States in 90+ DPD Overdue 22
BUSINESS LOAN SOURCING 23
Demographics-wise Sanction 24
Institution wise Sanction 26
CONCLUSION ON BL 27
3 BUSINESS LOAN AGRICULTURE 28
PORTFOLIO 28
Size wise Analysis 28
Which Bucket is Full? 29
State wise Distribution 30

8 | State of Micro Enterprise Financing Report 2023
Institutions wise Details 32
Rural/Urban Distribution 33
Institutions Share in Different Demographics 34
REPAYMENT 37
Overdue by Ticket size 37
Overdue by Location of Borrower 38
Institution wise Overdue 39
Performance of States in 90+ DPD Overdue 40
SOURCING 41
Demographics-wise Sanction 43
Demographic Trend 43
Performance of Financial Institutions in different Population Groups 44
CONCLUSION ON BL AGRICULTURE 46
4 MUDRA LOAN 47
INTRODUCTION 47
PORTFOLIO 47
Size-wise Analysis 47
Trend on Various Loan Buckets 49
State-wise Distribution 50
Institutions wise Distribution 51
Rural/Urban Distribution 52
REPAYMENT 53
Overdue by ticket size 53
Overdue by Location of Borrower 55
Performance of States in 90+ DPD Overdue 56
MUDRA LOAN SOURCING 57
Demographics wise Sanction 59
States Share in Sanction 60
CONCLUSION ON MUDRA 61
5 CONCLUSION 63

State of Micro Enterprise Financing Report 2023 | 9
1. INTRODUCTION
The MSME Sector
T
he Micro, Small and Medium Enterprise (MSME) sector plays a pivotal role in
the Indian economy, marking its signicance through substantial contributions
to various economic facets. It stands as a key driver for employment, generating
opportunities for about 11.1 crore individuals, a gure only surpassed by the
agriculture sector. Remarkably, MSMEs contribute approximately 30% to India’s
Gross Domestic Product or GDP and account for over 48% of exports, alongside
contributing about 45% to the manufacturing output. This sector, encompassing
around 6.34 crore enterprises, is not just a cornerstone for economic growth but
also a hub for innovation and inclusive development. Furthermore, MSMEs play a
vital role in fostering entrepreneurship and self-employment at lower capital costs,
often serving as ancillary units to larger industries. Their expanding domain across
various sectors, producing a diverse range of products and services, positions
them uniquely to meet both domestic and global market demands.
The institutional system for MSME credit in India is a comprehensive network
regulated by the Reserve Bank of India (RBI) and involves various nancial
entities. This network includes scheduled commercial banks encompassing public
sector banks, private sector banks (including small nance banks), foreign banks,
co-operative banks, and regional rural banks, as well as Non-Banking Financial
Companies (NBFCs) and Micro Finance Institutions (MFIs). Additionally, the
Securities and Exchange Board of India (SEBI) oversees entities providing or
mediating equity capital to MSMEs, such as SME Exchanges, angel investors,
venture capital, and private equity. Key apex institutions like the Small Industries
Development Bank of India (SIDBI) and Micro Units Development and Renance
Agency Ltd. (MUDRA) offer sectoral support under the Department of Financial
Services, Government of India. The Ministry of MSME acts as the apex executive
body for policy formulation and administration for these enterprises. Moreover, the
Credit Guarantee Trust for MSMEs (CGTMSE) and National Credit Guarantee
Company (NCGTC) play crucial roles in facilitating credit growth. Digital platforms

10 | State of Micro Enterprise Financing Report 2023
like Trade Receivables Discounting System (TReDS) and OnlinePSB Loans, aided
by credit bureaus and systems like Goods and Services Tax Identication (GSTIN)
and Unique Identication Authority of India (UIDAI), further streamline the
credit ow to MSMEs.
About the Report
The report is fully based on data from Equifax India, one of the leading credit
information companies in the country. The credit bureau records all categories
of loans taken by all classes of borrowers – micronance loans, individual loans,
business loans, and commercial loans.
This report examines data from Equifax, focusing on three types of credit
extended to the MSME sector: Business Loans, Business Loans in Agriculture,
and MUDRA loans up to `25 Lakhs. It was observed that certain data elds in the
records provided by Equifax, particularly those related to ticket sizes and rural-
urban classication, were incomplete and marked as ‘Not Dened’ (ND) in the
tables. However, since the cumulative data for ND categories is negligible, they are
not elaborated upon in this report. The analysis includes a review of the portfolio
and repayment status data as of March 2023, comparing it with the data from
March 2022 and March 2021. The report also investigates the sourcing of credit
or loan sanctions from April 2022 to March 2023, alongside a comparison with
gures from the previous year in these specic credit categories.
The report provides an in-depth insight of credit to the MSME sector in the
country by analysis of data provided by Equifax, focusing on three crucial aspects:
portfolio outstanding, repayment or overdue status, and loan sanction or sourcing.
To gain a comprehensive understanding, the data on these aspects are dissected
through various lenses.
Firstly, the analysis of the portfolio outstanding offers insights into the total
amount of credit currently extended to MSMEs. This measure is crucial for
understanding the scale of lending and the economic weight of the MSME sector
within the credit market.
Secondly, the report examines the repayment or overdue status of these loans.
This aspect is pivotal in assessing the nancial health of MSMEs and their ability
to meet nancial obligations. It provides a window into the creditworthiness and
potential risk factors associated with lending to this sector.

State of Micro Enterprise Financing Report 2023 | 11
Lastly, the analysis of loan sanction or sourcing sheds light on the patterns and
trends in new credit allocation to MSMEs. This aspect reveals how and where
new loans are being originated, which can indicate shifts in lending strategies or
emerging opportunities within the sector.
To add depth to the analysis, the report slices the data through various aspects such
as loan ticket size, which helps in understanding the distribution and utilization
of loans of different sizes. Demographics provide a lens to view how credit
distribution varies among different groups, potentially highlighting inclusivity or
gaps in the lending landscape. The contribution of various lending institutions
is also examined, offering insights into their roles and impact within the MSME
credit market. Additionally, the state-wise share in MSME lending is explored,
uncovering regional disparities and trends.
Overall, this multifaceted analysis not only paints a detailed picture of the current
state of MSME credit but also helps in identifying trends, potential risks, and
opportunities for policy and strategic interventions in the sector.

12 | State of Micro Enterprise Financing Report 2023
2. BUSINESS LOANS
INTRODUCTION
M
icro, Small, and Medium Enterprises (MSMEs) are the lifeblood of
our economy, often dubbed as the backbone of industrial growth and
employment generation. These enterprises, however, need more than just spirit
and vision to thrive; they require capital. Business loans, especially those tailored
for MSMEs, serve this very purpose. This chapter delves into the world of MSME
loans characterized by ticket sizes up to `25 lakhs. By navigating through diverse
loan portfolios, we explore the lending patterns and trends that empower these
enterprises to scale new heights. These loans, modest in size but monumental
in impact, not only support businesses but also stimulate economic growth and
innovation. Welcome to the intricate tapestry of MSME business loans, where
nancial support meets entrepreneurial ambition.
PORTFOLIO
Size-Wise Analysis
Table 1 presents a detailed breakdown of the business loan portfolio segmented
by ticket sizes. The most striking observation is the dominance of loans in the
‘Up to 3 lakh’ category, with 9,950 thousand accounts, representing a substantial
portfolio outstanding (POS) amount of `52,728 crores. This indicates smaller
ticket borrower make a signicant portion of the total borrowers of nancial
institutions. In contrast, while the ‘3 to 5 lakh’ and ‘5 to 7 lakh’ categories have
fewer accounts (962 thousand and 399 thousand respectively), their POS values,
`26,394 crores and `15,621 crores respectively, underscore the signicant nancial
heft these categories carry. The ‘7 to 10 lakh’ category, despite having 577 thousand
accounts, boasts a POS of `34,567 crores, highlighting the larger average loan
amount within this bracket. Similarly, the ‘10 to 15 lakh’, ‘15 to 20 lakh’, and ‘20 to
25 lakh’ categories, with 3.40 lakh, 2.12 lakh and 1.58 lakhd accounts respectively,
have considerable POS values, emphasizing that while these ticket sizes may be
fewer in number, they are substantial in monetary terms.

State of Micro Enterprise Financing Report 2023 | 13
Table 1: Business Loan, Ticket Size wise ‘23
Ticket size `
A/c Amount
Up to 3 lakh 9,950 52,728
3 to 5 lakh 962 26,394
5 to 7 Lakh 399 15,621
7 to 10 lakh 577 34,567
10 to 15 lakh 340 28,938
15 to 20 lakh 212 24,789
20 to 25 lakh 158 23,306
Not Dened * 250 8,539
Grand Total 12,850 214,881
A/c - Number of accounts in ‘000, Amt. – POS in ` Crore
*Not Dened - The data value in particular qualier is blank for these values. Same is
applicable for all further mention of Not Dened.
In summary, while micro-loans are predominant in terms of the number of
borrowers, larger loans, although fewer, constitute a signicant portion of the
overall portfolio balance. This diversity highlights the dynamic nature of the
business lending landscape, catering to a wide range of nancial needs and
business scales.
Which Bucket is Full?
Following graphs provides interesting portrayal of the lending patterns, showcasing
distinctive contrasts between the number of loans and the portfolio outstanding
(POS) for different ticket sizes.
Micro Loans or ‘Up to 3 lakh’ category stands out in terms of volume, representing
a staggering 77% of the total loans by March 2023. However, its contribution to
the POS paints a different narrative. Despite its vast numbers, this category only
accounts for 25% of the total POS in March 2023. This disparity highlights the
essence of micro-nancing: high in quantity but modest in individual loan value.
Mid-Range Loans encompassing the ‘3 to 10 lakh’ brackets, these mid-range loans
collectively make up 14% of the total number of loans in March 2023. Yet, their
inuence on the POS is more pronounced, with a combined contribution of 35%
in March 2023 This emphasizes that these mid-tier loans, while less frequent in
occurrence, possess a heftier individual nancial impact.
Larger Loans, from ‘10 to 25 lakh’ account for roughly 6% of the total number of
loans in March 2023. However, their cumulative footprint in the POS is a robust

14 | State of Micro Enterprise Financing Report 2023
36%. This signicant gap accentuates the pivotal role these larger loans play in the
nancial landscape.
Table 2: Percentage Share of Number of Loans
Ticket Size Mar-21 Mar-22 Mar-23
Up to 3 lakh 63% 56% 77%
3 to 5 lakh 7% 6% 7%
5 to 7 Lakh 3% 3% 3%
7 to 10 lakh 4% 4% 4%
10 to 15 lakh 2% 3% 3%
15 to 20 lakh 1% 2% 2%
20 to 25 lakh 1% 1% 1%
Not Dened 3% 3% 2%
Table 3: Percentage Share of POS
Ticket Size Mar-21 Mar-22 Mar-23
Up to 3 lakh 24% 20% 25%
3 to 5 lakh 13% 12% 12%
5 to 7 Lakh 8% 9% 7%
7 to 10 lakh 16% 18% 16%
10 to 15 lakh 13% 15% 13%
15 to 20 lakh 11% 13% 12%
20 to 25 lakh 9% 11% 11%
Not Dened 5% 2% 4%
Figure 1: Percentage Share Number of Loans Figure 2: Percentage Share of POS
0%
10%
20%
30%
40%
50%
60%
70%
80%
90%
Mar-21 Mar-22 Mar-23
0%
5%
10%
15%
20%
25%
30%
Mar-21 Mar-22 Mar-23

State of Micro Enterprise Financing Report 2023 | 15
Across all ticket sizes, the year-to-year trend reveals a general shift towards micro-
loans. The ‘Up to 3 lakh’ category saw a dip from March 2021 to March 2022 but
experienced a signicant surge by March 2023. Mid-range loans (‘3 to 10 lakh’)
remained relatively stable in terms of both loan numbers and POS share over
the years. Larger loans (‘10 to 25 lakh’), while consistent in terms of the number
of loans, showed a slight increase in their POS contribution. The Not Dened
category displayed a downward trend in loan numbers but had a variable POS
share, indicating potential reclassications or shifts in lending dynamics.
The graphs, unveil a multi-layered story of the lending ecosystem. While smaller
ticket sizes reign supreme in terms of sheer numbers, it’s the heft of mid-
range and larger loans that anchors the nancial fulcrum. Their considerable
value, albeit lower in volume, underscores the delicate equilibrium that lenders
maintain.
State-Wise Performance
Some states have high population share but lower MSME credit share. With a 17%
share in population, share of Uttar Pradesh in the number of accounts and credit
amount are 8.5% and 7.5% respectively. This indicates that either the demand
for MSME loans is low, nancial institutions perceive higher risks in extending
credit, or there’s an under penetration of banking services. Despite having a 9%
population share, Bihar’s share in the number of accounts and credit amount is
4.2% and 2.9%, respectively. This could point towards either a lesser number of
MSME establishments or a lack of accessibility to nancial services. Population
share of West Bengal stands at 8%. However, its share in the number of accounts
and credit amount is only 3.5% and 4.2%. This mismatch suggests potential
challenges in credit accessibility or lower demand for credit.
The trend reverses for some states. Despite a 1% population share, Delhi’s share
in the number of accounts and credit amount is 1.5% and 3.8%, respectively.
This might be due to Delhi being a commercial hub with a higher concentration
of businesses needing larger loan sizes. Similarly, Rajasthan with a 6% share in
population, its shares in the number of accounts and credit amount are 4.1% and
6.7%. While Maharashtra’s population and credit account shares match at 9%, its
credit amount share stands higher at 11.6%, indicating that MSMEs in Maharashtra
might be dealing with larger transactional values or have better credit accessibility.
Tamil Nadu stands apart with only 6% population share, but its credit account and
amount shares are 16.1% and 14.1%. This suggests a strong MSME sector and
better nancial integration.

16 | State of Micro Enterprise Financing Report 2023
Figure 3: States percentage share in Business Loan
The graph highlights signicant disparities in the distribution of MSME credit
across states when juxtaposed against population shares. This variance could be
due to regional economic disparities, the nature of industries prevalent in the states,
risk perceptions of banks, or accessibility to nancial services. There’s a visible
trend where some states, despite having substantial populations, have a lower
share of MSME credit. This could be indicative of untapped potential and might
signal a need for more targeted nancial inclusion initiatives. Conversely, certain
states outperform in credit metrics relative to their population, indicating strong
economic activity, better nancial infrastructure, or both. The dynamics between
the number of credit accounts and the credit amount reveal the nature of MSME
loans in states. Some states have a higher number of accounts but lower total
amounts, suggesting many smaller loans, while others show the opposite trend.
Institutions Share
The landscape of MSME lending in the country showcases a diverse participation
of various nancial institutions. Public Sector Undertaking or PSU Banks, with
their vast network and outreach, lead the pack, holding a substantial 35.7% of the
number of MSME loan accounts. This dominance is reected not just in the sheer
number of accounts but also in the loan amounts, where they contribute 32.8%.
Their widespread presence and commitment to fuelling the grassroots level of the
economy are evident in these numbers.
0.0%
2.0%
4.0%
6.0%
8.0%
10.0%
12.0%
14.0%
16.0%
18.0%
Lakshadweep
Ladakh
Andaman & Nicobar…
Mizoram
Arunachal Pradesh
The Dadra & Nagar…
Nagaland
Sikkim
Chandigarh
Tripura
Meghalaya
Goa
Manipur
Jammu & Kashmir
Puducherry
Uttarakhand
Chhattisgarh
Himachal Pradesh
Jharkhand
Delhi
Punjab
Haryana
West Bengal
Odisha
Kerala
Telangana
Rajasthan
Assam
Bihar
Gujarat
Andhra Pradesh
Madhya Pradesh
Uttar Pradesh
Karnataka
Maharashtra
Tamil Nadu
% Share No of Accounts % share POS % Share population

State of Micro Enterprise Financing Report 2023 | 17
Figure 4: Lenders percentage share in Business Loan
On the other hand, NBFCs, often seen as agile and more adaptive entities, hold
17.3% of the number of accounts. What’s striking is that their contribution to the
loan amount stands at a higher 21.6%. This suggests that while they might have
fewer borrowers compared to PSU Banks, the average loan size or the nature of
enterprises they cater to might be different, leading to larger loan disbursements.
Private Banks have carved out a signicant niche for themselves, holding 14.0%
of the accounts. Their share in the loan amount stands even higher at 19.1%,
indicating a focus on more substantial loans or catering to a segment of MSMEs
requiring larger capital inputs.
In contrast, Foreign Banks seem to have a limited role in the MSME lending
landscape of the country. They account for a mere 0.1% of the number of
accounts and 0.7% of the loan amount. This could be attributed to their selective
presence, specic focus sectors, or strategic business decisions.
Lastly, the Rest of Industry category, which might comprise smaller banks,
cooperatives, and other nancial entities, underscores the importance of diverse
nancial players. With 32.9% of accounts and 25.8% of the loan amount, this
segment solidies the notion that a multi-pronged nancial ecosystem is essential
for the holistic growth of the MSME sector.
Rural/Urban Distribution
In the rural nancial landscape, the prominence of various institutions paints a vivid
picture of grassroots economic empowerment. Dominating this space, the Rest of
Industry category, potentially comprising regional banks and cooperatives, holds
0.1%
17.3%
35.7%
14.0%
32.9%
0.7%
21.6%
32.8%
19.1%
25.8%
0.0%
5.0%
10.0%
15.0%
20.0%
25.0%
30.0%
35.0%
40.0%
Foreign Bank NBFC PSU Bank Pvt. Bank Rest of Industr
Number of Accounts Amount
Rest of Industry

18 | State of Micro Enterprise Financing Report 2023
a signicant 39% of the accounts and 36% of the POS. This suggests their deep-
rooted connection to rural communities and commitment to nancial inclusion.
Following closely, PSU Banks underscore the role of traditional banking, holding
34% of accounts and 31% of the POS. Interestingly, NBFCs and Private Banks
have carved niches, with the former’s POS share (20%) outpacing its account share
(16%).
Figure 5: Lenders percentage Share in
Number of accounts of in Rural Area
Figure 6: Lenders percentage Share in POS of
in Rural Area
As seen in the accompanying pie charts, the rural segment showcases a dynamic
blend of institutional engagements, with each entity playing a pivotal role in the
nancial well-being of rural India.
In the semi-urban lending domain, PSU Banks have a prominent presence,
accounting for 38% of the accounts and 34% of the point-of-sale (POS)
transactions. Their leading share demonstrates a consistent engagement with semi-
urban businesses and residents, ensuring a steady ow of nancial services.
Figure 7: Lenders percentage Share in
Number of accounts of in Semi Urban Area
Figure 8: Lenders percentage Share in POS in
Semi Urban Area
Foreign
Bank, 0%
NBFC,
16%
PSU Bank,
34%
Pvt. Bank,
11%
Rest of
Industr,
39%
Foreign
Bank, 0%
NBFC,
20%
PSU Bank,
31%
Pvt. Bank,
13%
Rest of
Industry,
36%
Foreign
Bank, 0%
NBFC,
27%
PSU Bank,
59%
Pvt. Bank,
20%
Rest of
Industry,
50%
Foreign
Bank, 1%
NBFC,
39%
PSU Bank,
65%
Pvt. Bank,
36%
Rest of
Industry,
54%

State of Micro Enterprise Financing Report 2023 | 19
The ‘Rest of Industry’, likely consisting of smaller banks, cooperatives, and regional
institutions, also plays a signicant role, holding 32% of the accounts and 28% of
the POS. Their substantial contribution indicates the importance of diverse nancial
entities in serving the semi-urban populace. Meanwhile, NBFCs account for 17%
of the accounts with a slightly higher 20% of the POS, suggesting they might be
handling larger transactions on average. Private Banks, with 13% of accounts and
18% of POS, also indicate a trend toward more substantial transactions or loans
in this segment. Foreign Banks, in contrast, maintain a minimal footprint in both
accounts and POS, reecting their limited engagement or focus in this region.
Figure 9: Lenders percentage Share in Num-
ber of accounts of in Urban Area
Figure 10: Lenders percentage Share in POS
in Urban Area
In the urban lending sector, PSU Banks lead with 34% of the accounts and a
similar 33% in the point-of-sale (POS) transactions. This highlights their consistent
and widespread presence even in urbanized regions, ensuring businesses and
individuals have adequate access to nancial resources.
Following closely, the ‘Rest of Industry’ category accounts for 25% of the urban
accounts but has a notably lower share in POS at 14%. This could indicate their
engagement with a larger number of smaller accounts or transactions in urban
areas.
NBFCs and Private Banks exhibit a signicant presence in this segment. Both
hold nearly equal shares in POS at 26%, with NBFCs accounting for 20% of
the accounts and Private Banks slightly higher at 21%. Their similar POS shares,
despite the difference in account numbers, suggest that both might be handling
larger average transactions or loans.
Lastly, Foreign Banks maintain a minimal role in the urban accounts with a 0%
share but show a slight presence in the POS with 1%. This suggests that while they
might have fewer accounts, the average transaction or loan size could be larger, or
they might be focusing on niche segments within the urban landscape.
Foreign
Bank, 0%
NBFC,
20%
PSU
Bank,
34%
Pvt.
Bank,
21%
Rest of
Industry,
25%
Foreign
Bank, 1%
NBFC,
26%
PSU Bank,
33%
Pvt. Bank,
26%
Rest of
Industry,
14%

20 | State of Micro Enterprise Financing Report 2023
REPAYMENT
Overdue by Ticket Size
The data reveals distinct patterns in the distribution of overdue business loans
beyond 90 days for the year 2023. The category with loans ‘Up to 3 lakh’ emerges
as a notable concern, holding a dominant 12% share of overdue accounts. This
underscores a trend where smaller loans tend to have a higher likelihood of
becoming overdue.
Table 4: Overdue in Business Loans 90+ DPD as of March ‘23
Ticket size
Number of
A/c's
% of total
A/c's in
ticket size
POS `
Crore
% of total
POS in
ticket size
Average
POS in `
90+ DPD
Up to 3 lakh 1206 12% 8,789 17% 72,869
3 to 5 lakh 84 9% 2,978 11% 354,055
5 to 7 Lakh 25 6% 1.241 8% 488,536
7 to 10 lakh 33 6% 2,511 7% 765,223
10 to 15 lakh 16 5% 1,734 6% 1,055,853
15 to 20 lakh 11 5% 1,490 6% 1,364,942
20 to 25 lakh 8 5% 1,439 6% 1,807,095
Not Dened 6 2% 2,784 33% 4,625,046
Grand Total 1,390 11% 22,966 11% 165,242
A/c - Number of accounts in ‘000, Amt. – POS in ` Crore
Meanwhile, the ‘3 to 5 lakh’ category, which accounts for 9% of the overdue ac-
counts, only contributes 11% to the total overdue amount. This hints at a modestly
better repayment behaviour in this ticket size. Similarly, both the ‘5 to 7 lakh’ and
‘7 to 10 lakh’ categories each hold a 6% share of overdue accounts but contribute
slightly less, 8% and 7% respectively, to the overdue amount. This reinforces the
notion of relatively better repayment behaviours in these brackets. In the higher
ticket sizes, the ‘10 to 15 lakh’, ‘15 to 20 lakh’, and ‘20 to 25 lakh’ loan categories
demonstrate a consistent pattern. Each of these categories contributes nearly 6%
to the total overdue amount, suggesting a uniform risk prole across these larger
loan amounts.
Overdue by Location of Borrower
In assessing the nancial health across different geographies, it’s evident that loan
delinquency is a concern across all areas, albeit to varying degrees. The Rural sec-
tor, while accounting for 9% of loans that are 90+ days past due (DPD), mirrors
this trend in its total current balance with a similar 9% overdue.

State of Micro Enterprise Financing Report 2023 | 21
Table 5: 90+DPD in different Population Group
Rural - Urban A/c % Share Amount % Share
Rural
361 9% 4,517 9%
Semi Urban
703 12% 9,462 9%
Urban
302 11% 8,621 14%
Not Dened
24 15% 365 16%
Grand Total
1,390 11% 22,966 11%
A/c - Number of accounts in ‘000, Amt. – POS in ` Crore
This suggests a consistent repayment behaviour among its borrowers. Semi-Urban
regions exhibit a higher loan delinquency rate of 12%. However, a slightly more
encouraging picture emerges when considering the total current balance; only 9%
is overdue, hinting that larger loans or more creditworthy borrowers might be
more punctual in their repayments. In contrast, the urban sector presents a mixed
scenario. While the loan delinquency is at 11%, a substantial 14% of its total current
balance is overdue, indicating potential challenges with larger loans or higher
value borrowers. This underscores the importance of continuous monitoring and
proactive measures to mitigate the risk in urban settings.
Institution-Wise Overdue
In evaluating the nancial landscape across various lending institutions, distinct
patterns emerge regarding loan delinquency. Foreign Banks, despite having a rel-
atively small presence in terms of account numbers, face a signicant challenge
with 14% of their loans being 90+ days past due (DPD). This becomes even more
pronounced when analysing the amount, as a substantial 21% of their total loan
balance falls into this overdue category. This suggests potential credit risks associ-
ated with their lending policies or clientele.
Table 6: Institution wise 90+ DPD portfolio
Lending Institutions A/c % Share Amount % Share
Foreign Bank
2 14% 290 21%
NBFC 162 7% 5,641 12%
PSU Bank 797 17% 11,581 16%
Pvt. Bank 78 5% 1,216 3%
Re of Induries
350 8% 4,238 7%
Grand Total
1,390 11% 22,966 11%
A/c - Number of accounts in ‘000, Amt. – POS in ` Crore
Non-Banking Financial Companies (NBFCs), on the other hand, have a 7% loan
delinquency rate, which elevates to 12% when considering the overdue balance.
This disparity indicates that while fewer accounts are delinquent, the amounts

22 | State of Micro Enterprise Financing Report 2023
involved are considerably larger, pointing towards the possibility of higher-
value loans being at risk. Public Sector Undertaking (PSU) Banks demonstrate a
higher delinquency rate of 17% in terms of accounts, closely mirrored by a 16%
overdue amount. This alignment in percentages suggests a fairly consistent risk
prole across their loan portfolio. Private Banks showcase the most favourable
scenario, with only 5% of their loans being 90+ DPD, and a mere 3% of their total
loan balance being overdue. This may reect stringent credit policies or effective
recovery mechanisms in place. The ‘Rest of Industries’ segment, encompassing
other miscellaneous lenders, has an 8% loan delinquency rate, which translates to
7% of the overdue balance. This indicates a relatively balanced lending scenario in
this segment.
Performance of States in 90+ DPD Overdue
As of March 2023, the credit performance of various states in India, in relation to
POS under 90+ DPD, when juxtaposed with their share in the national population
as shown in following graph, presents an interesting perspective.
Figure 11: States percentage share in 90+DPD delinquency
States with negligible population contributions, such as Ladakh, Lakshadweep,
The Dadra & Nagar Haveli & Daman & Diu, Andaman & Nicobar Islands, and
others all the way up to Tripura, have varying levels of 90+ DPD POS percentages
but relatively low contributions to the overall 90+ DPD POS.
Himachal Pradesh, Uttarakhand, and Jammu & Kashmir, each with a 1% share in
the population, exhibit 13%, 9%, and 6% of their POS under 90+ DPD respectively.
Delhi, despite its 1% share in the population, has the highest percentage of POS
under 90+ DPD at 26%.
States like Haryana, Chhattisgarh, Punjab, Assam, Jharkhand, Kerala, Telangana,
and Odisha have a population share ranging from 2% to 3%. Among these,
0%
5%
10%
15%
20%
25%
30%
Lakshadweep
Ladakh
Andaman & Nicobar Islands
The Dadra & Nagar Haveli &…
Mizoram
Chandigarh
Sikkim
Arunachal Pradesh
Meghalaya
Nagaland
Goa
Tripura
Manipur
Delhi
Puducherry
Himachal Pradesh
Jammu & Kashmir
Assam
Chhattisgarh
Jharkhand
Uttarakhand
Odisha
Kerala
West Bengal
Gujarat
Punjab
Telangana
Bihar
Rajasthan
Andhra Pradesh
Tamil Nadu
Haryana
Madhya Pradesh
Maharashtra
Uttar Pradesh
Karnataka
%share in number of accounts %share in POS %share in population

State of Micro Enterprise Financing Report 2023 | 23
Chhattisgarh stands out with 12% of its POS under 90+ DPD and an equal
contribution to the overall 90+ DPD POS.
In the 4% to 6% population share range, Andhra Pradesh, Gujarat, Karnataka,
Rajasthan, Tamil Nadu, and Madhya Pradesh exhibit varied 90+ DPD POS
percentages. Rajasthan has an impressive 13% contribution to the overall 90+
DPD POS, despite having only 4% of its POS under the category.
West Bengal, Bihar, and Maharashtra, with population shares ranging from 8%
to 9%, display 17%, 12%, and 12% of their POS under 90+ DPD respectively.
Notably, Bihar contributes a signicant 10% to the overall 90+ DPD POS.
Uttar Pradesh, the state with the largest population share at 17%, has 15% of its
POS under 90+ DPD and contributes 7% to the overall 90+ DPD POS.
In summation, while states with larger populations do have signicant POS
under 90+ DPD, their contribution to the overall 90+ DPD POS isn’t always
proportional. The data suggests that credit discipline varies widely across states,
irrespective of their size or population.
BUSINESS LOAN SOURCING
Following graphs shows three years trend in sanctioned number of accounts and
amount for different ticket size buckets.
Figure 12: Three year trend of Number of
Accounts - Ticket wise
Figure 13: Three year trend of Sanction
Amount - Ticket wise
The dominant 0-3L bucket experienced a dip from 87% in 2021 to 80% in 2022
in account share, but rebounded slightly to 82% in 2023. The sanctioned amount,
however, consistently decreased over the years. This suggests that while a there is
large number of borrowers in the small loan bucket the overall amount sanctioned
0%
10%
20%
30%
40%
50%
60%
70%
80%
90%
100%
2021 2022 2023
0%
5%
10%
15%
20%
25%
30%
35%
2021 2022 2023

24 | State of Micro Enterprise Financing Report 2023
in this category is declining. It possibly indicates that lower ticket size borrowers
within this bracket are increasing.
The 3-5 lakh range showed steady growth in account share, while the sanctioned
amount remained stable. This indicates a consistent demand for loans in this
category without signicant changes in the average loan size. The 3-5 lakh and 3-5
lakh ranges both saw growth in account share, with the 7-10 lakh experiencing an
increase in sanctioned amounts too. This suggests a growing demand as well as
eligibility among borrowers for these middle ticket sizes. The 10-15 lakh category,
despite a stable account share, witnessed growth in the sanctioned amount, hinting
at a trend where borrowers in this bracket are taking larger loans within the range.
The 15-20 lakh and 20-25 lakh categories remained relatively stable, but the
slight uptick in sanctioned amounts over the three years suggests an increasing
condence or need among borrowers to take larger loans, even if the number of
such borrowers hasn’t grown signicantly.
The following table shows trend in loan distribution across various ticket sizes
in FY 2022-23. A vast majority, approximately 82% of the total loan accounts,
fall within the 0-3 lakh ticket size. This indicates a strong need for smaller loans
among borrowers. However, when we shift our focus to the sanction amounts, it’s
evident that while the 0-3 lakh ticket size contributes only about 27% of the total
sanctioned amount. The combined contribution of larger ticket sizes (from 3-25
lakh) is signicant. For instance, the 3-5 lakh, 7-10 lakh, and 10-15 lakh ticket sizes
each contribute between 12% to 15% of the total sanctioned amount, despite
having considerably fewer accounts.
Table 7: Business loan Sanction - Ticket Size Basis - FY 2022-23
Ticket Size A/c Amount
0-3L 4,568 33,141
3L-5L 348 14,695
5L-7L 162 9,538
7L-10L 204 17,828
10L-15L 132 16,427
15L-20L 82 14,635
20L-25L 63 14,328
Grand Total 5,558 120,592
A/c - Number of accounts in ‘000, Amt. – Sanction Amount in ` Crore
Demographics-Wise Sanction
The data on the location-wise sanction of loan amounts over three nancial
years (FY 21 to FY 23) sheds light on the evolving rural-urban divide in credit
distribution. Overall the share is consistent for last 3 years.

State of Micro Enterprise Financing Report 2023 | 25
Figure 14: Location-wise percentage share in Sanction amount - Three year trend
Rural areas, representing the agricultural sectors of the nation, experienced a
minor increase in loan sanctions from 23% in FY 21 to 24% in both FY 22 and
FY 23. This slight increment indicates a positive shift towards enhancing credit
facilities in rural sectors, possibly due to evolving policy measures or emerging
market opportunities.
Semi-urban regions, acting as transitional zones bridging rural and urban areas,
held a steady share of 47% throughout the three years. Their consistent share
underscores a robust and unwavering demand for credit, driven by a blend of both
agricultural and urban-centric activities.
In contrast, urban zones, the epicentres of industrial and service sector activities,
showed a marginal decline from 29% in FY 21 to 28% in the subsequent years.
This minor reduction could hint at a maturing credit demand in urban centres or a
strategic shift by nancial institutions.
In FY23, the loan sanction data underscores a stable lending landscape with semi-
urban areas leading at 47%, reecting their signicant and consistent role in the
economy. Rural areas followed with a 24% share, indicating ongoing support for
sectors typical to these regions without change from the previous year, suggesting
steady growth and investment in rural economies. Urban areas experienced a
nominal decrease to 28%, hinting at either a slight shift in economic dynamics
or a strategic redistribution of credit resources. Overall, the distribution points
towards a balanced credit dispersal with semi-urban areas remaining as pivotal
growth centres, rural areas holding rm to their share, and urban areas showing a
small but notable decrease in their slice of the loan sanction pie.
Table 8: Demographics-Wise Average Loan Sanction Trend
Demographics FY21 FY22 FY23
Not Dened 97,750 204,936 218,077
Rural 95,290 153,174 165,945
Semi Urban 117,618 187,403 207,558
Urban 221,832 252,338 264,373
1%
23%
47%
29%
1%
24%
47%
28%
1%
24%
47%
28%
0%
10%
20%
30%
40%
50%
ND Rural Semi Urban Urban
FY 21 FY 22 FY 23

26 | State of Micro Enterprise Financing Report 2023
Analysing the average loan sanctions across different demographics over the
last three nancial years reveals interesting trends. The Not Dened category
experienced the most dramatic increase in average loan sanctions from FY21 to
FY22 with an approximate growth of 109.65%, indicating a signicant surge in
loan approvals or an increase in the loan amounts during this period. However,
the growth from FY22 to FY23 slowed down to 6.41%, suggesting a possible
stabilization or a plateau in the growth of loan sanctions for this category.
In contrast, Rural and Semi-Urban areas showed consistent growth over the years.
Rural demographics experienced a notable increase of 60.75% in loan sanctions
from FY21 to FY22, followed by an 8.34% rise into FY23. Similarly, Semi-Urban
areas observed a 59.33% jump in the rst period and a 10.75% increase in the
second, showcasing a healthy upward trend in loan sanction amounts. Urban areas,
on the other hand, displayed a more modest growth pattern with a 13.75% increase
from FY21 to FY22 and a 4.77% increase from FY22 to FY23, indicating a more
gradual and steady increase in loan sanctions in these areas. Overall, while each
demographic show growth in loan sanctions, the rates suggest a diverse nancial
landscape with varying degrees of lending activity.
Institution wise Sanction
The percentage shares of loan sanctions by different nancial institutions across
various geographical locations highlight distinct strategies and market focuses.
Foreign banks show a strong urban emphasis with 73% of their loans sanctioned
in urban areas, complemented by 24% in semi-urban and a minimal 2% in rural
areas. This distribution likely reects their focus on urban markets, where there are
higher concentrations of corporate clients and afuent individuals.
Figure 15: Lenders percentage share in population groups
Meanwhile, Non-Banking Financial Companies (NBFCs) display a more distrib-
uted approach, with the largest share of their loans, 44%, going to semi-urban
areas, followed by 33% in urban and 22% in rural locales. NBFCs, known for
lling the gaps left by traditional banking services, appear to be capitalizing on the
diverse opportunities across these regions. Public Sector Banks (PSUs) prioritize
2%
22%
28%
19%
32%
24%
24%
44%
48%
46%
50%
47%
73%
33%
23%
35%
17%
28%
0%
10%
20%
30%
40%
50%
60%
70%
80%
Foreign Bank NBFC PSU Bank Pvt. Bank Rest of Industr Grand Total
Rural Semi Urban Urban

State of Micro Enterprise Financing Report 2023 | 27
rural (28%) and semi-urban (48%) areas, perhaps in line with their mandate for
inclusive banking and support for underbanked sectors, while their urban share is
relatively lower at 23%.
Private Banks allocate loans relatively evenly, with a slightly higher concentration
in semi-urban (46%) and urban areas (35%), and 19% in rural areas. This indicates
a balanced approach, serving a mix of clients from different sectors. The Rest
of the Industry, possibly including smaller banks and other nancial institutions,
leans heavily towards rural (32%) and semi-urban areas (50%), with a signicantly
lesser focus on urban regions (17%), which might suggest a strategic targeting of
niche markets or a specialization in serving less urbanized areas. Overall, the grand
total reects a diversied nancial landscape with 24% of loans in rural, 47% in
semi-urban, and 28% in urban areas, indicating a balanced distribution of credit
across the country.
CONCLUSION ON BL
a. Micro-Loan Dominance: A staggering 77% of business loans fall under the
‘Up to 3 lakh’ ticket size category. However, these numerous small loans
account for only 25% of the total Portfolio Outstanding (POS), reecting
the focused support towards nurturing small-scale MSMEs.
b. POS Disparity: There is a noticeable disparity in the POS contribution of
larger loans, with those above `7 lakh showing a gradual decrease, which
is economically sensible. Concerns arise particularly in the `5 to `7 lakh
bracket and `3 to `5 lakh brackets, where POS stands at 9% and 12%
respectively. Addressing this imbalance by aiming for a gradual reduction in
the POS share of these categories could indicate a healthier MSME sector.
c. Loan Performance Metrics: A signicant portion of the POS, specically
16% within the `0 to `3 lakh category, being in the 90+ DPD bracket is
of high concern. This high rate of delinquency necessitates a thorough
investigation into the underlying causes to mitigate risks.
d. NBFCs in the Lead: The data shows Non-Banking Financial Companies
(NBFCs) having a notable inuence in the business loan category, with a
36% share in total loan sanctions. This underscores the viability of the loan
category as a business venture, driven by competitive market forces rather
than solely by governmental policies.
e. Market Dynamics: The dynamic market behaviour with a shift towards
micro-loans and a diversied lender base. This suggests a need for adaptive
strategies from nancial institutions to accommodate the growing demand
for small ticket loans while managing risk and maintaining economic stability
within the MSME sector.

28 | State of Micro Enterprise Financing Report 2023
3. BUSINESS LOAN AGRICULTURE
B
usiness loans tailored for the agricultural sector play a crucial role in bolstering
the backbone of the rural economy, facilitating a wide array of commercial
activities integral to this industry. Designed to support ventures such as the trading
of agricultural products, dairy operations, and various other agri-businesses,
these loans are pivotal for the growth and sustainability of Agri MSMEs. The
comprehensive analysis provided in the accompanying report offers a detailed
look at the trends, progress, and overall performance of these credit facilities,
highlighting their impact on the agricultural micro, small, and medium enterprises
that drive this vital segment of the economy.
PORTFOLIO
Size-Wise Analysis
The following table number 9 for March 2023 outlines the distribution of busi-
ness loans across various ticket sizes, both in terms of the number of accounts
(in thousands) and the total amounts (in crore rupees). A closer look at the data
reveals that the smallest loan category, ‘Up to 3 lakh’, has the highest volume, with
111.22 lakh accounts. These accounts make up a substantial share of the total
number of loan accounts, signifying a high demand for small-scale nancing, pos-
sibly among micro-entrepreneurs or individuals with modest capital needs.
As we progress to larger loan sizes, the number of accounts diminishes. The ‘3
to 5 lakh’ range comprises 7.69 lakh accounts, holding a 5.48% share of the total
number of accounts, yet these loans account for 14.14% of the total loan amount,
indicating that medium-sized loans contribute signicantly to the nancial volume
of the portfolio. In stark contrast, the ‘20 to 25 lakh’ category, while representing
only 0.15% of the total number of accounts, accounts for a 2.02% share of the
total loan amount, which highlights the impact of larger loans on the nancial
portfolio.

State of Micro Enterprise Financing Report 2023 | 29
Table 9: Business Loan Agri, Ticket Size-Wise
Mar-23
Ticket size `
A/c Amount
Up to 3 lakh
11,122 107,578
3 to 5 lakh 769 28,470
5 to 7 Lakh
259 13,961
7 to 10 lakh
229 17,012
10 to 15 lakh
82 9,139
15 to 20 lakh
43 6,658
20 to 25 lakh
21 4,072
Not Dened 1,496 14,121
Grand Total 14,020 201,012
A/c - Number of accounts in ‘000, Amt. – POS in ` Crore
Overall, the aggregate data with 140.2 lakh accounts and a total amount of
201,012 crores suggest that while a larger number of smaller loans dominate the
count, the nancial share is more evenly distributed across different loan sizes.
This reects a balanced lending ecosystem catering to a wide range of nancial
needs, from small to large scales of business operations.
Which Bucket is Full?
The following tables show the percentage share of the number of accounts by
ticket size and the percentage share of portfolio outstanding by ticket size from
March 2021 to March 2023, we can draw several insights into the behaviour of
borrowers/FIs and the dynamics of the loan portfolio.
Table 10: Trend in BL Agri Loans - Ticket Size Basis
Ticket Size
Bucket
% share of the number of
accounts
% share of Portfolio
outstanding
Mar-21 Mar-21 Mar-22 Mar-23 Mar-22 Mar-23
Up to 3 lakh
82.57% 59.99% 60.32% 53.43% 83.40% 79.98%
3 to 5 lakh 5.27% 14.50% 14.31% 14.14% 5.36% 5.41%
5 to 7 Lakh
1.55% 6.30% 6.27% 7.00% 1.58% 1.83%
7 to 10 lakh
1.28% 6.97% 7.24% 8.45% 1.35% 1.60%
10 to 15 lakh
0.44% 3.84% 3.90% 4.59% 0.47% 0.58%
15 to 20 lakh
0.21% 2.51% 2.69% 3.32% 0.23% 0.30%
20 to 25 lakh
0.10% 1.52% 1.60% 2.15% 0.11% 0.15%
Not Dened
8.57% 4.37% 3.68% 6.93% 7.49% 10.16%

30 | State of Micro Enterprise Financing Report 2023
In both tables, there is a noticeable trend in the ‘Up to 3 lakh’ category, which sees
a decline in both the number of accounts (from 82.57% to 79.98%) and the share
of portfolio outstanding (from 60% to 53%) over the period. This suggests a shift
away from the smallest loan sizes, both in terms of the number of loans and the
total loan value, which could be indicative of borrowers graduating to higher loan
brackets as their businesses grow or as they require more signicant funds for their
activities.
The stability in the ‘3 to 5 lakh’ segment across both tables, holding steady at 14%
for the share of portfolio outstanding and around 5% for the number of accounts,
points to a consistent borrowing pattern in this ticket size. However, an increase in
both the number of accounts and the portfolio share in the ‘5 to 7 lakh’ and ‘7 to
10 lakh’ brackets suggests that a segment of borrowers is opting for larger loans,
which could reect an expansion of business operations or increased capital needs.
Interestingly, the ‘10 to 15 lakh’ and ‘15 to 20 lakh’ categories show a modest
increase in the share of portfolio outstanding compared to the number of
accounts, indicating that while there may not be a large number of loans in these
brackets, the loans that are taken out are for more considerable amounts. This is
also reected in the consistent share of the portfolio outstanding for larger ticket
sizes, despite their lower prevalence in the number of accounts.
Overall, the analysis of these two tables suggests a shift in the agricultural loan
landscape, with a move towards larger loan amounts over time, both in terms of
the number of loans being taken out and the total value of loans outstanding.
This shift could reect broader economic trends, such as ination or the
increasing scale of agricultural operations. It also highlights the importance
of offering a diverse range of loan products to meet the evolving needs of
borrowers in the sector.
State-Wise Distribution
The gure 16 represent states percentage share in of number of loans and POS in
the bar and population in the line graph.

State of Micro Enterprise Financing Report 2023 | 31
Figure 16: State wise percentage of share of Business Loan Agri and Population
The data from the above graph reects the disparities in agricultural business loans
across Indian states, with particular insights into the number of loan accounts
and Portfolio Outstanding (POS) relative to the states’ population shares. States
like Uttar Pradesh and Telangana, for example, show a robust engagement in
agricultural nancing. Uttar Pradesh stands out with 15.9% of loan accounts
and 12.8% of the POS, signicantly higher than its 13% share of the nation’s
population. This suggests a strong agricultural sector within the state that has
substantial nancing needs.
On the other side of the spectrum, states such as Maharashtra and Karnataka,
despite having smaller population shares, exhibit higher percentages of both
loan accounts and POS. Maharashtra, for instance, has a 9% population share
but accounts for 5.7% of loan accounts and 7.6% of the POS. The higher loan
percentages might indicate a focus on larger or more valuable agricultural loans in
these states, pointing to a more developed or commercially oriented agricultural
nancing environment.
Conversely, Bihar presents an interesting case. It has a high population share at 9%,
but its agricultural loan accounts and POS stand at 2.5% and 1.9%, respectively.
This discrepancy could be indicative of challenges such as lower access to credit,
a smaller number of large-scale agricultural operations, or a reliance on informal
lending mechanisms within the state.
The data highlights a complex relationship between a state’s population share and
its agricultural loan distribution, inuenced by various factors including the state’s
economic structure, the prominence of agriculture within the state’s economy,
and the accessibility to nancial services. This variability underscores the need for
tailored agricultural nancing strategies that consider the unique economic and
0.0%
2.0%
4.0%
6.0%
8.0%
10.0%
12.0%
14.0%
16.0%
18.0%
Lakshadweep
The Dadra & Nagar Haveli…
Chandigarh
Andaman & Nicobar Islands
Mizoram
Sikkim
Arunachal Pradesh
Nagaland
Tripura
Ladakh
Manipur
Delhi
Goa
Puducherry
Meghalaya
Himachal Pradesh
Uttarakhand
Assam
Jammu & Kashmir
Jharkhand
Chhattisgarh
Odisha
Punjab
Bihar
West Bengal
Rajasthan
Madhya Pradesh
Kerala
Gujarat
Haryana
Maharashtra
Karnataka
Andhra Pradesh
Tamil Nadu
Telangana
Uttar Pradesh
%share number of Accounts %share POS %share in population

32 | State of Micro Enterprise Financing Report 2023
agricultural landscapes of each state to ensure equitable access to credit across
India’s diverse agricultural sector.
Institutions Wise Details
The following bar graph depicts the percentage share of lending institutions in the
agricultural sector.
Figure 17: Percent of Share - Lending institution in BL Agri
Public Sector Banks (PSU Banks) dominate the market, holding the majority share
of both the number of accounts and the POS. The percentage of the number of
accounts is slightly higher than that of POS, indicating that while PSU Banks have
a vast customer base, the average loan size per account might be smaller compared
to other institutions.
Private Banks, while having a smaller footprint in terms of the number of accounts
when compared to PSU Banks, show a higher share in the POS. This suggests
that Private Banks might be focusing on larger loans, potentially catering to well-
established agribusinesses or larger-scale farming operations that require more
signicant nancial inputs.
The category of Rest of Industry which could include Non-Banking Financial
Companies (NBFCs), Cooperatives, and other nancial institutions, represents a
modest share in both the number of accounts and POS. Notably, their share of
POS is slightly higher than their share of the number of accounts, which could
imply that these institutions also tend to issue larger loans on average, although
they serve fewer customers than the banks.
NABARD (National Bank for Agriculture and Rural Development), despite its
pivotal role in agricultural development, shows minimal direct involvement in
terms of the percentage of both the number of accounts and POS. This could
reect NABARD’s role as a renancing and development institution rather than
a direct lender, and its efforts might be more focused on policy development and
capacity building in the agricultural sector.
0.1%
17.3%
35.7%
14.0%
32.9%
0.7%
21.6%
32.8%
19.1%
25.8%
0.0%
5.0%
10.0%
15.0%
20.0%
25.0%
30.0%
35.0%
40.0%
Foreign Bank NBFC PSU Bank Pvt. Bank Rest of Industr
Number of Accounts Amount

State of Micro Enterprise Financing Report 2023 | 33
Overall, the graph underscores the central role of PSU Banks in agricultural
lending, the signicant presence of Private Banks in terms of loan amounts,
and the complementary roles of other nancial entities in the sector. The
analysis of this data can inform policy decisions, strategic planning for nancial
institutions, and the targeted design of nancial products for the agricultural
sector.
Rural/Urban Distribution
The table provides a comparative snapshot of the percentage share of a Business
Loan Agriculture against the percentage share of the population across different
geographic classications—rural, semi-urban, and urban areas.
In rural areas, there is a slight decrease from 48% of the population to 45% in the
BL Agriculture. This 3% drop might suggest a lower presence or uptake of the
service or metric being measured in rural regions compared to their demographic
weight. This could be due to various factors such as limited access, lower demand,
or other socio-economic barriers.
Table 11: % Share of population group on BL Agri
Population Group
% share of Population group in
Number of accounts
% share of Population
group in POS
Not Dened
2% 2%
Rural 48% 45%
Semi-Urban 45% 47%
Urban 4% 6%
For semi-urban areas, the opposite is true; they represent 45% of the population
but account for 47% in the BL Agriculture This over-representation could indicate
a higher concentration or adoption of the service or metric in these areas, possibly
because these regions strike a balance between rural accessibility and urban facilities.
The urban category shows the most signicant difference, with only 4% of the
population share but accounting for 6% of the BL Agri. This suggests a higher
penetration or relevance of the measured service or metric in urban areas, which
could be attributed to higher income levels, greater availability, or a targeted
approach by service providers toward the urban population.
Overall, the disparities between the geographic classications in the table could
reect inequalities in service provision or economic opportunities between
rural, semi-urban, and urban areas. These differences are crucial for policy
formulation, resource allocation, and targeted interventions by service providers
to ensure equitable access and utilization across different population segments.

34 | State of Micro Enterprise Financing Report 2023
Institutions Share in Different Demographics
Rural Portfolio
The pie charts depict the percentage shares of different nancial entities in rural
areas in two different categories: the number of accounts and the presence in
Point of Sale (POS) locations.
For the number of accounts, Public Sector Undertakings (PSU) Banks hold the
majority with 61%, indicating a strong preference or reliance on government-
owned banks in rural areas for opening accounts. Private Banks account for 7%,
while Non-Banking Financial Companies (NBFCs) have a minimal share of 1%.
The rest of the industry, which may include cooperatives, small nance banks, and
other nancial institutions, accounts for 31%. This suggests a signicant presence
of diverse banking options in rural areas, but a dominant preference for PSU
Banks.
The second chart, illustrating the percentage share in POS in rural areas, shows a
slightly different distribution. PSU Banks still lead with a strong majority at 63%,
slightly up from their share of accounts, indicating that they not only hold the
majority of accounts but also dominate the POS services in these areas. Private
Banks have a slightly higher share here at 8% compared to their share in accounts,
while NBFCs have no share at all. The rest of the industry holds 28%, which is a
minor decrease from their share in the number of accounts.
The near absence of NBFCs in the POS share could imply that NBFCs are either
not focused on or not permitted to provide POS services in rural areas. Overall,
the data suggests that PSU Banks are the backbone of nancial services in rural
areas, with a signicant lead over private entities in both the number of accounts
and POS services. Private Banks and other industry players have a smaller but
Figure 18: Percent of Share in Number of Accounts
in Rural
Figure 19: Percent of Share in POS Rural
NBFC,
1%
PSU Bank,
61%
Pvt. Bank,
7%
Rest of
Industry,
31%
NBFC,
0%
PSU
Bank,
63%
Pvt. Bank,
8%
Rest of
Industry,
28%

State of Micro Enterprise Financing Report 2023 | 35
notable presence, which may indicate competitive services or niche markets within
rural nancial ecosystems.
Semi-Urban Portfolio
The following pie charts represent the distribution of the percentage share in the
number of accounts and Points of Sale (POS) in semi-urban areas, segmented by
different types of banking institutions.
In the rst chart, which shows the percentage share in the number of accounts,
Public Sector Undertakings (PSU) Banks again have the majority with 63%,
demonstrating their prominence in semi-urban banking as well. Private Banks
hold a share of 11%, and Non-Banking Financial Companies (NBFCs) make up a
small fraction at 1%. The Rest of the Industry, which could include micronance
institutions, cooperatives, and other small nancial entities, represents 25% of the
accounts. This indicates that while PSU Banks are the leading choice for account
holders, there is also a considerable portion of the population in semi-urban areas
that opt for various other nancial service providers.
The second chart details the percentage share of POS in semi-urban areas. PSU
Banks have a slightly larger share of 68% in POS services compared to their share
of accounts, suggesting their strong position in the market for daily nancial
transactions. Private Banks maintain an 11% share, identical to their share in the
number of accounts, which may indicate a consistent customer base for both
banking and transactional services. Notably, NBFCs do not have a presence in
the POS segment, hinting at a lack of involvement or inability to compete in this
space. The Rest of the Industry accounts for 21%, showing a slight decline from
the share in the number of accounts.
NBFC,
1%
PSU Bank,
63%
Pvt. Bank,
11%
Rest of
Industry,
25%
NBFC, 0%
PSU Bank,
68%
Pvt. Bank,
11%
Rest of
Industry,
21%
Figure 20: Percent of Share of Number of Accounts
in Semi-Urban
Figure 21: Percent of Share in POS in Semi Urban

36 | State of Micro Enterprise Financing Report 2023
These charts imply that PSU Banks are the dominant nancial service providers
in semi-urban areas, not just in terms of account holding but also in POS
transactions. Private Banks and other industry players have a relatively consistent
but smaller presence across both charts. The complete absence of NBFCs from
the POS segment might reect regulatory restrictions, strategic choices, or
competitive disadvantages in semi-urban markets. The data suggests a stable
market distribution with PSU Banks at the forefront, followed by a modest but
persistent participation from Private Banks and other nancial institutions.
Urban Portfolio
The following pie charts illustrate the distribution of the percentage share in the
number of accounts and Point of Sale (POS) services among various nancial
institutions in urban areas.
NBFC,
1%
PSU
Bank,
67%
Pvt.
Bank,
20%
Rest of
Industry,
11%
NBFC,
0%
PSU
Bank,
66%
Pvt.
Bank,
21%
Rest of
Industry,
13%
In the rst chart, which details the percentage share in the number of accounts,
Public Sector Undertakings (PSU) Banks have a dominant presence with 67% of
the market share, indicating a strong consumer preference or trust in government-
owned banks within urban settings. Private Banks hold a fth of the market at
20%, which suggests a signicant but smaller role compared to PSU Banks. Non-
Banking Financial Companies (NBFCs) have a very small share at 1%, indicating
a marginal presence in the urban account market. The rest of the industry, which
likely includes small nance banks, cooperative banks, and other nancial entities,
accounts for 11% of the market share, pointing towards a moderate diversity of
institutions that urban customers use for banking.
The second chart shows the percentage share of POS in urban areas. Here, PSU
Banks have a slightly lesser share at 66%, which is still the majority, but indicates
Figure 22: Percent of Share of Number of Accounts
in Urban
Figure 23: Percent of Share of POS in Urban

State of Micro Enterprise Financing Report 2023 | 37
a small shift in market dynamics from account holding to transactional services.
Private Banks have a marginally higher share in POS services at 21%, suggesting
that their infrastructure for POS might be more utilized or preferred compared to
their share of account holdings. The rest of the industry also sees a slight increase
in share at 13%, while NBFCs have no share in the POS market, which might
reect a strategic focus away from POS services or a competitive disadvantage in
this area.
These charts collectively suggest that while PSU Banks are the predominant
entities in both the number of accounts and POS services in urban areas, there
is a slight shift in market shares when it comes to transactional services. Private
Banks and the rest of the industry appear to have a somewhat stronger presence
in POS services compared to account holdings. The absence of NBFCs in the
POS services indicates their limited role or absence in this particular urban
nancial service market.
REPAYMENT
Overdue by Ticket Size
The following table presents a comprehensive view of the overdue agricultural
business loans segmented by ticket size for accounts that are more than 90 days
past due. The most striking aspect of the data is the high proportion of overdue
accounts in the ‘Up to 3 lakh’ category, which constitutes 21% of the total number
of accounts and 22% of the total overdue amount in this segment. This suggests a
signicant risk concentration in the smallest loan bracket, implying that such loans
are more likely to become overdue compared to larger loans.
Table 12: 90+ DPD delinquency - Ticket Size basis
Ticket size
Number
of A/c's
% of total
A/c's in
ticket size
POS Rs.
Crore
% of total
POS in
ticket size
Average
POS in `
90+ DPD
Up to 3 lakh
2,280 21% 24,066 22% 105,551
3 to 5 lakh 164 21% 7,449 26% 452,854
5 to 7 Lakh 52 20% 3,373 24% 647,933
7 to 10 lakh 42 19% 3,698 22% 872,211
10 to 15 lakh 16 20% 2,125 23% 1,301,458
15 to 20 lakh 7 17% 1,233 19% 1,735,275
20 to 25 lakh 4 20% 931 23% 2,214,866
Not Dened 127 8% 676 5% 53,331
Grand Total
2,693 19% 43,551 22% 161,699
A/c - Number of accounts in ‘000, Amt. – POS in ` Crore

38 | State of Micro Enterprise Financing Report 2023
Moving up the loan sizes, the ‘3 to 5 lakh’ and ‘5 to 7 lakh’ categories account for
21% and 20% of the overdue accounts, respectively. However, their contributions
to the total overdue amounts are disproportionately higher at 26% and 24%. This
discrepancy indicates that while fewer accounts in these brackets are overdue, the
overdue ones tend to have larger outstanding balances. In contrast, the ‘7 to 10
lakh’ category, despite having a lower percentage of overdue accounts at 19%,
contributes a relatively high 23% to the total overdue amount, pointing towards a
smaller number of accounts with signicantly larger individual overdue balances.
The higher ticket sizes, from ‘10 to 15 lakh’ to ‘25 to 50 lakh,’ show a decrease in
the number of overdue accounts, ranging from 20% down to 8%. However, their
contribution to the overdue amount remains relatively stable, indicating that while
there are fewer overdue accounts in these segments, the overdue amounts are
substantially larger. This uniformity in contribution to the total overdue amount
across these higher loan brackets suggests that as the loan sizes increase, the
frequency of overdue accounts decreases, but the impact of each overdue account
becomes more pronounced.
Overdue by Location of Borrower
The following table presents data on agricultural business loans that are over 90
days past due, categorized by the rural-urban classication of the account holders.
The analysis shows that the Not Dened category holds the largest percentage
share of overdue accounts at 22%, and an even more signicant 27% of the total
overdue amount. This suggests that a signicant portion of the overdue amount
comes from accounts where the rural-urban status is unspecied or not determined.
Table 13: 90+ DPD Delinquency - Population group wise
Rural-Urban A/c % Share Amount % Share
Not Dened 76 22% 1,177 27%
Rural 1,283 19% 19,150 21%
Semi-Urban 1,262 20% 21,535 23%
Urban 73 12% 1,689 14%
Grand Total 2,693 19% 43,551 22%
A/c - Number of accounts in ‘000, Amt. – POS in ` Crore
In rural areas, which typically are signicant in agriculture-related activities, there are
1,283 accounts representing 19% of the total overdue accounts and contributing
21% to the overdue amount. This indicates a relatively high level of engagement
in agri-businesses in rural areas with a proportional share of the overdue amounts.
Semi-urban areas follow closely with 1,262 accounts, accounting for 20% of the
total overdue accounts and 23% of the overdue amount. This implies that semi-

State of Micro Enterprise Financing Report 2023 | 39
urban areas, which may benet from a mix of urban and rural advantages, also
have a substantial share of past-due accounts, with a slightly higher propensity
towards larger overdue amounts.
Urban areas have the smallest share of overdue accounts at 12% and overdue
amounts at 14%. The lower percentages may reect less involvement in agricultural
activities or perhaps better access to nancial management resources, leading
to a lower incidence of overdue loans. Across all categories, the total number
of accounts is 2,693 with a 19% share of overdue accounts and a 22% share of
the total overdue amount. This overall distribution suggests that while overdue
loans are present across all categories, there is a higher concentration of overdue
amounts in accounts without a clear rural or urban designation, which may point
towards a need for better classication or targeted nancial services in these areas.
Institution wise Overdue
The following table categorizes agricultural business loans that are more than 90
days overdue by the type of nancial institution. Here is a detailed analysis:
Table 14: Lending institution wise 90+ DPD delinquency
FI A/c % Share Amount % Share
NBFC 40 22% 220 29%
PSU Bank 1,993 23% 32,672 25%
Pvt. Bank 111 9% 2,841 14%
Rest of Industry 550 14% 7,817 16%
Grand Total 2,693 19% 43,551 22%
A/c- Number of accounts in ‘000, Amt. – POS in ` Crore
Non-Banking Financial Companies (NBFCs) have the fewest accounts at 40, yet
they have the highest percentage of both the number of accounts overdue (22%)
and the amount overdue (29%). This suggests that while NBFCs have a smaller
footprint in the agri-business sector, their exposure to overdue loans is dispropor-
tionately high relative to the number of loans they have issued.
Public Sector Banks (PSU Banks) have a substantial presence with 1,993 overdue
accounts, making up 23% of the total overdue accounts and 25% of the overdue
amount. This is indicative of their signicant role in agricultural nancing. Despite
this, their share of overdue amounts is slightly higher than their share of accounts,
pointing to a larger average overdue amount per account compared to private
banks.
Private Banks, with 111 accounts, have a relatively small percentage of overdue
accounts at 9%, and a correspondingly low percentage of the overdue amount
at 14%. This may reect a more conservative lending strategy in the agricultural
sector or more effective loan recovery processes.
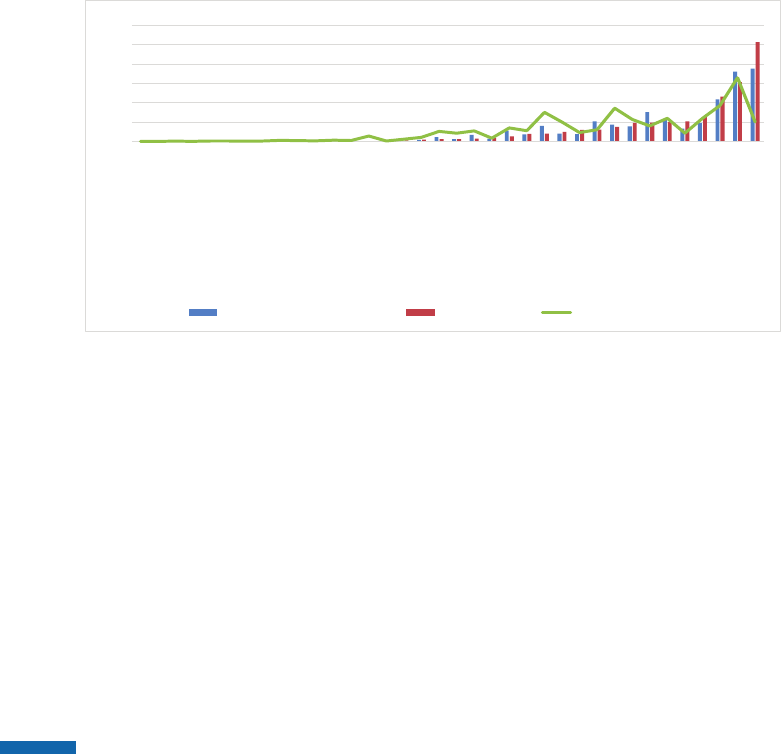
40 | State of Micro Enterprise Financing Report 2023
The Rest of Industry category, which could include cooperative banks and other
nancial institutions, shows 550 overdue accounts representing 14% of the over-
due accounts and 16% of the overdue amount. This distribution suggests a mod-
erate level of risk in this sector.
Overall, the data reects a total of 2,693 overdue accounts with a 19% share and a
total overdue amount that comprises 22% of the portfolio in value. The variations
across different types of institutions highlight diverse lending practices and risk
management strategies within the agricultural nance sector. The higher percent-
age of overdue amounts relative to the share of overdue accounts for NBFCs and
PSU Banks might be an area of concern, signaling potential issues in loan perfor-
mance and requiring targeted intervention to manage risks effectively.
Performance of States in 90+ DPD Overdue
The following table categorizes agricultural business loans that are more than 90
days overdue by the type of nancial institution. Here is a detailed analysis:
Figure 24 States Percent of contribution in 90+ DPD delinquency
0%
5%
10%
15%
20%
25%
30%
Lakshadweep
Ladakh
Andaman & Nicobar Islands
The Dadra & Nagar Haveli &…
Mizoram
Chandigarh
Sikkim
Arunachal Pradesh
Meghalaya
Nagaland
Goa
Tripura
Manipur
Delhi
Puducherry
Himachal Pradesh
Jammu & Kashmir
Assam
Chhattisgarh
Jharkhand
Uttarakhand
Odisha
Kerala
West Bengal
Gujarat
Punjab
Telangana
Bihar
Rajasthan
Andhra Pradesh
Tamil Nadu
Haryana
Madhya Pradesh
Maharashtra
Uttar Pradesh
Karnataka
%share in number of accounts %share in POS %share in population
The gure number 24 illustrates the pattern in agricultural loan delinquencies across
different states in India. It is evident from the graph that there is a considerable
variation in the percentage contribution to the number of accounts, the percentage
share in point of sale (POS), and the percentage share in the population for loans
that are past due over 90 days.
Uttar Pradesh shows a prominent presence with 18% in the number of accounts,
which is closely aligned with its POS share (15%) and population share (17%).
This indicates that the state’s agricultural loan delinquency is proportionate to its
population, which may be reective of the state’s agricultural dependency and the
scale of its farming sector. The high number of delinquent accounts could be due

State of Micro Enterprise Financing Report 2023 | 41
to various factors including agricultural yield variability, market prices for crops,
and the effectiveness of local nancial institutions in managing credit risk.
Karnataka and Maharashtra present contrasting scenarios. Karnataka has a
disproportionately high percentage in the number of accounts (19%) and POS
share (19%) compared to its population share (12%), suggesting a signicant
impact of overdue loans on the state’s agricultural sector. This could point to a
higher risk prole for lenders in the state or a larger agricultural base that is not
commensurate with the overall population. In contrast, Maharashtra maintains a
balance across all three indicators with 5% in the number of accounts, POS share,
and population share, indicating that loan delinquency is in line with the state’s
population and possibly, its agricultural activity.
Rajasthan, Bihar, and Tamil Nadu are notable for their higher percentages in the
number of accounts and POS share relative to their population percentages. This
implies that these states have a higher incidence of loan delinquency that could be
inuenced by regional challenges such as droughts, oods, or economic factors
that affect farmers’ ability to repay loans.
Interestingly, states such as Gujarat, Punjab, and Telangana exhibit lower
percentages in all categories, which might suggest more robust agricultural loan
repayment behaviours, better nancial health among farmers, or less reliance on
agricultural loans. This could be indicative of diverse economic activities beyond
agriculture or effective state policies in managing agricultural credit.
Finally, several states and union territories like Ladakh, Lakshadweep, Andaman &
Nicobar Islands show no contribution in any category. This could be due to the
absence of signicant agricultural activity, the effectiveness of loan recovery, or
simply a lack of data for these regions. The zero percentage could also result from
a very small number of accounts relative to the national gures, which rounds
down to zero when expressed as a percentage.
Overall, this data reects the complex interplay between agricultural activity,
nancial management, and demographic factors that inuence the distribution of
past-due agricultural loans across India. Understanding these dynamics is crucial
for policymakers and nancial institutions aiming to devise strategies to manage
credit risk and support farmers effectively.
SOURCING
The following data table for agricultural business loan sanctions delineates a clear
stratication across different loan ticket sizes. Here’s an analysis incorporating the
provided gures:

42 | State of Micro Enterprise Financing Report 2023
Table 15: Ticket Size wise Sanction in BL Agri
Ticket Size Number of A/c in
thousand
Sanction Amount in
` crore
Avg. Sanction
Amount `
0-3L 4,845 48,080 99,234
3L-5L 242 9,816 405,172
5L-7L 87 5,256 601,738
7L-10L 75 6,687 887,503
10L-15L 25 3,193 1,277,552
15L-20L 13 2,439 1,824,831
20L-25L 6 1,402 2,335,742
Grand Total 5,403 76,874 142,292
In the smallest loan category, ‘0-3 lakh’, there is a substantial number of accounts
at 4,845 thousand, with the total sanction amount standing at 48,080 crores. This
segment’s average sanctioned amount is `99,234 reecting a targeted approach to
supporting a vast number of small-scale farmers and agri-businesses with modest
loan amounts.
For the 3-5 lakh ticket size, there are 2.42 lakh accounts with a sanction amount
of 9,816 crores, and the average sanctioned amount increases signicantly to 4.05
lakh. This indicates that as the loan amount bracket increases, the number of
accounts drops, but the average loan size per account grows, suggesting a greater
capital allocation to medium-sized agricultural operations that may have more
substantial nancial needs.
The 5-7 lakh and 7-10 lakh loan categories have 87 and 75 thousand accounts
respectively, with sanction amounts of 5,256 and 6,687 crores, and average
sanctions of 6.01 lakh and 8.87 lakh. These higher average amounts per account
indicate that nancial institutions are providing larger loans to fewer, likely more
established agricultural businesses that can handle and justify larger investments.
In the upper loan categories, 10-15 lakh, 15-20 lakh and 20-25 lakh the number of
accounts drops to 25, 13, and 6 thousand respectively, yet the average sanctioned
amounts per account are considerably larger: 12.77 lakh, 18.24 lakh and 23.25 lakh.
This shows a concentration of high-value loans among a smaller cohort of bor-
rowers, possibly representing large-scale agricultural enterprises with signicant
operational needs and the capacity to manage large-scale funding.
Overall, the data reects a nancial landscape where smaller-scale farmers are
supported en-masse with smaller loan amounts, while larger-scale operations
receive higher value loans, albeit in much fewer numbers. This stratication could
reect an attempt to balance risk while providing adequate support across the
spectrum of agricultural business sizes.

State of Micro Enterprise Financing Report 2023 | 43
Demographics-Wise Sanction
The following table highlights the distribution of agricultural loan sanctions in
scal year 2023 across various population groups, providing insights into the
lending patterns in the agricultural sector.
Table 16: Demographics-wise sanction of BL Agri
Population
Group
Number of A/c in
thousand
Sanction Amount in
` crore
Avg. Sanction
Amount `
Not Dened
82 1,353 165,903
Rural
2,491 32,670 131,160
Semi-Urban
2,295 33,370 145,414
Urban
535 9,481 177,103
Grand Total
5,403 76,874 142,292
In rural areas, where traditional farming is most prevalent, there are 24.91 lakh
accounts with a total sanctioned amount of 32,670 crores. The average loan
sanction in this segment is 13.11 lakh, which is a substantial gure considering the
typically smaller scale of rural farming operations. This could indicate a strategic
focus on enhancing rural agricultural productivity and sustainability.
Semi-urban areas account for 22.95 lakh accounts, with a total sanctioned amount
slightly higher at 33,370 crores, and an average loan sanction of 1.45 lakh. This
higher average loan amount might reect the transitionary nature of semi-urban
areas where agricultural operations could be larger and more diverse, potentially
including a mix of farming and processing activities that are closer to urban
markets.
Urban areas have the smallest number of accounts at 5.35 lakh but a signicant
total sanctioned amount of 9,481 crores, leading to an average loan sanction of
1.44 lakh. This high average suggests that urban loans may support more capital-
intensive agricultural activities, such as urban farming initiatives, supply chains, or
processing facilities that require larger investments.
Demographic Trend
The following bar chart represents the percentage share of population groups in
sanction amounts for the last three scal years, with the groups divided into Rural,
Semi-Urban, and Urban and not dened.
Over the three scal years, the Rural sector consistently holds the largest share of
the sanctioned amount, peaking at 43% in FY 2021, decreasing slightly to 42% in
FY 2022, and maintaining a majority at 47% in FY 2023. This trend indicates the

44 | State of Micro Enterprise Financing Report 2023
continued importance of the rural sector in agricultural lending, which is consistent
with the larger population and the predominance of agriculture in these areas.
The Semi-Urban group follows a similar pattern to Rural, starting with a 44% share
in FY 2021, which slightly decreases to 40% in FY 2022 before increasing again
to 46% in FY 2023. The Semi-Urban areas are signicant for agricultural lending,
likely due to a combination of agricultural activities and proximity to urban markets
that might support larger or more diversied agricultural operations.
The Urban group shows the smallest share across all three scal years, with a
decreasing trend from 3% in FY 2021 to 1% in FY 2023. This reects the lower
prevalence of agricultural activities in urban settings and possibly a higher
concentration of other types of businesses that may not require agricultural
nance.
The Not Dened category remains consistent with a 2% share across all three
scal years, suggesting a stable but small proportion of agricultural lending to
entities that are not classied within the traditional rural-urban spectrum. This
category might include specialized or large-scale agricultural operations.
In summary, the data indicates a strong focus on agricultural lending in Rural
and Semi-Urban areas, aligning with where agricultural activities predominantly
occur. The Rural segment seems to be receiving a slightly increasing share of
loan sanctions, while Semi-Urban areas also demonstrate signicant and growing
investment. The consistent but low percentage in the Not Dened category
suggests a niche market for agricultural loans, whereas the Urban sector is the
least focused area for agricultural lending, as expected due to the urban setting.
Performance of Financial Institutions in Different Population Groups
The following bar chart illustrates the distribution of nancial institutions (FIs)
loan sanctioning percentages across different population groups: Not Dened,
Rural, Semi-Urban, and Urban, as well as an overall category. It compares the
lending behaviour of various types of FIs: NBFC (Non-Banking Financial
Company), PSU Bank (Public Sector Bank), Pvt. Bank (Private Bank), and the Rest
of Industry, which could include cooperative banks, micronance institutions, and
other lenders.

State of Micro Enterprise Financing Report 2023 | 45
The data shows that PSU Banks have a substantial presence across all population
groups, with the highest percentage in Rural (63%) and Semi-Urban (60%) areas,
reecting their mandate to support agriculture and rural development. Their
participation is lower in Urban areas (11%) and the Not Dened category (37%),
which may include specialized agricultural or agri-business operations not specic
to any region.
NBFCs show a more even distribution, with a signicant 55% in the Not Dened
category, which could indicate their exibility and focus on niche markets that may
not be served by traditional banks. They also have a notable presence in Urban
areas (17%), potentially reecting their ability to cater to urban-centric agricultural
businesses or small-scale urban farming initiatives.
Private Banks have a moderate presence in Rural (13%) and Semi-Urban (10%)
areas and a smaller presence in Urban (4%) and Not Dened (5%) groups. This
distribution suggests a selective approach to agricultural lending, possibly focusing
on more commercially viable agricultural enterprises with lower risk proles.
The Rest of Industry category has its highest percentages in Rural (20%) and
Semi-Urban (16%) areas, which might represent other lending institutions like
cooperative banks and micronance institutions that typically focus on these
segments for agricultural nance.
Overall, each type of FI has a unique lending prole that reects its strategic
focus, risk appetite, and operational mandates. PSU Banks dominate rural and
semi-urban lending, likely due to their role in supporting government initiatives for
agricultural and rural development. NBFCs appear to ll gaps in the market not
covered by traditional banks, especially in the Not Dened and Urban categories.
Private Banks and the Rest of Industry have more moderate shares, indicating a
Figure 25: Percentage Share of FI’s in Different Population groups
0%
1%
1%
0%
1%
54%
74%
68%
62%
69%
8%
14%
20%
23%
17%
37%
11%
11%
14%
12%
0%
10%
20%
30%
40%
50%
60%
70%
80%
ND Rural Semi Urban Urban Overall
NBFC PSU Bank Pvt. Bank Rest of Industry

46 | State of Micro Enterprise Financing Report 2023
cautious approach to agricultural lending or a focus on specic segments within
the agricultural sector.
CONCLUSION ON BL AGRICULTURE
1. Portfolio Analysis and Trends: Analysis highlights that smaller loans (up
to `3 lakhs) dominate in volume, indicating a high demand among micro-
entrepreneurs, while larger loans have a more signicant impact on the
nancial portfolio. Over time, there’s a noticeable shift from smaller to larger
loans, indicating the growth of businesses and their increasing nancial
needs.
2. Geographic Distribution and Institutional Roles: The analysis of state-wise
loan distribution shows variations in agricultural nancing across states, with
states like Uttar Pradesh and Telangana having higher shares in both loan
accounts and portfolio outstanding. The chapter also discusses the role of
different nancial institutions, with Public Sector Banks playing a major role
in lending, followed by Private Banks and other nancial entities like NBFCs
and Cooperatives.
3. Rural and Urban Distribution: The distribution of loans in rural, semi-urban,
and urban areas, suggests disparities in access and utilization of nancial
services, which are crucial for policy formulation and resource allocation.
4. Loan Performance and Overdue Analysis: Overdue loans, categorized by
ticket size, location of borrowers, and type of nancial institution reveals that
smaller loans (up to `3 lakhs) have a higher proportion of overdue, whereas
larger loan categories have fewer overdue accounts but with larger overdue
amounts. This section also highlights differences in loan performance across
states and the varying risk proles for different types of lenders.
5. Loan Sourcing and Sanction Patterns: The patterns in loan sanctions across
different population groups and nancial institutions shows that smaller
loans are more common in rural areas, while larger loans are more frequent
in urban settings. The chapter also highlights how different types of nancial
institutions, like PSU Banks, NBFCs, and Private Banks, have unique lending
proles across various population groups.

State of Micro Enterprise Financing Report 2023 | 47
4. MUDRA LOAN
INTRODUCTION
I
n the intricate fabric of our economy, small and micro-businesses stand as vital
threads, weaving together growth, innovation, and employment opportunities.
These enterprises, often the nurturing grounds for entrepreneurial ambition, rely
on more than just vision and dedication to thrive — they require nancial support.
Enter MUDRA loans, a cornerstone of nancial empowerment for Micro, Small,
and Medium Enterprises (MSMEs).
This chapter embarks on a journey into the world of MUDRA loans, where the
ticket sizes are tailored to the unique needs of MSMEs, typically up to `10 lakhs.
By delving into the diverse portfolio of MUDRA loans, we uncover the lending
patterns and evolving trends that are instrumental in propelling these enterprises
to new heights of success.
MUDRA loans, though modest in size, wield monumental impact. They not
only support budding businesses but also catalyse economic growth and foster
innovation. As we explore the intricate tapestry of MUDRA loans, we invite you to
witness how nancial support intertwines with entrepreneurial ambition to create
a brighter future for small businesses and the overall economy. Welcome to the
world of MUDRA loans — where dreams are empowered, and growth is fuelled.
PORTFOLIO
Size Wise Analysis
The following table presents data on MUDRA loan distribution across various
ticket sizes, detailing the number of accounts in thousands (‘000) and the portfolio
outstanding (POS) in rupees crore.

48 | State of Micro Enterprise Financing Report 2023
Table 17: MUDRA Loan, Ticket Size wise ‘23
Ticket Size Rs.
A/c Amount
Up to 3 lakh
2,395 16,881
3 to 5 lakh
298 10,294
5 to 7 Lakh
117 5,885
7 to 10 lakh
219 16,389
10 to 25 lakh
1.12 122.95
Not Dened
41 974
Grand Total
3,071 50,546
A/c - Number of accounts in ‘000, Amt. – POS in ` Crore
The ‘Up to 3 lakh’ category commands the largest share in terms of account
numbers, with 23.95 lakh accounts, and holds a substantial total value of 16,881
crores. This prevalence suggests that the MUDRA scheme is extensively utilized
by borrowers seeking smaller-sized loans, which might be indicative of micro-
enterprises or individual entrepreneurs who require lesser capital.
As the loan amount categories increase, there’s a noticeable decrease in the
number of accounts, with 2.98 lakh accounts in the ‘3 to 5 lakh’ range and 1.17
lakhs in the ‘5 to 7 lakh’ range. However, the total portfolio outstanding does not
diminish proportionately, reecting higher individual loan values in these brackets.
Specically, the ‘3 to 5 lakh’ range accounts for 10,294 crores, and ‘5 to 7 lakh’ for
5,885 crores, underscoring that while fewer loans are disbursed in these ranges,
they constitute a signicant portion of the nancial portfolio.
In the higher ticket sizes, from ‘7 to 10 lakh’ to ‘20 to 25 lakh’, the number of
accounts is markedly less, with the highest category having just 0.18,000 (or 180)
accounts. Despite this, the portfolio values remain substantial, signalling that a
smaller number of enterprises are securing larger amounts of capital. For instance,
even though there are only 0.54,000 (or 540) accounts in the ‘10 to 15 lakh’ range,
they amount to a notable 48 crores in value.
The Not Dened category encompasses 41,000 accounts with a portfolio of 974
crores, indicating a segment of the MUDRA loan distribution where the loan
amounts are unspecied or varied, yet still make up a considerable sum of the
lending value.
Overall, the grand total of accounts is 30.71 lakh with a cumulative portfolio
outstanding of 50,546 crores. This data not only highlights the MUDRA scheme’s
reach, particularly among smaller loan seekers but also shows a gradient of
increasing loan values correlated with a decreasing number of accounts, hinting at
a spectrum of business scales among the borrowers.

State of Micro Enterprise Financing Report 2023 | 49
Trend on Various Loan Buckets
The following tables show the percentage share of the number of MUDRA loans
and the percentage share in portfolio outstanding (POS) across various loan buck-
ets for the last three years, revealing trends in how loan distribution and amounts
have evolved.
Table 18: % Share of Number of Loans
% Share of Number of Loans
Mar-21 Mar-22 Mar-23
Up to 3 lakh
86% 81% 78%
3 to 5 lakh
6% 8% 10%
5 to 7 Lakh
2% 3% 4%
7 to 10 lakh
3% 6% 7%
10 to 25 lakh
0% 0% 0%
Not Dened
2% 1% 1%
Table 19: % Share of POS
Ticket Size
Mar-21 Mar-22 Mar-23
Up to 3 lakh
44% 36% 33%
3 to 5 lakh
18% 20% 20%
5 to 7 Lakh
10% 12% 12%
7 to 10 lakh
21% 29% 32%
10 to 25 lakh
0% 0% 0%
Not Dened
6% 2% 2%
From table 18, which presents the percentage share of the number of loans, we
observe a gradual year-over-year decrease in the ‘Up to 3 lakh’ category, declining
from 86% in March 2021 to 78% in March 2023. Despite this decrease, the category
still constitutes the majority of MUDRA loans, signalling a strong preference or
need for smaller loan amounts among borrowers, which are typically associated
with micro and small enterprises.
The ‘3 to 5 lakh’ and ‘7 to 10 lakh’ loan categories, however, have witnessed an
increase in their share of the number of loans over the years. The ‘3 to 5 lakh’
category rose from 6% to 10%, and the ‘7 to 10 lakh’ category from 3% to 7%. This
suggests that there is a growing segment of borrowers who are either scaling up
their business needs or are new entrants requiring more substantial loan amounts.
In table 19, detailing the percentage share of POS, a signicant drop is noticeable
in the ‘Up to 3 lakh’ range, from 44% in March 2021 to 33% in March 2023.
This points to a redistribution of loan values, with larger shares being allocated to
higher loan brackets over time.

50 | State of Micro Enterprise Financing Report 2023
Notably, the ‘7 to 10 lakh’ category has seen a substantial increase in its POS share,
from 21% to 32%. This aligns with the increased number of loans in this category,
indicating not only more loans but also a larger total value of loans being disbursed
within this range.
The Not Dened category shows some uctuations in the number of loans and a
decrease in POS share from 6% to 2%. This could imply an improvement in loan
categorization or a shift in lending patterns, possibly towards more dened loan
sizes.
Overall, the data reects a diversication and a gradual shift in the MUDRA
loan scheme from predominantly smaller-sized loans towards larger ones, both
in terms of the number of loans and the loan values. This could be indicative of
the growth and development of small businesses in the country, suggesting that
they are moving towards larger-scale operations and possibly have increased
credit needs.
State-Wise Distribution
The following graph reects the distribution of MUDRA loans across various
states and Union Territories of India, comparing the percentage share in the num-
ber of loans and the portfolio outstanding (POS) against the state’s share of the
population.
0%
5%
10%
15%
20%
Lakshadw…
Andaman…
Ladakh
The Dadra…
Arunachal…
Mizoram
Chandigarh
Meghalaya
Nagaland
Puducherry
Sikkim
Manipur
Goa
Jammu &…
Tripura
Delhi
Telangana
Kerala
Himachal…
Chhattisgarh
Uttarakhand
Haryana
Assam
Gujarat
Andhra…
Punjab
Rajasthan
Jharkhand
Odisha
Tamil Nadu
Bihar
Madhya…
Karnataka
West Bengal
Maharashtra
Uttar…
State's % share
% share in number of A/c % share in POS % Share population
Figure 26: States percentage share in MUDRA Loan
A signicant portion of the states and Union Territories, particularly the smaller
regions or those with less population, show 0% shares across the number of loans
and POS, as well as in their population percentages. This indicates that MUDRA
loans are not as prevalent or possibly underreported in these regions.
On the other end of the spectrum, Uttar Pradesh stands out with a markedly
high percentage in both the number of loans (11%) and POS (16%), compared
to its population share (17%). This suggests that while Uttar Pradesh has a high

State of Micro Enterprise Financing Report 2023 | 51
engagement with the MUDRA scheme, the amount disbursed through the loans is
not proportional to its population, which could point to a high volume of smaller
ticket loans.
Similarly, West Bengal shows a signicant discrepancy with a higher percentage in
the number of loans (8%) and POS (11%) against its population share (9%). This
may reect a robust participation in the scheme and possibly a higher average loan
value.
Karnataka, Maharashtra, and Tamil Nadu also show higher loan and POS
percentages compared to their population shares, suggesting a strong uptake of
MUDRA loans, indicative of a vibrant small business sector in these states.
Conversely, states like Bihar have a higher percentage of the number of loans (7%)
compared to their population share (9%), but the POS percentage (6%) is lower
than the population share, implying that while there is a signicant number of
loans, they may be of lower value on average.
Overall, the data suggests a varied uptake of MUDRA loans across the country,
with some states showing higher engagement than others. The discrepancy
between the number of loans, POS, and population percentages could indicate
different levels of economic activity, the size of the small business sector, and
the average loan size in each state. It could also reect the varying success of the
MUDRA loan scheme’s implementation across India.
Institutions Wise Distribution
The following graph indicates the distribution of MUDRA loans across different
types of lending institutions.
Figure 27: Lenders percentage share in MUDRA Loan
1%
30%
51%
18%
1%
34%
50%
15%
0%
10%
20%
30%
40%
50%
60%
ND Rural Semi Urban Urban
% Share in Accounts % Share in Sanction Amount

52 | State of Micro Enterprise Financing Report 2023
In the data, Public Sector Undertaking (PSU) Banks have a dominant share, both
in terms of the number of accounts (93%) and the sum of amounts in rupees
crore (96%). This overwhelming majority suggests that PSU Banks are the primary
facilitators of MUDRA loans, which are designed to support micro, small, and
medium enterprises (MSMEs) in India.
Private Banks have a negligible presence in the number of MUDRA loan accounts,
which is shown as 0%, and only contribute 1% to the total amount in rupees crore.
This could indicate several possibilities, such as private banks being less focused
on this segment, or possibly having stricter lending criteria, which could result in
fewer but larger loans, as suggested by the small but existent percentage in the loan
amounts.
The ‘Rest of Industry’ category, which may include non-banking nancial
companies (NBFCs) and other nancial institutions, accounts for 6% of the
number of accounts and 3% of the amount in rupees crore. While this is a smaller
share compared to PSU Banks, it shows that there is participation from other
nancial sectors in providing MUDRA loans.
Overall, the signicant share held by PSU Banks may reect the government’s
initiative to push for nancial inclusion and support for small businesses through
state-owned entities. The comparatively lower engagement of private banks and
other institutions might be due to various strategic, operational, or risk-related
decisions within these organizations. The data underscores the pivotal role of
PSU Banks in the MUDRA loan scheme and possibly hints at a potential area of
growth for private banks and the rest of the industry in this sector.
Rural/Urban Distribution
The following table illustrates the distribution of MUDRA loan accounts and the
associated amounts across various population groups in India, categorized as Not
Dened , Rural, Semi-Urban, and Urban.
Table 20: MUDRA loan Distribution in Population groups
Population group
A/c Amount
Not Dened
51 710
Rural
991 15,887
Semi-Urban
1,588 26,418
Urban
441 7,531
Grand Total
3,071 50,546
A/c - Number of accounts in ‘000, Amt. – POS in ` Crore

State of Micro Enterprise Financing Report 2023 | 53
The Semi-Urban category exhibits the highest engagement with 15.88 lakh accounts
(51.70% of the total accounts) and a total loan amount of 26,418 crores (52.29%
of the total POS). This prominence could be due to the strategic positioning of
semi-urban areas as bridging points between rural and urban economies, often
harbouring a signicant number of growing businesses that can capitalize on both
rural production and urban markets. The relatively higher loan amounts in these
areas might also reect the diverse nature of semi-urban businesses, which can
range from small-scale industries to larger, more capital-intensive operations.
The Rural sector also shows substantial participation with 9.91 lakh accounts
(32.26% of the total accounts) and 15,887 crores in POS (31.44% of the total
POS). This indicates a focus of the MUDRA scheme on supporting rural
entrepreneurship and small-scale agriculture-related businesses, which are vital
for inclusive economic growth and employment in rural areas. The presence of
MUDRA loans in rural areas is essential for enhancing the nancial inclusion of
unbanked and underbanked populations.
Urban areas, while having fewer accounts at 4.41 lakh (14.36% of the total
accounts), still account for a signicant POS amount of 7,531 crores (14.91%
of the total POS), suggesting larger average loan sizes. This is likely reective of
the higher operational costs in urban settings and the nature of urban businesses,
which may require more substantial capital investment.
The Not Dened category, with the least number of accounts and POS, suggests
that a small portion of the lending does not have a dened geographical
categorization, or it could represent a miscellaneous segment that includes loans
not standardly classied within the other three population groups.
Overall, the data indicates that the MUDRA scheme is playing a vital role in the
development of semi-urban and rural areas, with a notable percentage of resources
allocated to these regions. The distribution of loans underscores the potential
of the scheme to foster entrepreneurship and support small businesses across
India’s varied economic landscapes. It also highlights the economic diversity of the
country, with a clear indication of the scheme’s reach and its alignment with the
needs of different population segments.
REPAYMENT
Overdue by Ticket Size
The following table provides a snapshot of 90+ days past due (DPD) loan
portfolio across various ticket sizes, revealing the distribution and concentration
of nancial risk within a lending institution. A standout observation is the heavy
concentration of past due accounts in the smallest ticket size, ‘Up to 3 lakh’, which
implies that a signicant portion of the portfolio’s delinquencies stems from the
most numerous, albeit smallest, loans. This could reect a vulnerability of small-

54 | State of Micro Enterprise Financing Report 2023
scale borrowers to nancial instability or suggest that microloans, by their nature,
are more susceptible to defaults.
Table 21: Overdue in MUDRA Loans 90+ DPD as of March ‘23
Ticket size
Number
of A/c's
% of total
A/c's in
ticket size
POS `
Crore
% of total
POS in
ticket size
Average
POS in `
90+ DPD
Up to 3 lakh 323 14% 2,708 16% 83,754
3 to 5 lakh 31 10% 1,185 12% 380,648
5 to 7 Lakh 10 9% 533 9% 523,720
7 to 10 lakh 18 8% 1,509 9% 824,494
10 to 15 lakh 0.03 6% 4 8% 1,129,712
15 to 20 lakh 0.02 6% 3 7% 1,414,876
20 to 25 lakh 0.01 8% 3 12% 2,334,883
Not Dened 0.26 1% 12 1% 450,112
Grand Total
383 12% 5,957 12% 155,438
A/c - number of accounts in ‘000, Amt. - POS in ` Crore
The table provides a snapshot of 90+ days past due (DPD) loan portfolio across
various ticket sizes, revealing the distribution and concentration of nancial risk
within a lending institution. A standout observation is the heavy concentration of
past due accounts in the smallest ticket size, ‘Up to 3 lakh’, which implies that a sig-
nicant portion of the portfolio’s delinquencies stems from the most numerous,
albeit smallest, loans. This could reect a vulnerability of small-scale borrowers to
nancial instability or suggest that microloans, by their nature, are more suscepti-
ble to defaults.
As the ticket size increases, there’s a decline in the number of past due accounts,
yet these higher categories maintain a substantial share of the outstanding past
due amount. This indicates that while individual loans in the ‘3 to 5 lakh’ and
‘5 to 7 lakh’ brackets are fewer, they contribute more signicantly to the total
overdue balance. It hints at the likelihood that as loans get larger, their impact on
the nancial health of the portfolio becomes more pronounced, even with fewer
accounts being delinquent.
In the higher ticket sizes, such as ‘15 to 20 lakh’ and ‘20 to 25 lakh’, the number
of accounts is minimal, yet the share of past due amounts is disproportionately
large. This suggests that defaults in this segment, though fewer, represent large
individual loan values and could pose a substantial risk if they are not managed
effectively. Such high-value loans might require intensied credit scrutiny and a
strategic approach to risk mitigation to prevent signicant nancial exposure.

State of Micro Enterprise Financing Report 2023 | 55
The overall analysis reveals the nuances of risk distribution within the portfolio,
emphasizing the need for a segmented approach to credit management. It
underscores the potential necessity for the nancial institution to reassess
its lending strategies and risk assessment practices, especially for the smaller
ticket sizes that form the bulk of the past due accounts. It also points to the
importance of robust monitoring and recovery processes for larger loans, where
the nancial stakes are higher despite the lower numbers. This data is invaluable
for informing strategic decisions and ensuring the sustainability of the loan
portfolio.
Overdue by Location of Borrower
The following table portrays the segmentation of the 90+ days past due (DPD)
portfolio based on the urbanization level of the account holders: Rural, Semi-Ur-
ban, Urban, and Not Dened . It provides a comparison in terms of the number
of accounts in thousands and the corresponding portfolio outstanding in ` Crore,
including the percentage share of each category in the overall 90+ DPD portfolio.
Table 22: 90+DPD in different Population Groups in MUDRA Loans
Rural-Urban
Number of
A/c's
% of total A/c's
in ticket size
POS `
Crore
% of total
POS in ticket
size
Rural 8 15% 98 14%
Semi-Urban 134 14% 1,860 12%
Urban 199 13% 3,212 12%
Not Dened 42 10% 787 10%
Grand Total 383 12% 5,957 12%
A/c - Number of accounts in ‘000, Amt. – POS in ` Crore
In rural areas, despite having the smallest number of accounts, there is a nota-
bly high percentage of the total 90+ DPD portfolio by value (14%). This could
suggest that while there are fewer borrowers in rural areas, the average overdue
amount per account is larger, indicating that rural borrowers might be facing great-
er challenges in repaying loans or that loans extended to these areas are of higher
individual value.
The semi-urban segment, with 1.34 lakh accounts, holds a signicant portion of
the 90+ DPD portfolio both by number (14%) and value (12%). This illustrates
that semi-urban areas have a substantial number of past due accounts but with a
slightly lower average overdue amount per account compared to rural areas. This
might reect a different economic dynamic where semi-urban borrowers take
smaller loans or are slightly better at managing repayments despite a large number
of delinquencies.

56 | State of Micro Enterprise Financing Report 2023
Urban areas have the highest absolute number of accounts at 1.99 lakhs but a
lower percentage of the total past due amount (12%). This suggests that the urban
90+ DPD portfolio is large in terms of account numbers but each account has a
smaller overdue amount on average. Urban areas typically have more diversied
economic activities and access to nancial services, which might explain the higher
number of accounts and the dispersion of overdue amounts.
The Not Dened category accounts for 42,000 accounts with 10% of both the
account numbers and the total overdue value, which indicates a lower average
overdue amount per account compared to rural areas. The Not Dened category
could represent a mix of account types or geographic areas that don’t t into stan-
dard classications, suggesting a need for further analysis to understand the nature
of risk in this segment.
Overall, the data reects the diverse nature of the 90+ DPD portfolio across
different regions, highlighting the importance of context-specic risk manage-
ment and recovery strategies. It also suggests that rural areas, while accounting
for fewer accounts, may experience higher individual nancial stress, whereas
urban and semi-urban areas, with their larger number of accounts, present a
different challenge of managing a higher volume of smaller delinquencies. The
Not Dened category remains an area for further scrutiny to better tailor nan-
cial solutions and interventions.
Performance of States in 90+ DPD Overdue
The following graph depicts the state-wise distribution of 90+ days past due (DPD)
portfolio outstanding as a percentage of the total Point of Sale (POS) in each state,
as well as each state’s contribution to the total 90+ DPD POS across the portfolio.
The analysis of such data can provide insights into the regional performance of
credit portfolios and help identify areas with higher nancial distress.
Figure 28: States wise 90+DPD delinquency
0%
5%
10%
15%
20%
25%
Lakshadweep
Andaman & Nicobar Islands
Ladakh
The Dadra & Nagar Haveli…
Arunachal Pradesh
Mizoram
Chandigarh
Meghalaya
Nagaland
Puducherry
Sikkim
Manipur
Goa
Jammu & Kashmir
Tripura
Delhi
Telangana
Kerala
Himachal Pradesh
Chhattisgarh
Uttarakhand
Haryana
Assam
Gujarat
Andhra Pradesh
Punjab
Rajasthan
Jharkhand
Odisha
Tamil Nadu
Bihar
Madhya Pradesh
Karnataka
West Bengal
Maharashtra
Uttar Pradesh
% contribution to total 90+DPD POS % of total POS in State

State of Micro Enterprise Financing Report 2023 | 57
From the graph, it is immediately evident that certain states have a higher
percentage of their POS in the 90+ DPD category, which is indicative of localized
nancial stress. States like Telangana, Karnataka, and Maharashtra stand out with
a signicant portion of their POS being 90+ DPD. This could signal underlying
economic issues, such as unemployment or industry-specic downturns, which are
affecting the borrowers’ ability to repay loans.
The bar graph component highlights the contribution of each state to the total
90+ DPD POS. Maharashtra, with the highest bar, contributes a disproportionate
amount to the total 90+ DPD POS, indicating that while the state may have a
large economy, it also carries a signicant amount of nancial risk. In contrast,
states like Andhra Pradesh and Tamil Nadu also have notable contributions to the
90+ DPD POS, reecting the need for focused debt recovery strategies in these
regions.
However, it is also crucial to consider the percentage of total POS represented by
the 90+ DPD POS within each state (as shown by the line graph). While a state
may contribute a signicant percentage to the total 90+ DPD POS (such as Uttar
Pradesh), it is also essential to evaluate what this represents in the context of the
state’s total POS. For example, a high percentage contribution to the total 90+
DPD POS may not be as alarming if it constitutes a small percentage of the state’s
total POS.
The graph and table together facilitate a dual-layered analysis of risk - one that looks
at how widespread the issue of non-payment is within each state, and another that
assesses the impact of each state’s non-performing loans on the broader nancial
landscape. Such an analysis is instrumental for nancial institutions in prioritizing
areas for credit risk management and for policymakers to understand regional
economic health and potentially direct economic support where it is needed most.
MUDRA LOAN SOURCING
The following table presents data on MUDRA (Micro Units Development &
Renance Agency) loans sanctioned during the nancial year 23, segmented
by various ticket sizes, with the number of accounts in thousands and the loan
amounts in ` Crore.

58 | State of Micro Enterprise Financing Report 2023
Table 23: Business Loan Sanction- Ticket Size Basis- FY 2022-23
Ticket Size Sum of A/c in '000
Sum of Amt. in ` Crore
Up to 3 lakh 655 5,936
3 to 5 lakh 84 3,754
5 to 7 Lakh 43 2,735
7 to 10 lakh 75 6,741
10 to 15 lakh 0.03 4
15 to 20 lakh 0.04 7
20 to 25 lakh 0.02 4
Grand Total 858 19,182
A/c - Number of accounts in ‘000, Amt. – Sanction Amount in ` Crore
The majority of the loans sanctioned fall in the smallest ticket size category, ‘Up to
3 lakh’, with 6.55 lakh accounts sharing a cumulative loan amount of `5,936 Crore.
This suggests that the MUDRA scheme is predominantly serving its purpose of
providing nancial support to micro-enterprises and entrepreneurs requiring
smaller amounts of capital, which is consistent with the scheme’s objective of
fostering micro-entrepreneurship.
As the ticket size increases, there is a steep decline in the number of accounts.
The ‘3 to 5 lakh’ bracket has 84,000 accounts with `3,754 Crore sanctioned,
and the ‘5 to 7 lakh’ bracket further drops to 43,000 accounts totalling `2,735
Crore. This decline illustrates that as the loan amount increases, fewer borrowers
take advantage or qualify for the larger loan amounts, which may reect tighter
lending criteria or a reduced demand for higher loan amounts within the target
demographic of MUDRA.
Interestingly, in the higher ticket sizes, ‘7 to 10 lakh’ and above, the number
of accounts is substantially lower, yet the loan amounts are relatively high. For
instance, the ‘7 to 10 lakh’ category has 75,000 accounts with a total loan amount of
`6,741 Crore, indicating that each account in this category, on average, has a higher
loan value compared to the smaller ticket sizes. The higher ticket size categories,
although representing a minor portion of the total number of accounts, indicate a
signicant average loan amount per account, highlighting that MUDRA also caters
to a segment of enterprises that require more substantial nancial assistance.
In conclusion, the distribution of MUDRA loans across different ticket sizes in
FY23 shows a strong inclination toward supporting a large volume of micro-
enterprises with smaller loan requirements, while also providing for a smaller
number of businesses with higher capital needs. The data reects the scheme’s
broader nancial inclusion goals and its role in supporting a range of business
needs from micro to small enterprises.

State of Micro Enterprise Financing Report 2023 | 59
Demographics-Wise Sanction
The following bar graph depicts the percentage share of population groups in
MUDRA loan sanctioning, differentiated between the share in accounts and the
share in sanction amount. It categorizes the population into four groups: Not
Dened, Rural, Semi-Urban, and Urban.
Figure 29: Percentage of population groups in MUDRA Sanction
A notable point is the signicant proportion of MUDRA loans sanctioned to
rural areas, which make up 38% of the accounts and 34% of the sanctioned
amount. This high percentage demonstrates the scheme’s reach in supporting rural
entrepreneurship, which is critical for inclusive economic growth and development
in these areas.
Semi-urban regions also have a substantial share, with 51% of the accounts and
50% of the sanction amount. This shows that MUDRA is actively used in these
areas, possibly due to a mix of urban and rural characteristics that create a fertile
ground for small businesses and micro-enterprises that the MUDRA scheme
targets.
Urban areas, despite having the infrastructure and higher population density,
account for 18% of the MUDRA accounts and 13% of the sanction amount. The
lower share in urban regions could be due to the availability of diverse nancing
options, possibly making MUDRA less attractive or necessary, or it could reect a
strategic focus of MUDRA to empower semi-urban and rural areas.
The Not Dened category has a minimal share in both accounts and sanction
amount, suggesting that there is a small segment of the population that does not fall
into the standard rural-urban classication or that their classication is unknown.
This could also indicate data classication issues that might need addressing for a
more accurate analysis.
1%
30%
51%
18%
1%
34%
50%
15%
0%
10%
20%
30%
40%
50%
60%
ND Rural Semi Urban Urban
% Share in Accounts % Share in Sanction Amount

60 | State of Micro Enterprise Financing Report 2023
Overall, the data indicates that MUDRA loans are primarily beneting semi-
urban and rural areas, which aligns with the scheme’s objectives to promote
entrepreneurship and employment in less developed areas. The distribution
suggests that the MUDRA scheme plays a pivotal role in nancial inclusion and
the development of micro and small enterprises outside the major urban centres.
States Share in Sanction
The following graph showcase the percentage share of MUDRA sanction amounts
allocated to each state compared to the percentage share of the population in those
states. This comparison can provide insight into the penetration and emphasis of
the MUDRA scheme across different regions in relation to population density.
Figure 30: MUDRA Loan - Percentage of Share of States in Sanction Amount
From the data, there are states like Maharashtra and Uttar Pradesh where the
percentage share in MUDRA sanction amount signicantly exceeds their respective
population shares. This indicates that a disproportionately higher amount of
MUDRA loan funds are allocated to these states, which could be due to a higher
number of eligible micro-enterprises or a greater demand for small-scale nancing
in these regions.
0%
2%
4%
6%
8%
10%
12%
14%
16%
18%
Lakshadweep
Andaman & Nicobar Islands
The Dadra & Nagar Haveli & Daman & Diu
Ladakh
Arunachal Pradesh
Mizoram
Puducherry
Chandigarh
Meghalaya
Nagaland
Sikkim
Manipur
Goa
Tripura
Jammu & Kashmir
Delhi
Himachal Pradesh
Chhattisgarh
Kerala
Telangana
Uttarakhand
Assam
Haryana
Rajasthan
Jharkhand
Gujarat
Punjab
Andhra Pradesh
Odisha
Tamil Nadu
Bihar
Madhya Pradesh
West Bengal
Karnataka
Maharashtra
Uttar Pradesh
%share in Sanction amount % Share population

State of Micro Enterprise Financing Report 2023 | 61
Conversely, several states and union territories, such as Lakshadweep, Andaman
& Nicobar Islands, and others, show no representation in the MUDRA sanction
amounts. These zero allocations could point to limited access to MUDRA loans,
lesser demand, or a smaller micro-enterprise sector in these regions. It may also
reect broader economic factors or the efcacy of MUDRA’s outreach programs
in these areas.
States like West Bengal, Tamil Nadu, and Karnataka show a balance between their
population share and the share in MUDRA sanction amount, suggesting that the
MUDRA loan distribution is aligned with the population distribution, potentially
indicating equitable access to MUDRA loans relative to the size of the population.
The analysis of this data is essential for understanding regional disparities in
nancial inclusion and the distribution of government-backed nancing. It
can also help in assessing whether the MUDRA scheme is meeting its goal of
promoting entrepreneurship across all segments of the population, particularly
in regions where the sanctioned amounts do not align with the population
shares. This could be a signal for policymakers to investigate the effectiveness
of MUDRA’s implementation and potentially adjust strategies to ensure that the
scheme’s benets are reaching all intended beneciaries equitably.
CONCLUSION ON MUDRA
1. Prevalence of Micro Loans: The MUDRA loan scheme shows a strong tilt
towards smaller ticket loans, with the ‘Up to 3 lakh’ category encompassing the
majority of accounts and a signicant portion of the Portfolio Outstanding
(POS). This indicates the scheme’s effectiveness in reaching out to micro-
enterprises and individual entrepreneurs who form the backbone of the
grassroots economy.
2. Diversication in Loan Sizes: There has been a year-on-year shift towards
larger loan sizes, with the ‘3 to 5 lakh’ and ‘7 to 10 lakh’ categories seeing an
increase in both the number of loans and the percentage share of POS. This
trend suggests a maturing of the MSME sector, with businesses possibly
scaling up their operations or new businesses starting with higher capital
requirements.
3. State-Wise Loan Distribution: The distribution of MUDRA loans across
states presents a mixed picture, with some states like Maharashtra and
Uttar Pradesh having a higher share in MUDRA sanctions relative to their
population, indicating strong uptake. In contrast, certain regions show
negligible or no MUDRA loan allocations, pointing towards potential
underutilization in those areas.

62 | State of Micro Enterprise Financing Report 2023
4. PSU Banks as Primary Lenders: Public Sector Banks (PSUs) dominate the
MUDRA loan landscape, highlighting their pivotal role in facilitating these
loans. The minimal presence of private banks and other nancial institutions
suggests room for growth and a more diversied lender base in the future.
5. Rural and Semi-Urban Focus: The MUDRA scheme is signicantly active in
rural and semi-urban areas, which is in line with the objective of promoting
entrepreneurship and employment outside major urban centres. This focus is
crucial for balanced regional economic development and reects the scheme’s
intent of nancial inclusion across diverse geographical landscapes.
6. The distribution of overdue loans across various ticket sizes reveals crucial
insights into the nancial behaviour of borrowers and the risk prole of the
lending institution. The smallest ticket size, ‘Up to 3 lakh’, displays a high
concentration of overdue accounts, constituting 14% of such accounts and
representing 16% of the Portfolio Outstanding (POS) in this category. This
indicates that the most common and modest-sized loans are more prone to
repayment issues, possibly highlighting the nancial vulnerability of smaller-
scale borrowers or the inherent risk in microloan segments.

State of Micro Enterprise Financing Report 2023 | 63
T
he Micro, Small, and Medium Enterprise (MSME) sector in India,
comprising approximately 6.34 crore enterprises, plays a pivotal role in the
economy, contributing around 30% to the GDP, over 48% to exports, and 45%
to manufacturing output. The sector, a major employment generator, provides
opportunities to about 11.1 crore individuals, surpassed only by agriculture.
Financial support to this sector comes through a comprehensive network of
institutions regulated by the Reserve Bank of India (RBI), involving a range of
banks and Non-Banking Financial Companies (NBFCs). Apex bodies like the Small
Industries Development Bank of India (SIDBI) and MUDRA also contribute to
this support system.
In business loans, the portfolio analysis reveals a dominance of micro-loans (up to
`3 lakh), constituting a staggering 77% of the total loans by March 2023. However,
they account for just 25% of the total Portfolio Outstanding (POS). In contrast,
loans in the ‘7 to 10 lakh’ category, despite comprising only 5.77 lakh accounts,
boast a signicant POS of `34,567 crores. The trend across the years shows a
general shift towards micro-loans, with the ‘Up to 3 lakh’ category increasing in
both loan numbers and POS share over time.
State-wise distribution of business loans highlights disparities: Uttar Pradesh, with
a 17% population share, has only 8.5% and 7.5% shares in the number of accounts
and credit amount, respectively. In contrast, Tamil Nadu, with a 6% population
share, accounts for 16.1% and 14.1% in the number of accounts and credit
amount, suggesting better nancial integration. The role of different nancial
institutions is varied, with PSU Banks leading with 35.7% in the number of MSME
loan accounts and 32.8% in loan amounts. NBFCs, while holding 17.3% of the
accounts, contribute signicantly with 21.6% to the loan amount.
In Business Loan Agriculture, smaller loans (up to `3 lakh) are also prevalent,
with 111.22 Lakhs accounts making up a substantial share of the total number.
The ‘20 to 25 lakh’ category, though representing only 0.15% of the total number
of accounts, accounts for a 2.02% share of the total loan amount. Geographical
disparities in agricultural loans are evident, with states like Uttar Pradesh showing
5. CONCLUSION

64 | State of Micro Enterprise Financing Report 2023
robust engagement in agricultural nancing, while Bihar shows lower shares in
both loan accounts and POS relative to its population share.
MUDRA loans, tailored for MSMEs up to `10 lakhs, also show a strong preference
for smaller loans. The ‘Up to 3 lakh’ category commands the largest share, with
23.95 lakh accounts, holding a total value of 16,881 crores. Larger loan categories
have fewer accounts but represent signicant nancial values, suggesting that a
small number of enterprises secure larger amounts of capital. MUDRA loans are
actively utilized in semi-urban and rural areas, indicating the scheme’s effectiveness
in reaching micro-enterprises and individual entrepreneurs in these regions.
Repayment analysis across all loan categories points to a higher delinquency
rate in smaller loans. For instance, in the business loan sector, the ‘Up to 3 lakh’
category has 12% of overdue accounts, indicating that smaller loans are more
likely to become overdue. Similarly, in MUDRA loans, the ‘Up to 3 lakh’ category
represents 14% of overdue accounts, underscoring potential vulnerabilities among
small-scale borrowers.
In conclusion, the MSME sector in India, while demonstrating signicant
contributions to the economy, shows varied trends in loan distribution, with a
pronounced emphasis on smaller loans. The sector faces challenges in loan
repayment, particularly in the micro loan categories. The state-wise and institutional
disparities in loan distribution underscore the need for tailored nancial strategies
to ensure equitable access and support across different regions and sectors.

Tel : +91-11-46170638, 45697039
