
28 August 2015
Corporate Funding Structures and Incentives
Final report
Introduction
In the aftermath of the global financial crisis, a concerted effort has been made to reduce
leverage in the financial sector. For instance, the aggregate leverage of large internationally
active banks declined from 29 times Tier 1 capital in 2011 H1 to 22 times in 2014 H1.
1
Such
reductions are helping to reduce the vulnerability of the financial system to shocks.
However, broader measures of debt and leverage, which cover both financial and nonfinancial
sectors, have continued to grow in many countries.
2
Leverage in nonfinancial sectors in the
economy can also represent a vulnerability, because it can act to amplify changes in
fundamentals and make households, nonfinancial businesses and governments more sensitive
to shocks. Some studies find that excessive debt can dampen economic growth. It has been
shown to lead to financial crises and to hamper economic recovery from recessions.
3
In the post-crisis period, there has been a noteworthy increase in nonfinancial corporate debt,
particularly in some emerging economies. This has taken the form both of bond issuance and
bank borrowing. In aggregate, this has led to higher levels of corporate leverage as measured
by the ratio of nonfinancial corporate debt to GDP. Questions have been raised about the
incentives that have led to this increase and whether the trend represents a risk to financial
stability.
1
See Basel Committee for Banking Supervision, Basel III Monitoring Report 2015, Table A.16.
2
According to one estimate, the global stock of debt (summing household, corporate, government and financial) rose from
$142 trillion (269% of GDP) at end-2007 to $199 trillion (286% of GDP) in the second quarter of 2014. McKinsey
Global Institute (2015), “Debt and (Not Much) De-leveraging,”
http://www.mckinsey.com/insights/economic_studies/debt_and_not_much_deleveraging. The Report examines the
evolution of debt in 47 countries around the world, including both developed and emerging economies. Similarly,
Buttiglione et al estimate that the global ratio of gross nonfinancial debt to GDP has risen every year since 2000 from
160% to 215%. (For details, see Buttiglione, L., Lane, P.R., Reichlin, L., Reinhart, V., (2014), “Deleveraging? What
Deleveraging?” Geneva Reports on the World Economy 16, International Center for Monetary and Banking Studies and
CEPR.
3 For recent studies on the inverse relationship between debt and growth, see Kumar, M.S. and J. Woo (2010), “Public debt
and growth”, IMF Working Paper, No. 10/174, Reinhart, C. M. & Rogoff, K. S., (2010) “Growth in a Time of Debt.
American Economic Review Papers and Proceedings, 100(2), 573-78. Cecchetti, S., Mohanty, M., Zampolli F., (2011)
“The Real Effects of Debt” BIS Working Papers, No:352. Reinhart, C., Reinhart, V., Rogoff K., (2012) “Public Debt
Overhangs: Advanced Economy Episodes since 1800”, Journal of Economic Perspectives, Vol:26 (3), 69-86.
2
This report responds to the request of G20 Finance Ministers and Governors in their February
2015 communique for “the FSB, coordinating the inputs of the IMF, OECD, BIS, IOSCO and
WBG to prepare a report by our meeting in September preceded by an interim report to the
June Deputies meeting to examine the factors that shape the liability structure of corporates
focusing on its implications for financial stability.”
The report has been prepared by the FSB Secretariat, based on the contributions by the staff of
the six international organisations. It describes:
• the growth in nonfinancial corporate debt since the crisis, including differences across
countries and regions (section 1);
• insights into the incentives, including structural and regulatory factors, influencing
these trends (section 2);
• possible related financial stability concerns (section 3);
• the potential role of macroprudential policies (section 4);
• and possible next steps (section 5).
It focuses on developments and issues for publicly-traded nonfinancial companies. Data on
debt at privately-owned small and medium-sized companies are not widely available; they
may face many of the same incentives and issues as larger companies, but small companies
may also be disincentivised from raising new equity finance by a stronger desire to avoid
dilution of ownership (e.g. where they are family-owned or otherwise closely-controlled).
The way that corporate funding is structured and financed is of interest to authorities because
it will affect the resilience and decision-making of individual corporates and at the aggregate
level could possibly affect the stability of the wider financial system. Corporate funding
markets and corporate liability structures may be relevant for financial stability in a number of
ways.
Well-functioning debt and equity markets allow businesses to fund investment flexibly and at
a relatively low cost to existing shareholders, thereby contributing to investment and growth.
National authorities and international organisations have therefore worked extensively to
encourage the development of such markets.
However, high debt levels relative to equity in corporate balance sheets create leverage which
can accentuate losses to owners, and create elevated debt service requirements. This in turn
can lead to exacerbated cash flow stress, deteriorating creditworthiness, debt-rollover risks
and higher corporate default rates. Moreover, in particular if credit risk is under-priced, spikes
in default rates may permeate through the financial system as investors and creditors,
including the banking system, incur losses. To the extent that there are high and pro-cyclical
levels of corporate leverage that affect a significant number of companies, this may add to
pro-cyclicality of the financial system, and hence reduce financial stability.
The report contains a summary analysis of issues that could have a bearing on financial
stability. It also proposes that there could be further work in 2016, including on: i) further
analysis of data on nonfinancial corporate leverage to examine the extent to which particular
economic factors drive the liability structure choices of different types of corporates and
whether any financial stability concerns arise from these, ii) existing country experiences with
the use of macroprudential tools used to address risks arising from corporate debt financing,
iii) country-specific case studies on addressing the debt-equity tax bias.
3
1. Trends in Corporate Funding Structures
Nonfinancial corporate debt levels have increased relative to GDP over the last 15 years, in
both advanced economies and emerging markets. This increase has been much faster in
emerging markets as their markets have deepened. Nonfinancial corporate debt-to-GDP for a
selected group of advanced economies in 1999 was 77% and for a group of large emerging
market and developing economies (EMDEs) was 38%, but the subsequent rapid growth of
debt in these EMDEs meant that by 2014 the average levels for these EMDEs surpassed the
advanced economies - 87% and 90% (see annexed Tables 1 and 2). This includes a rapid
acceleration of debt growth in EMDEs since pre-financial crisis levels in 2007, as
nonfinancial corporate debt-to-GDP has increased by 31 percentage points for EMDEs, but
only by 2 percentage points for advanced economies during that time.
Within the overall figures, there are major differences between countries, both in levels and in
growth rates of nonfinancial corporate debt (see Figure 1). For instance, amongst major
advanced economies, the level of such debt varies from a rapidly-growing 166% of GDP for
Sweden to a flat 55% for Germany, and in some countries corporate debt decreased slightly.
In emerging markets, China’s nonfinancial corporate debt has risen to over 150% of GDP,
above the levels of most advanced economies, while Mexico’s is only 21%. For EMDEs,
growth rates of corporate debt vary considerably across countries. The graphs below illustrate
these developments.

4
Figure 1
- Total non-financial corporate debt (as a percentage of GDP)
Advanced economies
1
Emerging market economies
2
1
Australia, Canada, France, Germany, Hong Kong SAR, Italy, Japan, Korea, the Netherlands, Singapore, Spain, Sweden, Switzerland, the
United
Kingdom
and the United States.
2
Argentina, Brazil, China, India, Indonesia,
Malaysia, Mexico, Russia, Saudi Arabia, South Africa, Thailand and
Turkey.
Sources:
IMF, World Economic Outlook; OECD; national sources.

5
Figure 2- Composition of non-financial corporate outstanding debt
(
In trillions of US dollars)
Advanced economies
1
Loans and debt securities
Debt securities
Emerging markets
4
Loans and debt securities
Debt securities, by market
5
1
Countries included are: Australia, Canada, France, Germany, Hong Kong SAR, Italy, Japan, Korea, the Netherlands, Si
ngapore, Spain,
Sweden, Switzerland, the United Kingdom and the United States.
2
Total loans to non-financial corporations.
3
Aggregate
outstanding,
by residence of issuer.
4
Countries included are: Ar
gentina, Brazil, China, India, Indonesia, Malaysia, Mexico, Russia, Saudi
Arabia, South Africa, Thailand and Turkey.
5
By residence of issuer.
6
Sum of domestic and international debt securities (see the right
-
hand panel).
Source:
national data, BIS domestic and international debt securities statistics.
Some of this growth in debt in EMDEs is benign and even desirable. In EMDEs with low
starting levels of corporate debt, rising debt may reflect a healthy deepening in the financial
system, as more companies gain access to financial services and as their own financial
condition improves. However, in many EMDEs, corporate debt grew faster than earnings in
2014, with debt-to-earnings now higher than its 5-year average, and according to some
measures risks related to corporate debt have increased. Furthermore, the increased amount of
outstanding debt, declining underwriting standards, and declining secondary market liquidity
conditions, taken together, have increased concerns that a sharp sell-off in corporate debt
markets could produce disorderly conditions in financial markets. Any resulting increase in
financing costs would have negative implications for the real economy.

6
Since the crisis, market sources of credit have become increasingly important (see Figure 2).
In a number of advanced economies, corporate bonds and lending by non-bank institutions
have accounted for nearly all new credit for corporates since 2007, while bank lending to
corporates has shrunk.
4
However in contrast to advanced economies, bank lending in EMDEs
has also risen along with bond issuance.
5
Corporate bonds have assumed a greater role in international fixed-income markets. Issuers
have wide flexibility in how they structure and issue debt securities and the market on which
the debt securities are issued and traded (domestic versus international) and the currency
denomination of the securities (local versus “hard currency”) are two important factors for
financial stability.
Globally, nonfinancial corporates have replaced sovereigns and financial issuers as the largest
bond issuers with US$6.9 trn of issuance since 2008.
6
Not only has the amount of issuance
increased, but between 2008 and 2013 the number of nonfinancial corporates issuing bonds
has doubled, suggesting a deepening of capital markets and an important diversification in the
sources of corporate financing for many corporates (Figure 3).
Figure 3: Global Primary Corporate Bond Markets
Source: Celik, S. et al (2015)
Against the backdrop of ample global liquidity and prolonged low global interest rates,
nonfinancial corporate bond issuance in major EMDEs has risen sharply. New corporate bond
issuance in a selection of major EMDEs rose 10% in 2014, with Asia leading other regions
(Figure 4).
4
The countries mentioned in this context are Australia, Canada, France, Germany, Japan, Netherlands, South Korea,
United Kingdom and United States .For details, see McKinsey Global Institute (2015),
5
For details, see Annex A.
6
Celik, S., G. Demirtas, and M. Isaksson (2015), ‘Corporate Bonds, Bondholders and Corporate Governance”, OECD
Corporate Governance Working Papers, No. 16,
http://www.oecd-ilibrary.org/governance/oecd-corporate-governance-
working-papers_22230939.

7
Figure 4. Nonfinancial Corporate Bond Issuance by Selected Emerging Economies
1. Bond Issuance by Currency (in US$ billion)
2. Bond Issuance by Regions (in US$ billion)
Source: IMF: Annex A. (The countries in the sample: Argentina,
Brazil, Bulgaria, Chile, China, Hungary, India, Indonesia,
Malaysia, Mexico, Peru, Philippines, Poland, Russia, South Africa,
Thailand, Turkey)
Source: IMF: Annex A. (Same countries)
Focusing more narrowly on the growth of international bond issuance by EMDEs, the World
Bank paper Global Liquidity and External Bond Issuance in Emerging Markets and
Developing Economies (see Annex B) analyses the global factors that have contributed to this
growth. It notes that bond issuance in international markets by EMDEs (comprising both
corporate and sovereign issuance) increased steadily before the global financial crisis, and
accelerated afterwards. Total annual issuance of international bonds by EMDEs rose from
around $64 bn in 2000 to $400 bn in 2014. In line with the trends outlined above, issuance of
international bonds has been driven in recent years by corporate issuance ($300 bn corporate
vs $99 bn sovereign in 2014, compared to $14 bn corporate and $50 bn sovereign in 2000). In
March 2015, higher-income EMDEs had $1.4 trn of outstanding bonds while lower-income
EMDEs had about $280 bn, both representing all-time highs.
There has also been a shift in EU advanced economies away from a bank-based approach to
corporate funding towards a more diversified corporate funding model, especially for larger
companies. For instance, prior to the crisis nonfinancial corporates accounted for only 17% of
total European financial and nonfinancial corporate bond issuance, but this share had grown
to 40% in 2013.
7
Furthermore, non-investment-grade bonds, which were virtually non-
existent in Europe prior to the crisis, now comprise about 12% of the total amount of
European financial and nonfinancial corporate issuance. Nevertheless, the great majority of
the outstanding stock of European corporate debt remains in the form of bank lending rather
than bonds. At end-March 2014, euro-area nonfinancial corporates still had only EUR 1.1 trn
of outstanding debt securities, compared with EUR 8.6 trn of bank loans.
7
Ibid., p. 14
0
100
200
300
400
500
600
700
800
900
2014
2013
2012
2011
2010
2009
2008
Foreign Currency
Local Currency
0
100
200
300
400
500
600
700
800
2014
2013
2012
2011
2010
2009
2008
Asia
Latam
EMEA

8
There are a number of factors explaining these trends. To a certain extent country-specific
factors play a role, such as the continuation of the upward trend in issuance that was already
in place in many fast-growing EMDEs prior to the crisis. However the acceleration of
corporate issuance since the crisis is largely explained by global push factors.
8
Yields on the
sovereign debt of many advanced economies have been low, reflecting the widespread impact
of extraordinary monetary policies conducted by a number of central banks. These actions
have lowered risk premiums and compressed global market volatility, leading to increased
supply from issuers of corporate debt because of the significant reduction in issuance costs
and increased demand from investors for higher-yielding products. This shift has been
reinforced in some cases by the deleveraging taking place in certain banking systems that
have encouraged a substitution towards market-based finance.
However, in the current environment slowing economic growth in EMDEs is putting pressure
on some firms’ profitability and debt service capacity. As noted above, corporate profitability
has declined relative to its five-year averages across most EMDE countries, with broad-based
weaknesses across sectors (see Annex A). Corporate debt has grown faster than earnings in
most EMDE countries over the last several years, evidenced by the increase in the ratio of net
debt to earnings before interest and taxes (EBIT), which suggests that the leverage of EMDE
corporates is increasing, negatively affecting their creditworthiness. The decline in debt-
servicing capacity for some corporates has in part driven the IMF’s estimates that the share of
“debt at risk” in total corporate debt rose by 22% in 2014 from levels in 2010. There could be
value in further examination of the extent to which particular economic factors drive the
liability structure choices of different types of corporates and whether any financial stability
concerns arise from these. For instance, capital-intensive industries (energy sector, mining
sector etc.) tend to have more debt-heavy liability structures, whereas service-oriented firms
tend to have more equity-heavy (including privately-owned) structures. Larger firms are more
likely to issue debt on capital markets than smaller firms, and corporate financing in EMDEs
and the euro area tends to be more bank-based compared to other advanced economies.
Shifting market-based debt characteristics
The increase in the supply of corporate debt has in large part been facilitated by the search-
for-yield environment created by the extraordinary policy measures undertaken in the US,
UK, euro area and Japan. The increased investor demand for riskier and higher yielding
investments has in turn altered the composition of corporate debt markets.
For example, global issuance of non-investment-grade bonds increased from $82 bn in 2000
to $556 bn in 2013, as well as a shift towards debt with fixed-interest and callable features.
9
Maturities for higher-yielding debt have increased; for instance the average maturity of
external issuance by EMDEs has increased to almost 8 years recently, up from 7.3 years in
2009 immediately after the crisis - although it remains below the pre-crisis average maturity
of 9 years. The majority of the total $1.7 trn currently outstanding external EMDE bonds will
mature before 2024, peaking in 2019.
8
For details, see Annex B
9
For details, see Celik, S. et al (2015), including p. 19-20: “A callable bond gives the issuer the option to redeem the bond
prior to maturity. The value of all callable bonds as a share of all corporate bonds issued in 2012 and 2013 exceeded 36%
compared to 16% in 2000.”

9
Covenants have also been relaxed. While the increase in covenant-lite bonds
10
in the US has
been well documented, work by the OECD
11
suggests that globally investor protection
covenants in non-investment-grade bonds are half as common as they were 10 years ago.
Overall, in recent years, the shift in the micro-structure of the corporate bond market has
resulted in greater flexibility for issuers, but potentially greater credit risk for investors (while
diminishing yields have reduced investors’ compensation for that risk).
Another important trend has been the increase in foreign currency corporate funding. BIS
research
12
shows that since the global financial crisis, banks and bond investors have
increased the outstanding US dollar credit to non-bank borrowers outside the US from $6 trn
to $9 trn. This has the potential to create currency mismatches, which may increase financial
stability concerns if a sufficient number of corporates are subject to such mismatches and if
there is no natural hedge and financial instruments for hedging are not available,
as discussed
in section 3 below.
13
2. Structural and regulatory factors influencing corporate funding
structures
When considering relative incentives toward equity and debt financing, a useful starting point
is the Modigliani-Miller theorem
14
, which states that, in the absence of taxes, bankruptcy
costs, agency costs, and asymmetric information, and in an efficient market, the value of a
firm is unaffected by how that firm is financed. However, there are tax, accounting, incentive
and conjunctural factors that in practice limit the neutrality between funding choices.
In this spirit, the academic literature commonly postulates that, when companies seek external
financing, they normally tend to prefer debt to equity, since debt financing entails lower costs
and does not change ownership structures.
15
Additional equity financing is much less
frequent, but will be employed in certain circumstances such as when firms are growing
rapidly or debt levels are high. Empirical studies support these predictions, and suggest a
number of additional firm and industry-specific characteristics that are likely to play a role in
corporates’ funding decisions.
16
10
Covenant-lite bonds are bonds with more relaxed restrictions on collateral, payment terms and other contractual
obligations.
11
See Celik, S. et al (2015)
12
McCauley, R, P McGuire and V Sushko (2015): “Global dollar credit: links to US monetary policy and leverage”,
Economic Policy, April, pp 187–229.
13
For details, Annex E.2
14
Modigliani, F. & Miller, M.H. (1958). “The Cost of Capital, Corporation Finance and the Theory of Investment".
American Economic Review 48 (3): pp. 261–297.
15
“Pecking order theory” set out by Myers, S.C. (1984). “The Capital Structure Puzzle”, The Journal of Finance, 39 (3), pp.
574-592. This theory is referenced in many subsequent papers, for instance, Fama, E.F. & French, K.R. (2002). “Testing
Trade-off and Pecking Order Predictions about dividends and debt”, Review of Financial Studies, 15(1), pp. 1-33. Frank,
M.Z. & Goyal V.K. (2009). “Capital Structure Decisions: Which Factors are Reliably Important?”, Financial
Management, 38(1), pp. 201-222.
16
In general most of the studies categorise the factors into corporation-specific factors and macroeconomic factors or
country specific factors; such as De Jong, A. Kabir, R & Nguyen, T.T. (2008). “Capital Structure Around the World: The
Roles of Firm-and-Country-Specific Determinants”, Journal of Banking and & Finance, 32(9), pp. 1954-1969, Kayo,

10
This section sets out some of the factors that can be relevant to corporate decisions about their
liability structures.
a. Conjunctural and regulatory factors
Section 1 above described the conjunctural factors leading to increased investor demand for
debt instruments as a result of the extraordinary monetary policies following the financial
crisis. In particular, debt accumulation has been encouraged by the availability of low-cost,
abundant and flexible debt, which has provided an unprecedented opportunity to increase
returns to the equity holders. More generally, debt issuance by nonfinancial corporations is
influenced both by supply-side and demand-side considerations, each with their own policy
implications.
On the supply side of debt issuance, especially for some EMDEs, nonfinancial corporations
have seen growing incentives and opportunities to increase leverage, by borrowing in both
foreign and domestic currencies. The depth of corporate debt markets varies across countries.
Nevertheless, as discussed above, they have taken advantage of the low all-in yields available
to fund expansion plans, where they have stronger growth prospects. Moreover, the increased
depth and breadth of the markets, as well as improved fundamentals in a number of EMDEs
triggering multiple sovereign credit rating upgrades, decreased the risk premium for issuing
EMDE corporate debt.
On the demand side, institutional investors are important investors in global equity and bond
markets, with the overall size of the sector’s balance sheet exceeding the size of the economy
in many advanced economies. While investors have different mandates, incentives and
knowledge of the markets in which they are investing, regulatory developments have
remained an important factor in shaping institutional investors’ asset allocation strategies. In
particular, changes in regulations, in the aftermath of the equity downturn in 2000-2002, have
aimed to incentivise pension funds and insurance companies to reduce their risk profiles and
directly consider asset-liability matching in asset allocation decisions including their demand
for corporate debt.
17
Accordingly, in an effort to de-risk, these investors have tended to shift
their asset allocation decisions away from equities to fixed-income securities. Moreover,
different quantitative restrictions have traditionally been applied for pension funds in many
countries, normally stipulating upper limits on investment in specific asset classes, including
equity. A survey conducted by the OECD states that several countries impose limits on the
proportion of equity held in portfolios, such as Austria, Czech Republic, Denmark, Finland,
E.K. & Kimura, H. (2011). “Hierarchical Determinants of Capital Structure”, Journal of Banking & Finance, 35 (2), pp.
358-371. Joeveer, K. (2013), “Firm, Country and Macroeconomic Determinants of Capital Structure: Evidence From
Transition Economies”, Journal of Comparative Economics, 41, pp. 294-308
17
See “Institutional Investors, Global Savings and Asset Allocation”, CGFS papers no:27 (2007), Bank for International
Settlements, accessible at: http://www.bis.org/publ/cgfs27.pdf

11
Germany, Greece, Korea, Norway, Sweden, Switzerland and Turkey.
18
On the other hand,
demand for both equity and debt securities has been stimulated in some EMDEs by well-
developed pension fund industries (notably in Latin America) and insurance industries
(notably in Asia).
Traditionally bank loans constitute the main source of debt financing for the majority of
European firms. However, deleveraging by banks after the global financial crisis has led to a
shrinkage of bank balance sheets and, for the nonfinancial corporate sector, bank borrowing
has been at least partly substituted by an increase in corporate bond issuance.
The diversification of funding sources should lead to more efficient capital allocation and
better risk sharing, with a positive impact on long term growth. Moreover, local bond
issuance does not share the strongly pro-cyclical behaviour of bank lending.
19
b. Role of tax deductibility
In most corporate income tax systems, interest can be deducted in calculating liability to
corporate taxation but returns to equity cannot.
20
Langedijk et al (2015)
21
states that ‘the
corporate debt bias’ – the asymmetric tax treatment of different sources of finance at the
corporate level - originates from historical conventions and does not have any economic
rationale. This asymmetry distorts incentives in two ways:
Debt bias: an incentive for corporates to prefer debt financing over equity financing
beyond that which would otherwise be justified in economic terms.
Debt shifting: cross-country differences in corporate income tax rates that can lead
corporate groups to conduct internal lending from low-tax countries to high-tax
countries, or by locating external borrowings in high-tax countries (although tax
authorities are likely to challenge artificial structures that are intended to evade tax).
The two are related: within multinational groups, the tax gains from debt shifting may
exacerbate the bias in favour of financing externally by debt.
A sizeable empirical literature finds that tax distortions have a significant and considerable
impact on corporate leverage in the nonfinancial sector: one meta-study (calculating a
consensus from the full set of studies) suggests that it could lead, at a corporate income tax
rate of 40 percent, to leverage ratios being 10 percentage points higher than under a system
which was neutral between debt and equity.
22
Similarly, Feld et al (2013) (as cited in
18
OECD (2011), “Pension Funds Investment in Infrastructure: a Survey”, accessible at
http://www.oecd.org/futures/infrastructureto2030/48634596.pdf. See also forthcoming OECD report to the G20,
“Regulation of Insurance Company and Pension Fund Investment” (2015).
19
Ayala, D., M. Nedeljkovic, C. Saborowski, (2015) “What slice of the Pie? The Corporate Bond Market Boom in
Emerging Economies”, IMF Working Paper, WP/15/148
20
The relative treatment of interest and equity income under the personal income and withholding taxes also needs to be
taken into account, and in some cases may offset the asymmetry at the corporate level.
21
Langedijk, S, G Nicodeme, A Pagano and A Rossi (2015) "Debt bias in corporate income taxation and the costs of
banking crises", VOX, CEPR’s policy portal, accessible at
http://www.voxeu.org/article/corporate-debt-bias-and-cost-
banking-crises
22
de Mooij (2011), “The Tax Elasticity of Corporate Debt: A Synthesis of Size and Variations,” IMF Working Paper 11/95

12
Langedijk et al (2015)) predict that each one percentage-point increase in the corporate tax
rate increases the debt-to-assets ratio by 0.27 percentage points.
Policy makers in several countries, increasingly conscious of these distortions, have adopted a
range of measures to mitigate or address them. Action 4 of the G20-OECD Base Erosion and
Profit Shifting (BEPS) project limiting base erosion via interest deductions aims at addressing
profit shifting using interest.
23
This is, however, not always intended to address the basic tax
asymmetry that gives rise to debt bias. To address debt bias, some countries have simply
adopted limits on the interest expense that can be deducted, perhaps relative to current
earnings
24
and a few have provided an ‘Allowance for Corporate Equity’ (ACE) that eases the
asymmetry by also providing a deduction for the cost of equity finance.
25
Countries typically
limit interest deductions and only a few provide an allowance for corporate equity. However,
in the past, such policy responses have been divergent and often ad hoc.
Annex C on ‘The Role of Taxation in Shaping Corporate Liability Structures’ elaborates on
this issue, including on the implications for financial stability.
c. Public disclosures
No evidence is available that public disclosure requirements are a significant factor in
corporate decisions about whether liabilities they issue should be in the form of debt or
equity.
26
The IOSCO annex International Policies for Public Disclosure- Corporates as Public Issuers
of Debt and Equity Securities (Annex D) outlines the steps taken by securities regulators to
enhance transparency for both equity and corporate bond issues. Over time IOSCO has
provided more guidance to regulators on issuers’ disclosure of information to investors in the
public capital markets.
27
The disclosures that a securities regulator requires are intended to give investors information
that is timely, material and not misleading about a company and its circumstances (for
example, issuer domicile, size, industry, number of securities holders). As equity represents
an interest in the residual profits of a company, the pricing of equity may, more keenly than
23
The BEPS report on Action 4 is expected to recommend a consistent and comprehensive approach to limiting interest
deductibility in order to address BEPS risks.
24
For example, in the European Union, several reforms were undertaken in 2012 and 2013 to address the debt bias in
corporate taxation. “These measures mostly tended to restrict the level of deductible interest. France and Portugal
restricted the deduction of interest payments above a threshold of EUR 3 million. In France, the limit is 85% (75% from
2014) of interest paid, while in Portugal it is 70% of profit obtained before depreciation, net financing expenses and taxes
from 2013, falling to 30% in 2017. Spain and the Netherlands revoked their thin capitalisation rules and introduced new
rules on the non-deductibility of certain interest expenses (a so-called earning stripping rule). Spain, Sweden and Finland
limited the scope of deductibility of interest expenses on intra-group loans. In contrast, Hungary introduced a cash-flow
tax for small companies, which in practice allows immediate expensing of all financing costs.” (For details, European
Commission (2013), Tax Reforms in EU Member States: Tax Policy Challenges for Economic Growth and Fiscal
Sustainability, European Economy 5, 2013)
25
These countries include Austria, Belgium, Brazil, Croatia, Italy and Latvia.
26
Companies may face differing disclosure requirements for public offerings and for private offerings (The latter is an
increasing form of issuance for some EMDE corporates.)
27
See IOSCO Objectives and Principles of Securities Regulation, June 2010, available at:
https://www.iosco.org/library/pubdocs/pdf/IOSCOPD323.pdf

13
debt, depend on disclosures made that provide information relevant to future profits. On the
other hand, the pricing of debt may be particularly sensitive to disclosures about the issuer’s
cash flow and liquidity in the timeframe that the debt service is required.
d. Accounting requirements
Issuers prepare the financial statement element of their financial information disclosures in
accordance with a set of accounting standards, such as national accounting standards or
International Financial Reporting Standards (IFRS). IFRS contain standards that address how
an issuer should recognise, measure and present its outstanding debt and equity in its balance
sheet, as well as disclose information about each in the footnotes to its financial statements.
Accounting standards also contain provisions for distinguishing between financial liabilities
and equity in financial statements. Under IFRS a liability is defined as “a present obligation of
the entity arising from past events, the settlement of which is expected to result in an outflow
from the entity of resources embodying economic benefits”, and equity is “the residual
interest in the assets of the entity after deducting all its liabilities”.
28
The IASB is aware that
these definitions, and the more detailed requirements in IAS32 “Financial Instruments:
Presentation”, are not always applied in in a way that results in a consistent distinction
between equity and non-equity instruments. The IASB has a project underway to reassess
these treatments, but it is at an early stage of development.
Particular challenges in reassessing these treatments arise from instruments that include both
some characteristics of debt and some characteristics of equity. It is challenging to determine
whether these instruments (or components of them) are best classified as liabilities or as
equity. It is also important to ensure sufficient disclosure of the characteristics of these
instruments, regardless of how they (or their components) are classified. The classification of
these instruments, and the nature of disclosures about them, have implications for collating
data and statistics about corporate funding structures.
Accounting standards help to elicit historical financial information that addresses users’
objective to be able to assess the amount, timing and uncertainty of future cash flows, and the
information needs of debt and equity investors are converging. In an environment where the
disclosure requirements are similar, disclosure requirements are unlikely to have a significant
effect on companies’ decisions on whether to opt for debt or equity finance. However, the
need for market transparency, and costs of disclosures, can be reasons for some privately-
owned companies to avoid issuing publicly-traded securities at all (whether it be debt or
equity). In such cases, companies may opt instead for bank borrowing or private debt issues.
e. Bank capital requirements
No evidence is available that bank capital requirements are a significant factor in corporate
decisions about whether liabilities they issue should be in the form of debt or equity.
Nevertheless, it is possible that recent regulatory reforms (e.g. Basel III framework, the
Dodd-Frank Act in the US and the Banking Union in the EU) may indirectly have an impact
28
IFRS Conceptual Framework 4.4(b) and 4.4(c). The definition in the US FASB Framework is similar

14
on the decision making process of corporates when choosing between equity or debt
financing, as well as when choosing between bank versus market debt.
Within the banking sector, in December 2014 the Basel Committee issued, as part of its
reforms to the capital framework, a consultation paper on proposed revisions to the
standardised approach for measuring credit risk in the capital framework.
29
The revisions to
the standardised approach are, inter alia, intended to improve the granularity and risk
sensitivity of the framework, reduce the reliance on external ratings and improve the
alignment with exposures risk weighted under the internal ratings-based approach.
To enhance the risk sensitivity of the current standardised approach as set forth in Basel II,
30
the Basel Committee has proposed to introduce a specific treatment for corporate equity
exposures involving higher capital requirements than corporate senior debt exposures.
31
This
would be consistent with other parts of the capital framework which recognise that equity
investments are riskier than debt.
These proposals are still under consultation, and therefore cannot explain the observed
increase in leverage since the crisis; moreover many other factors than regulation affect
banks’ demand for corporate instruments. In addition, given that banks are not typically
major holders of nonfinancial corporate equity, the impact of changes in bank regulation on
the future cost of equity is likely to be negligible.
3. Financial Stability Concerns
Expanding corporate bond markets indicate a deepening and diversification of capital markets
with overall benefits for funding of the real economy. However, financial stability concerns
29
Basel Committee on Banking Supervision. Consultative Document. “Standards: Revisions to the Standardised Approach
for Credit Risk”, March 2015. Accessible at http://www.bis.org/bcbs/publ/d307.pdf
30
The current standardised approach for credit risk is set out in Basel II: International Convergence of Capital Measurement
and Capital Standards: A Revised Framework – Comprehensive Version, June 2006. Accessible at
http://www.bis.org/publ/bcbs128.pdf
.
The current risk weighting for corporate exposures using the standardised approach to calculate regulatory capital
requirements is based upon the external rating of the corporate borrower with risk weights ranging from 20% for AAA to
AA- rated corporates, to 150% for corporates rated below BB-. Unrated corporates – and this constitutes the vast majority
of corporate borrowers – are assigned a risk weight of 100%.
In the current standardised approach equity investments in other banks are risk weighted at either 100% or 250%.
However, a distinct treatment for equity issued by corporates is not prescribed (as opposed to the internal ratings-based
approach, where either bank or corporate equity receive a specific treatment).
31
The proposed rules might still be subject to substantial change since the consultative document mentioned that the Basel
Committee has not ruled out introducing a limited role for external ratings (e.g. to distinguish between investment and
non-investment grade) in the final version. Also, the consultative document mentioned that proposed risk weights were
only for indicative purposes.
Under the proposed revisions to the standardised approach:
- The risk weighting of senior corporate borrowings (i.e. debt) are based upon two risk drivers: revenue and leverage,
with indicative risk weights ranging from 60% to 130%. Exposures to firms with negative equity will be risk
weighted at 300%; and,
- Equity exposures would be risk weighted 300% if the firm is publicly listed and 400% for all other firms. This
approach would align the treatment for equities with that of the simple risk-weight method in the internal ratings-
based approach

15
may arise in instances where overall debt levels are high and the credit quality of nonfinancial
corporate debt has declined.
• Recent increases in corporate debt levels and lower debt-servicing capacity in certain
countries have raised the sensitivity of these corporates to macroeconomic and
financial shocks.
32
High private-sector debt levels can also negatively impact
economic growth
33
, thus potentially reinforcing recessions and hampering recovery.
• The continuing low interest rate environment may lead to excessive upward pressures
on bond prices which – together with declining underwriting standards – could lead to
the build-up of a “bond bubble” (and therefore at some point the risk of a sharp and
disorderly reversal). There could be value in undertaking further work on the
investment objectives and horizons of investors in corporate bonds in this
environment.
• Given the rapid development of non-investment-grade debt markets in many countries,
the sensitivity of markets to shocks may be accentuated in some instances by the lack
of investor experience with the performance of lower-rated debt in credit cycle
downturns.
• The strong issuance of debt in foreign currency raises another financial stability issue.
While many jurisdictions and market participants are relatively sanguine about the
extent of this particular risk,
34
a number of jurisdictions lack data to adequately assess
the degree of any currency mismatch, including the degree to which debt-related
currency exposures are hedged through other instruments. As the volume of foreign
currency debt and cross-border investment in debt grows, so does the need for data on
corporate hedging and other derivatives positions as well as financial statements for
non-listed companies (as well as information on the extent to which companies are
developing natural hedges by matching interest expense with revenues in the same
currency).
35
There would be value in further investigating the potential for
development of domestic corporate bond markets or more affordable hedging
instruments.
Impact of debt on corporate fundamentals
After a prolonged period of extraordinarily low funding costs, a risk exists that interest rates
could reverse rapidly at some point, potentially interacting with declining corporate
profitability to increase the financial stress of certain corporate issuers. To some extent tighter
financing conditions have already taken hold in certain emerging markets. Corporate debt
levels relative to both GDP and earnings have steadily increased.
32
See for example Giroud, X., Mueller, H.M. (2015): “Firm Leverage and Unemployment during the Great Recession”,
NBER Working Paper No. 21076, April 2015.
33
Liu, Y. & Rosenberg, C. (2013), “Dealing with Private Debt Stress in the Wake of the European Financial Crisis”, IMF
Working Paper WP/13/44.
34
For details, see Annex E.1.
35
Letter to the G20 Finance Ministers and Central Bank Governors by IMF/FSB/BIS dated September 11, 2014. Accessible
at http://www.financialstabilityboard.org/wp-content/uploads/r_140923b.pdf
16
In the IMF’s note (Annex A), a sensitivity analysis is conducted looking at the simultaneous
impact of increasing borrowing costs, declining earnings and exchange rate depreciation on
EMDE corporate borrowers’ “debt at risk” (which IMF defines as the debt of firms with
interest coverage ratios below 1.5). This exercise finds that the combination of these shocks
can lead to a material increase in “debt at risk” among EMDE borrowers, particularly in
jurisdictions with high levels of foreign-currency denominated debt and fewer natural hedges
(e.g. export earnings in FX).
The World Bank paper (Annex B) reinforces this point. It notes that pro-cyclical investor
behaviour can have systemic implications for EMDEs once the global cycle winds down or
when global shocks occur. Large foreign currency exposures raise risks, particularly for
unhedged issuers, and the recent rapid strengthening of the US dollar against most EMDE
currencies may already have increased strains for some borrowers. In this context, the
inevitable exit from extraordinary monetary policies will tighten international funding
conditions, which could prove disruptive for EMDE currencies, balance sheets, and funding
capacity. Additionally, fragility in EMDEs can be further compounded by the concentration
of foreign investors in their growing but still relatively shallow local financial markets.
Bank exposures
Corporate fragility can have important knock-on effects on the banking sector. First of all, as
the OECD-IMF paper (Annex C) sets out, if debt is preferred over equity and debt is
primarily channelled through the banking system, debt bias increases the size of bank loan
books. In addition, the IMF paper (Annex A) notes that weaknesses in the corporate sector
could put pressure on banks’ asset quality. In particular, across a sample of 15 major EMDEs,
sensitivity analysis illustrates that a 15% default on the total debt at risk owed to banks would
lead to a significant deterioration in banks’ buffers – defined as Tier 1 capital and
provisioning – in more than half the countries. And in about a quarter of cases, these buffers
would appear particularly low, when benchmarked against Basel III’s minimum capital
requirements (including the capital conservation buffer requirement)
In some EMDEs (as well as advanced economies) corporate deposits have increased steadily
over the past few years. A BIS paper (Annex E.3) suggests that another channel of corporate
spill-over on banks could be through the impact of the withdrawal of corporate deposits on
local banks’ funding, especially if these banks have come to rely on corporate deposits for
part of their wholesale funding. Deposits from corporates exploiting the “carry” between local
and foreign currency interest rates could be withdrawn if the carry positions are unwound
when interest rate differentials narrow or market volatility increases. Deposits that are
denominated in foreign currencies, in turn, tend to be more pro-cyclical than other types of
deposits and may thus be subject to sudden withdrawals by corporates facing roll-over risks.
Debt and broader market liquidity concerns
High corporate debt levels can act on financial stability both directly through credit cycle
downturns and defaults, and indirectly through market channels and mark-to-market losses. A
key concern amongst policy makers is that secondary market liquidity in bond markets has
declined, and that in times of stress this could exacerbate price movements and lead to
outsized losses for market participants. (In such stress periods, market participants may find
that they are only able to sell those of their assets that are most liquid; so, for instance, selling
pressure in EMDE markets may be concentrated in larger countries with more liquid assets.)
17
Work done by the BIS suggests that both cyclical and structural components have contributed
to this reduction in secondary market liquidity. Market-making practices have changed,
putting upward pressure on bid-ask spreads and trading costs and resulting in concentration of
liquidity into a narrow set of instruments at the expense of others.
From a policy perspective, however, a key question is whether the trends underway in market-
making are consistent with robust liquidity at times of stress, i.e. the times when liquidity is
most needed. If the trends are consistent, then the price of market-making services should rise
in normal times to account for the higher costs of liquidity in bad times. Admittedly, price
realignments are unlikely to prevent an exceptionally large shock from bringing financial
markets to a halt. But by properly pricing liquidity risk, price realignments should encourage
financial behaviour that takes market liquidity into account and does not naively rule out an
eventual price collapse, especially when excesses are building up. By reducing market
participants' vulnerability to ordinary liquidity shocks, this would make it less likely that such
shocks could feed on themselves and undermine system-wide liquidity.
At the same time that the nonfinancial corporates have expanded their market-based
borrowing, asset managers, through the investment funds they manage, have become a
relatively larger part of the investor base. The potential financial stability risks emanating
from the asset management industry have been discussed in the IMF’s April 2015 Global
Financial Stability Report. The FSB also has work underway to assess the financial stability
issues related to asset management and the potential for a disorderly bond market sell-off in
the current environment and will report to the G20 later this year.
Data gaps
The IMF-FSB-BIS report to G20 Finance Ministers and Central Bank Governors in
September 2014 on data gaps involving foreign exchange exposures included key messages
from a workshop jointly held by the BIS Committee on the Global Financial System (CGFS)
and the FSB Standing Committee on Assessment of Vulnerabilities (SCAV) on currency
mismatches and leverage in corporate balance sheets. The key messages of this workshop (see
Annex E.1) were: that EMDE corporate leverage was rising; that increasing use of bond
markets may have shifted duration risk to institutional investors; and that the unavailability of
consistent granular data might mask the concentration of risk in particular sectors or
institutions.
The two main data gaps identified by the workshop participants were, first, in corporate
hedging activities and other derivatives positions; and second, in the availability of financial
statements for non-listed companies. The workshop summary includes suggestions for a
number of approaches that could help to fill these data gaps.
Structural versus cyclical factors
The financial stability concerns outlined above may have both cyclical and structural causes,
as follows:
Leverage: Much of the increase in debt likely results from the very low interest rate
environment, which is clearly cyclical (unless the low interest rate environment is the “new
normal,” in which case this could be considered structural). In addition, bank deleveraging
has contributed to the increased bond issuance, and this deleveraging has both cyclical
(cleaning up balance sheets post-crisis) and structural (new regulations making lending more

18
capital intensive) components. Other key elements behind increased leverage have been
financial deepening in EMDEs and the tax advantages of debt financing, both of which are
structural.
Possible asset price bubbles: This owes, in part, to investors searching for yield and moving
towards higher-yielding assets. The source of the search for yield is related to the very low
risk-free rates that resulted from extraordinary monetary policy and hence is cyclical.
However, to the extent that the increased demand for some bonds is driven by regulation that
has driven up the demand for high-quality liquid assets, there are structural elements as well.
Pro-cyclicality: If short-term investors increase their involvement in the corporate debt
market, this can increase the market’s vulnerability to pro-cyclicality. To the extent that
money has flowed to emerging market assets as a result of a search for yield, this represents a
cyclical factor.
Currency mismatch: To the extent that the currency mismatch present in some cases has been
driven by the ease of issuing debt denominated in foreign currencies in the current
conjuncture, this would be cyclical. However, another reason to issue debt in foreign
currencies is because of a lack of depth in domestic markets, which is a structural cause.
Interconnectedness: One source of increased interconnectedness can come from a form of
carry trade whereby corporates raise funds abroad and deposit those funds in the domestic
banking system. This could be cyclical to the extent it is driven by a search for yield, but it
also has structural causes to the extent that stable exchange rate regimes facilitate this type of
carry trade. In addition, a bias toward debt financing makes firms more reliant on banks than
they otherwise would be, and this is a structural cause of interconnectedness.
Data gaps: Data gaps are a structural concern, although the concern is exacerbated when debt
issuance goes up, which can have cyclical causes.
4. The Potential Role of Macroprudential Policies in Addressing
Financial Stability Concerns
36
As noted in the FSB-IMF-BIS progress report to the G20 on Macroprudential Policy Tools
and Frameworks
37
, macroprudential policy is characterised by reference to three defining
elements:
(i) Its objective: to limit systemic risk – the risk of widespread disruptions to the
provision of financial services that have serious negative consequences for the economy at
large.
(ii) Its scope: the focus is on the financial system as a whole (including the interactions
between the financial and real sectors) as opposed to individual components (that take the rest
of the system as given).
36
This is based on “Staff Guidance Note on Macroprudential Policy—Detailed Guidance on Instruments” prepared by IMF
staff and completed on 6 November 2014. Accessible at http://www.imf.org/external/np/pp/eng/2014/110614a.pdf.
37
http://www.financialstabilityboard.org/2011/10/r_111027b/, 27 October 2011.

19
(iii) Its instruments and associated governance: it uses primarily prudential tools calibrated
to target the sources of systemic risk. Any non-prudential tools that are part of the framework
need to clearly target systemic risk.
To mitigate any financial stability risks from corporate liability structures, policymakers could
explore the use of macroprudential tools—including tools specifically targeted at corporate
credit as well as at foreign exchange risks—to complement other policy measures. Currently,
most of the tools available fall under the purview of bank supervisors. The tools vary by
jurisdiction, and any decisions over the use of such tools would need to take into account
national economic and financial conditions, including whether the type of corporate financing
(e.g. bank or market based) appear to present systemic risks.
Tools that target corporate credit
If strong growth in bank lending to the corporate sector is generating systemic risks,
macroprudential authorities could consider raising capital requirements on banks’ lending to
firms, e.g. by increasing risk-weights on these exposures, or by imposing countercyclical
capital buffers. The build-up of additional capital buffers could increase banks’ resilience to
corporate credit shocks, while these measures may at the same time restrain the growth in
bank credit to the corporate sector. If such capital measures are not expected to be sufficiently
effective in containing systemic risk, caps on the growth rate of new credit or the share of new
corporate loans in total new loans could also be considered. Indirectly, when they incentivise
banks to ration out less creditworthy borrowers, caps on credit growth can also help improve
banks’ underwriting standards.
Any use of such tools would need to be carefully assessed and calibrated. Applying broad
measures on corporate credit can restrict credit growth to industry sectors that are receiving
too much credit, but may also further restrict credit to industry sectors already experiencing a
downturn or receiving insufficient credit. Such caps could also have spill-over effects by
leading banks to increase credit instead to other sectors (e.g. the consumer sector).
Tools that target foreign exchange loans
The credit risk associated with firms with large foreign currency debts is significantly higher,
particular for those without “natural” hedges. In addition, banks that lend in foreign currency
can also be exposed to roll-over risks if there is a maturity mismatch with the underlying
financing, e.g., if medium- or long-term foreign currency loans are financed by short-term
foreign currency borrowing from abroad. To alleviate credit risks, targeted macroprudential
policy measures such as higher risk-weights, and outright limits, on banks’ lending in foreign
currency can help, while recognizing that excessive flexibility in use of risk weights could
impair predictability.
38
The extent to which these tools can differentiate effectively between
hedged and unhedged corporate borrowers will depend on the availability of information and
supervisory capacity. These areas should be strengthened to enable well-informed and prudent
decisions regarding the risks involved in foreign currency borrowing.
If de facto dollarisation is widespread, other structural tools should be considered alongside
tighter macroprudential measures. These would include ensuring sound macroeconomic
38
Here, as with other type of tools, use of macroprudential measures needs to be consistent.

20
policy frameworks; encouraging the development of domestic financial markets in domestic
currency; and a shift of public sector borrowing in foreign currency to domestic currency.
Tightly calibrated macroprudential tools that may complement these measures include limits
on net open position in foreign exchange; differentiated reserve requirements across
currencies; or liquidity requirements differentiated by currency.
Potential leakages
As noted, most of the current tools available for addressing systemic risks arising corporate
credit fall under the purview of bank supervisors. In implementing macroprudential policies in
the banking sector, macroprudential authorities should be mindful of the potential leakages
that could arise when corporate borrowers substitute domestic bank credit with borrowing
from unregulated financial institutions or domestic capital markets (domestic leakages), as
well as borrowing from abroad (cross-border leakages). These leakages can constrain the
effectiveness of policies. In particular, while the intended increase in resilience for the
banking sector from higher capital requirements can be preserved, leakage can make it
difficult for authorities that seek to constrain the build-up of leverage in the corporate sector
to effectively achieve that goal.
Containing these leakages can be particularly challenging in countries where capital markets
are well-developed and where corporate borrowers have access to alternative sources of
credit. Where credit is being provided by non-banks, such as dedicated leasing companies, or
other non-bank finance companies, domestic leakages can be reduced by extending the
regulatory perimeter to unregulated entities. (One such example of extending the perimeter
would be, in the case of non-banks related to banks, expanding the scope of prudential
requirements so as to consolidate such activity.) However, containing corporate leverage can
be more difficult where market-based funding, such as through corporate bond issuance, is
readily available. Macroprudential authorities should ensure that banks have sufficient capital
to ensure resilience to corporate credit shocks, but tools need to be well calibrated;
inappropriate and untimely usage of macroprudential tools to restrict corporate credit could
incentivise more leakage and exacerbate the risks.
Strategies to address cross-border leakages can include reciprocity arrangements; greater host
control; and in certain circumstances, targeted capital flow management measures (CFMs).
39
Reciprocity on risk weights for corporate exposures is currently not subject to international
agreement, and may be difficult for countries with well-developed capital markets, but some
host authorities are actively pursuing cooperation with other national authorities on the
implementation of higher risk-weights and counter-cyclical capital buffers. Greater host
control includes encouraging or requiring banks that are foreign affiliates to be established as
subsidiaries, subject to countries’ rights and obligations under international agreements
including GATS and the OECD Codes of Liberalisation, in order to subject them to capital
regulation and/or caps on credit growth.
39
Measures that are both capital flow management and macroprudential measures can have a role in supporting both
macroeconomic policy adjustment and safeguarding financial system stability in certain circumstances. These include
circumstances: (i) where the room for adjusting macroeconomic policies is limited, (ii) where the needed policy steps
require time, or when the macroeconomic adjustments require time to take effect, (iii) where an inflow surge raises risk
of financial system instability, or (iv) where there is heightened uncertainty about the underlying economic stance due to
the surge. However, such measures should not be used as substitutes for warranted macroeconomic adjustment.

21
The use of targeted CFMs needs to be in line with established principles ((IMF (2012); IMF
(2015))
40
and OECD (2015)
41
, and emphasis should be given to lengthening the maturity of
corporate debt issuance and reducing the reliance on FX borrowing. As an alternative or
additional measure, policies that correct the tax bias favouring debt would reduce corporate
demand for credit and help mitigate the risks from excessive corporate leverage.
The need to consider benefits and costs
In implementing these measures, macroprudential authorities need to strike a balance between
ensuring the effectiveness of these tools in securing financial stability, and the need to
maintain the efficient provision of financial services so as not to jeopardize economic growth
and development. This implies a need to calibrate these macroprudential measures carefully
and in a manner that takes account of country circumstances and the phase of the credit cycle.
Where stability risks are rising in the upswing of the credit cycle, macroprudential authorities
should consider tightening macroprudential tools. Where these risks have receded, or financial
stress materializes, these measures could be relaxed to encourage credit growth to support
economic activities. To guide the calibration of macroprudential tools, bank and corporate
balance sheet indicators should be used along with market and credit flow indicators.
5. Possible next steps
There is evidence that corporate debt levels relative to GDP are increasing in many countries.
While in many cases this may represent welcome financial deepening, in some cases this
could adversely affect financial stability. Prudential regulations are aimed at controlling the
financial risks to banks from corporate exposures. Basel Committee capital standards require
banks to hold capital in proportion to credit risk, and the ongoing review of the standardised
and internal-model approaches aim, among other things, to improve the risk-sensitivity of
current standards. Prudential supervisors also regularly require stress tests of banking assets
(including for corporate exposures). Furthermore, accounting standard setters (both the IASB
and US FASB) are introducing expected loss approaches to provisioning that will require
more forward-looking provisions that have regard to wider macroeconomic factors. All of
these changes to regulation could result in some banks being required to raise additional
capital and should have the effect of mitigating potential adverse effects on financial stability
that might arise via banking sector exposures to corporate loans.
However, better tools are needed to monitor for, and to address, any excessive corporate debt
accumulation that may be adding to systemic risks, and there could also be value in further
examining whether there are incentives that may artificially favour debt over equity and,
where necessary, removing any such incentives. Possible measures that could be further
discussed by the FSB and G20 Ministers and Governors include:
40
IMF (2012), “The Liberalization and Management of Capital Flows – An Institutional View”, November 2012.
Accessible at http://www.imf.org/external/np/pp/eng/2012/111412.pdf
, IMF (2015), “Measures which are Both
Macroprudential and Capital Flow Management Measures: IMF Approach” April 2015. Accessible at
http://www.imf.org/external/np/pp/eng/2015/041015.pdf.
41
OECD (2015), “The OECD’s Approach to Capital Flow Management Measures used with a Macro-prudential Intent” –
Report to G20 Finance Ministers”, April 2015. Accessible at
http://www.oecd.org/g20/topics/trade-and-investment/G20-
OECD-Code-Report-2015.pdf
22
• Filling data gaps: Information on corporate sector exposures, while not costless to
collect, is essential for policy makers to assess the risks and develop policies
accordingly. The CGFS/SCAV workshop noted that regular reporting of more
consistent and granular data would enable more effective monitoring of the liability
structure of the corporates, the extent of foreign currency hedging and other
derivatives positions, as well as data on non-listed companies. In the meantime,
supervisors should use existing data to monitor foreign currency exposures and detect
emerging vulnerabilities.
• Addressing the debt-equity tax bias: The clear evidence of a sizeable tax bias
toward debt financing raises evident financial stability concerns. While there is
growing concern with the problems caused by the asymmetric tax treatment of debt
and equity, the significance of this bias has not been assessed, and there is no
consensus on how best to address it. The IMF/OECD paper notes that a pragmatic
response to address this bias is to extend rules limiting excessive interest deductions as
proposed in the G20/OECD BEPS Project, although interest limitation rules may
generally be more focussed on addressing debt shifting than the asymmetry at the
heart of the debt bias. While some countries have enacted an ‘Allowance for
Corporate Equity’ (ACE), such an approach needs careful design to address concerns
about revenue cost and potential for tax avoidance. In navigating these complex
issues, policy makers would benefit from a careful review of the significance of tax
distortions for financial stability and of the effectiveness of the different approaches
that have been, or might be adopted (unilaterally or in cooperation).
• Macroprudential policy tools to address the conjunctural factors: To mitigate the
risks presented by this rapid growth of corporate leverage, particularly in foreign
currency, national policymakers should explore the use of macroprudential tools to
mitigate such risks taking into account the likely benefits and costs to the financial
system and different national economic and financial conditions (as described in
section 4 above).
• Potential further work in 2016: There could be value to further work including on: i)
further analysis of data on nonfinancial corporate leverage to examine the extent to
which particular economic factors drive the liability structure choices of different
types of corporates and whether any financial stability concerns arise from these, ii)
existing country experiences with the use of macroprudential tools used to address
risks arising from corporate debt financing, iii) country-specific case studies on
addressing the debt-equity tax bias.
23
List of contributions by International Organisations annexed to this paper
A IMF paper Analysis of Balance Sheet Risks in Emerging Market Corporates
B World Bank paper Global Liquidity and External Bond Issuance in Emerging Markets and
Developing Economies
C IMF-OECD paper The role of taxation in corporate liability structures
D IOSCO paper International Policies for Public Disclosure - Corporates as Public Issuers
of Debt and Equity Securities
E BIS papers Risks related to EME corporate balance sheets: the role of leverage and
currency mismatch; Nonfinancial corporations from emerging market economies and
capital flows; and Summary: Joint CGFS – FSB-SCAV workshop on risks from currency
mismatches and leverage on corporate balance sheets

24
Total debt by sector (excluding the financial sector)
As a percentage of GDP
Table 1
Level in 2014 Change since end–2007
1
House–
hold
Corpo–
rate
Govern–
ment
2
Total House–
hold
Corpo–
rate
Govern–
ment
2
Total
Advanced
economies
3
74 89 96 259 –4 4 32 32
United States
78 68 88 235 –17 1 38 21
Japan
66 103 209 379 0 4 59 62
Euro area
61 103 92 257 2 6 25 33
France 56 122 95 273 10 18 30 58
Germany 55 55 75 185 –8 0 10 2
Italy 43 79 132 254 6 6 30 43
Netherlands 113 124 68 305 4 –1 24 28
Spain 73 114 96 284 –7 –8 59 44
Australia
116 75 30 221 10 –3 22 29
Canada
93 103 64 260 17 14 15 46
Hong Kong SAR
64 218 5 287 13 87 3 103
Korea
83 104 38 225 11 14 14 43
Singapore
60 80 99 239 21 24 12 57
Sweden
83 166 41 290 19 36 1 56
Switzerland
120 90 34 245 12 19 –6 25
United King
dom 88 77 88 253 –7 –9 46 30
Emerging markets
3
26 88 42 156 10 33 2 44
Argentina
6 10 43 59 2 0 –4 –2
Brazil
4
25 47 62 134 12 19 –2 29
China
35 154 41 230 16 53 6 76
India
9 51 66 126 –2 9 –9 –1
Indonesia
17 22 25 64 6 8 –9 5
Malaysia
4
68 62 53 183 13 0 11 25
Mexico
15 21 33 69 2 7 12 21
Russia
4
19 50 15 86 8 10 5 26
Saudi Arabia
11 37 2 50 –1 4 –19 –16
South Africa
38 33 53 123 –4 –1 20 16
Thailand
68 50 30 148 23 4 7 34
Turkey
21 51 34 106 10 27 –8 29
1
In percentage points of GDP.
2
BIS Credit to the government at nominal values except for Korea for which only market values are
available.
3
Weighted averages of the economies listed based on each year GDP and PPP exchange rates.
4
Breakdown of household
debt and corporate deb
t is estimated based on bank credit data.
Sources:
IMF, World Economic Outlook; OECD; national sources; BIS database on total credit.

25
Total debt by sector (excluding the financial sector)
As a percentage of GDP
Table 2
Level in 2014 Change since end–1999
1
House–
hold
Corpo–
rate
Govern–
ment
2
Total House–
hold
Corpo–
rate
Govern–
ment
2
Total
Advanced
economies
3
74 89 96 259 14 9 34 56
United States
78 68 88 235 13 7 40 59
Japan
66 103 209 379 –8 –27 103 68
Euro area
61 103 92 257 13 22 19 54
France 56 122 95 273 22 31 33 86
Germany 55 55 75 185 –15 2 14 1
Italy 43 79 132 254 23 27 19 69
Netherlands 113 124 68 305 39 3 5 51
Spain 73 114 96 284 33 48 33 114
Australia
116 75 30 221 50 13 9 73
Canada
93 103 64 260 31 11 –12 30
Hong Kong SAR
64 218 5 287 6 108 5 119
Korea
83 104 38 225 36 –3 28 57
Singapore
60 80 99 239 23 6 13 41
Sweden
83 166 41 290 37 70 –24 83
Switzerland
120 90 34 245 14 11 –16 11
United King
dom 88 77 88 253 22 9 46 76
Emerging markets
3
26 88 42 156 17 39 –15 37
Argentina
6 10 43 59 0 –10 9 –1
Brazil
4
25 47 62 134 16 20 5 41
China
35 154 41 230 25 56 3 84
India
9 51 66 126 3 28 –4 27
Indonesia
17 22 25 64 … … … …
Malaysia
4
68 62 53 183 … … 15 –17
Mexico
15 21 33 69 6 0 11 17
Russia
4
19 50 15 86 18 22 –99 –54
Saudi Arabia
11 37 2 50 3 9 –101 –89
South Africa
38 33 53 123 6 5 –1 7
Thailand
68 50 30 148 19 –45 11 –24
Turkey
21 51 34 106 19 29 –9 –20
1
In percentage points of GDP.
2
BIS Credit to the government at nominal values except for Korea for which only market values are
available.
3
Weighted averages of the economies listed based on each year GDP and PPP exchange rates.
4
Breakdown of household
debt and corporate debt is estimated based on bank credit data
.
Source
s: IMF, World Economic Outlook; OECD; national sources; BIS database on total credit.

Balance Sheet Risks in Emerging Market Corporates
International Monetary Fund—Monetary and Capital Markets Department (MCM)
1
August 12, 2015
Contents Page
I. Rising Vulnerabilities .............................................................................................................1
II. Sensitivity Analysis ...............................................................................................................5
III. Impact On Banks..................................................................................................................8
IV. Policy Implications ..............................................................................................................9
Appendix 1. Methodology for Corporate Sensitivity Analysis ...............................................10
I. RISING VULNERABILITIES
Corporate debt issuance in major emerging market countries has risen sharply in recent years,
against the backdrop of ample global liquidity and prolonged low global interest rates. New
corporate bond issuance rose 10 percent in 2014, with Asia leading other regions (Figure 1).
Issuance in foreign currency amounted to one fifth of total issuance over the last five years,
growing at a compounded annual rate of 15 percent during the period. Sectors such as
industry, utilities and energy accounted for three-quarters of the new debt in 2014. In Latin
America (Latam) and Europe, Middle East and Africa (EMEA), the energy sector comprised
the largest share of issuance, while in Asia, the lion share came from industries.
Along with the rise in corporate bond issuance, borrowing from banks has also increased. In
aggregate, this has led to higher levels of corporate leverage as measured by the ratio of
corporate debt to GDP. In some countries, this ratio is close to levels seen during the Asia
financial crisis. Although economic growth has slowed the rise of the corporate debt to GDP
ratio, it is high in China, Chile and Malaysia. In China, corporate debt is mostly funded by
domestic banks and domestic capital market, thus rendering firms there more sensitive to
domestic factors. In contrast, firms in Chile and Malaysia are more dependent on external
financing.
Slowing growth in emerging markets is putting pressure on firms’ profitability. Corporate
profitability has declined relative to its five-year averages across most emerging market
countries, with broad-based weaknesses across sectors (Figure 2). At the same time, debt has
1
The lead author of this note is Julian Chow.

2
grown faster than earnings in most countries, evidenced by the increase in the ratio of net
debt to EBIT. As a result, debt-servicing capacity has deteriorated, and the share of debt at
risk
2
in total corporate debt has risen by 22 percent in 2014 from levels in 2010.
Despite the growing exposure to foreign currency debt, comprehensive firm-level data on
foreign currency liabilities, the currency breakdown of these liabilities, and their maturity
structure remain sparse. The size of foreign currency debt may be underestimated,
particularly in instances where firms issue debt abroad through special purpose vehicles
(SPVs) or affiliates and do not consolidate these exposures in their balance sheets. Moreover,
data on “natural” hedges from foreign currency revenue and financial hedges from
derivatives are extremely limited
3
. Unless the collection of financial data on corporates
improves, data limitations will continue to complicate monitoring and risk management.
2
Debt at risk is defined as debt owed by firms where the interest coverage ratio is below 1.5.
3
The effectiveness of these financial hedges are also a concern as some derivative hedges are undertaken for the
short term, and derivative instruments with knock-out features will terminate once the exchange rate depreciates
beyond certain thresholds thus rendering the hedge worthless.

3
Figure 1. Nonfinancial Corporate Debt Issuance and Rising Leverage
Corporate bond issuance has risen sharply over the past
several years…
... with Asia leading the rise
1. Bond Issuance by Currency (in US$ billion)
2. Bond Issuance by Regions (in US$ billion)
Industry, utilities and energy account for bulk of the issuance …
… with energy being the largest share in Latam and EMEA, and
industry in Asia
3. Bond Issuance by Sector (in US$ billion)
4. Bond Issuance by Sector in 2014
Bank lending has also increased…
… leading to higher debt loads and high levels of corporate
leverage in several countries
5. Bank lending to Nonfinancial Corporate (in US$ billion)
* scaled by 10 billion; **scaled by 100 billion.
6. Nonfinancial Corporate Debt to GDP (in percent)
Sources: IMF, Bloomberg, Standard Chartered Bank, Orbis
0
100
200
300
400
500
600
700
800
900
2014
2013
2012
2011
2010
2009
2008
Foreign Currency
Local Currency
0
100
200
300
400
500
600
700
800
2014
2013
2012
2011
2010
2009
2008
Asia
Latam
EMEA
0
100
200
300
400
500
600
700
2014
2013
2012
2011
2010
Others
Industry
Utilities
Materials
Energy
ICT
Consumer
32%
17%
16%
0%
10%
20%
30%
40%
50%
60%
70%
80%
90%
100%
Asia
Latam
EMEA
Others
Industry
Utilities
Materials
Energy
ICT
Consumer
39%
42%
31%
China**
Indonesia
Malaysia
Philippines
Thailand
Argentina
Brazil*
Mexico
Peru
Bulgaria
Hungary
Poland
Russia*
Tu r key*
S.Africa
0
20
40
60
80
100
120
140
160
180
200
0 20 40 60 80 100 120 140 160 180 200
2014
2010
Chile
Shaded area shows
higher bank lending
in 2014
-10
10
30
50
70
90
110
Argentina
Philippines
India
Mexico
Poland
Indonesia
Brazil
Peru
Hungary
Russia
South Africa
Turkey
Bulgaria
Thailand
Malaysia
Chile
China
External Debt
Domestic Capital Market Debt
Bank Loans
Korea (1996)
Thailand (1996)

4
Figure 2. Weakening Nonfinancial Corporate Credit Metrics
Slowing economic growth is putting pressure on profitability …
... with broad-based weaknesses across sectors
1. Returns on Equity
(in percent, median
)
2. Returns on Equity by Sector
(in percent, median
)
*Primary sector includes oil and gas, mining, agriculture.
Debt has also grown faster than earnings in most countries… Leading to weaker debt service capacity …
3. Net Debt to EBIT (in multiples, median)
4. Interest Coverage Ratio (EBIT/Interest Expense, median)
… across most sectors
As a result, debt at risk is on the rise…
5. Interest Coverage Ratio by Sector (EBIT/Interest
Expense, median)
6. Debt at Risk
1
(in percent of total debt)
1.Refers to debt of firms with interest coverage ratios below 1.5
Sources: IMF, Bloomberg, Worldscope, Orbis, IMF Staff Computations
Argentina
Chile
Brazil
Mexico
China
India
Indonesia
Malaysia
Thailand
Philippines
S
outh Africa
Poland
Hungary
Bulgaria
4
5
6
7
8
9
10
11
12
13
4 5 6 7 8 9 10 11 12 13
2014
5-year Average
Shaded area shows lower
ROE in 2014 compared to
5-year Average
2
4
6
8
10
12
14
Primary sector
Construction
Transport
Food, beverages, tobacco
Metals & metal products
Hotels & restaurants
Post & telecommunications
Gas, Water, Electricity
Other services
2014
2010
Argentina
Chile
Brazil
Mexico
China
India
Indonesia
Malaysia
Thailand
Philippines
South Africa
Poland
Hungary
Russia
Bulgaria
-1
0
1
2
3
4
5
-1 0 1 2 3 4 5
2014
5-year Average
Shaded area shows higher net debt
relative to earnings in 2014
Argentina
Chile
Brazil
Mexico
China
India
Indonesia
Malaysia
Thailand
Philippines
S.Africa
Poland
Hungary
Russia
Bulgaria
0
1
2
3
4
5
6
7
8
0 2 4 6 8
2014
5-year Average
ICR<2
Shaded area shows lower in
2014 compared to 5-year
Average
1.0
1.5
2.0
2.5
3.0
3.5
4.0
4.5
5.0
5.5
Primary sector
Construction
Transport
Food, beverages, tobacco
Metals & metal products
Hotels & restaurants
Post & telecommunications
Gas, Water, Electricity
Other services
2014
2010
10
15
20
25
30
35
40
45
All EM
Latam
Asia
EMEA
2010
2014
+61%
+18%
+5%
+22%

5
II. SENSITIVITY ANALYSIS
Higher debt loads and lower debt-servicing capacity increase the corporate sector’s
sensitivity to macroeconomic and financial shocks. Exchange rate depreciation exposes firms
to losses from the revaluation of FX debt service. At the same time, tighter external financing
conditions could precipitate a rise in borrowing costs, and a further slowdown in economic
growth could reduce earnings.
Recognizing that these shocks may have an adverse impact on the health of the corporate
sector, we conducted a sensitivity analysis on a sample of companies in selected emerging
market countries
4
(Appendix 1). The magnitudes of the “severe but plausible” shocks for the
stress scenarios are based on the following considerations:
• 30 percent increase in borrowing costs, derived from an average of the country
median increase in firms’ borrowing costs during the Global Financial Crisis. Country
medians ranged from 3 percent to 69 percent.
• 20 percent decline in earnings, based on an average of the country median decline in
firms’ EBIT during the Global Financial Crisis. Country medians ranged from an
increase of 12 percent to a decline of 106 percent.
• Exchange rate depreciation of 30 percent against the dollar based on dollar
appreciation of late 1990s, and 15 percent depreciation against the euro to take into
account of the divergence in monetary policy in the U.S. and Euro area
5
.
Potential hedges are also taken into consideration based on the following assumptions:
• The “natural” hedge is based on the share of foreign sales. The currency breakdown
of the natural hedge between the dollar and the euro is derived from the trade weights.
• The financial hedge assumes 50 percent derivative hedging on FX debt interest and
principal.
The combination of these three shocks could significantly increase debt at risk, especially in
countries with high shares of external debt and low natural hedges (Figure 3). This is
especially worrisome in countries where firms’ debt interest coverage ratios are already
weak. Debt at risk could rise above half of total corporate debt in Brazil, Bulgaria, Hungary
4
They include China, India, Indonesia, Malaysia, Thailand, Philippines, Brazil, Mexico, Chile, Argentina, Peru,
Russia, Poland, Hungary, Bulgaria and South Africa.
5
We recognize that some currencies are pegged, or are in a heavily managed regime. This sensitivity analysis
examines what could potentially happen in an adverse scenario.

6
and Indonesia. Within the sample of 15 countries
6
, debt at risk of weak firms could increase
by another $680 billion, accounting for 45 percent of total corporate debt compared to 29
percent of total corporate debt in 2014. Large firms continue to account for the bulk of the
debt at risk in Asia and Latam, while in EMEA, one third of the debt at risk is attributed to
small and medium size firms.
Shocks to earnings, interest rate and exchange rates could affect commodities-related firms
and state-owned enterprises (SOE) in some countries. Results from the sensitivity analysis
suggest that a combination of the three shocks could substantially increase the commodities
sector debt at risk in Hungary, Philippines, Indonesia and Thailand, though they remain at
low levels in these countries. In Brazil, the debt at risk from commodities-related companies
is high, comprising around one third of total debt. For SOEs, debt at risk could rise above 3
percent of GDP in Malaysia, Hungary, China, Thailand and Brazil, if these shocks
materialize.
Caveat
It is worth noting that the coverage and representativeness of the sample obtained from the
Orbis database vary across countries. This, to certain extent, may lead to some biasness in the
results and renders cross-country comparisons difficult. Where small firms are under-
represented in the sample of a particular country, the analysis may understate the true debt at
risk.
6
Excludes Turkey due the lack of a good representative sample of firm-level data.

7
Figure 3. Sensitivity Analysis
Some countries have relatively more foreign sales that provide
“natural” hedges…
…shocks to exchange rates, earnings and interest expense could
weaken debt servicing capacity …
1. Share of Foreign Sales and FX Debt
1
(in percent of
Total Sales and Total Debt, respectively)
1. The share of foreigh sales is based on median, from Worldscope’s
data. The share of external debt is derived from QEDS.
2. Interest Coverage Ratio (EBIT/Interest Expense,
median)
*Natural hedge is based on trade exposure and foreign sales; financial
hedge assumes 50 percent hedge on FX debt principal and interest.
…leading to higher debt at risk …large firms continue to account for the bulk of the debt at risk
3. Debt at Risk (in percent of Total Corporate Debt)
4. Distribution of Debt at Risk by Firm Size (in percent
of total debt at risk)
**Firm size is derived from the country’s sample firms by asset size:
Large=Top 25th percentile; Small=Last 25th percentile; Medium=In
between.
Commodities-related firms are weak in some countries…
…while some state-owned companies are also at risk …
5. Debt at Risk of Commodities Sector (in percent of
total debt)
6. SOE Debt at Risk (in percent of GDP)
Sources: IMF, Bloomberg, Haver, Worldscope, Orbis, IMF Staff Computations
-80
-60
-40
-20
0
20
40
Brazil
Chile
China
South Africa
Philippines
Malaysia
Bulgaria
Thailand
Russia
India
Poland
Indonesia
Mexico
Argentina
Hungary
External Debt/ Total Debt
Foreign Sales/ Total Sales
0
1
2
3
4
5
6
Brazil
Bulgaria
Russia
Argentina
Indonesia
India
Chile
Mexico
Poland
S.Africa
Philippines
China
Thailand
Hungary
Malaysia
Current
FX, Earnings and Interest Shocks, With Natural and Financial Hedge
FX, Earnings and Interest Shocks, With Natural Hedge
FX, Earnings and Interest Shocks, Without Hedge
ICR below 1.5
0
10
20
30
40
50
60
70
80
90
Philippines
Malaysia
Chile
Russia
S.Africa
Thailand
Poland
Mexico
China
Argentina
Indonesia
Hungary
India
Brazil
Bulgaria
Current
FX, Earnings and Interest Shocks, Without Hedge
FX, Earnings and Interest Shocks, With Natural Hedge Only
FX, Earnings and Interest Shocks, With Natural and Financial Hedge
0
10
20
30
40
50
60
70
80
90
100
LATA M
Asia
EMEA
Small Firms
Medium Firms
Large Firms
0
5
10
15
20
25
30
35
Mexico
Poland
Thailand
Philippines
S.Africa
India
Russia
Chile
Malaysia
Hungary
Bulgaria
China
Argentina
Indonesia
Brazil
2014
After FX, Earnings and Interest Shocks
0
1
2
3
4
5
6
7
Argentina
Mexico
Philippines
Hungary
Indonesia
Russia
Chile
Malaysia
Bulgaria
South Africa
Poland
India
China
Thailand
Brazil
2014
After FX, Earnings and Interest Shocks
3% of GDP

8
III. IMPACT ON BANKS
Weaknesses in the corporate sector could put pressure on banks’ asset quality (Figure 4). The
ability of banks to withstand losses will depend on the extent of available buffers. Our
sensitivity analysis assuming that the after-shock corporate debt at risk owed to banks were
to default with a probability of 15 percent
7
suggests that buffers comprising Tier 1 capital and
provisioning appear low in India, Russia, Hungary and Bulgaria, when benchmarked against
Basel III’s minimum capital requirement.
In some cases, bank buffers may be over-stated due to lax recognition of doubtful assets and
loan forbearance. In such instances, loan losses in a severe downturn and higher corporate
default could overwhelm what were thought to be adequate levels of equity capital.
Figure 4. Impact on the Banking Sector
Higher corporate default will erode banks’ asset quality…
... banks ability to withstand losses will depend on the extent of
available buffers
1. Banking Sector Gross NPL ratio
1
(percent)
1. Projected gross NPL ratios only consider shocks to the corporate loan
portfolio (default probability of 15 percent from Moody’s 1970-2012;
recovery rates based on average between on Basel II and World Bank’s
rates). Exposures to households are excluded.
2. Loss Absorbing Buffers
1
(in percent of Risk Weighted
Assets)
1. Consist of Tier 1 capital and excess of loan loss reserves against the
current stock of nonperforming loans, normalized by risk-weighted
assets
Sources: IMF, Haver, Orbis, IMF Staff Computations
7
Based on Moody’s default probability for corporate debts with interest coverage ratio of 1.5 for a three-year
horizon from 1970-2012.
0
5
10
15
20
25
China
Malaysia
Argentina
Indonesia
Chile
Philippines
Thailand
Brazil
Mexico
S.Africa
India
Poland
Russia
Hungary
Bulgaria
Current
With Corporate Stress
2
4
6
8
10
12
14
16
India
Russia
Hungary
Bulgaria
Chile
SAfrica
Thailand
Poland
China
Malaysia
Philippines
Argentina
Brazil
Mexico
Indonesia
Current Buffers
With Projected Corporate Weakness
Basel III min. Core Tier 1 capital (4.5 percent)
Basel III min. Core Tier 1 ratio with Capital Conservation (7 percent)
9
IV. POLICY IMPLICATIONS
Corporate leverage, particularly in foreign currency, has continued to increase in several
emerging market countries. While this may reflect the positive outcome of financial
deepening and integration into global capital markets, rapidly growing levels of debt and
leverage could increase firms’ susceptibility to shocks and affect financial stability.
Policymakers in a number of countries have initiated measures to address the rising
vulnerabilities in the corporate sector. To further mitigate these risks, the following measures
could be considered:
• Strengthen the monitoring of corporate liabilities structure. Authorities could mandate
better disclosure of firms’ liabilities, especially those in foreign currency, and
improve the collection and analysis of financial data. Timely and more granular data
are needed on off and on-balance sheet derivatives obligations and the extent of
foreign currency hedging.
• Tighten microprudential policies through regulation and supervision. Where feasible,
countries should consider imposing limits on firm’s foreign currency borrowing and
more stringent bank lending and underwriting standards. Countries whose banking
sector has low loss absorbing buffers should consider measures to bolster banks’
resilience through the buildup of more equity capital and provisioning. This includes
mandating banks to submit strict time-bound action plans to address the capital gaps.
In addition, authorities could also consider expanding the perimeter of prudential
supervision to include nonbank financial institutions to ensure that risks are
adequately captured, buffers are built and safety nets are in place.
• Improve macroprudential policy tools to address the rapid growth of corporate
leverage, particularly in foreign currency. Policymakers could identify
macroprudential tools to mitigate rollover risk, debt service burden and balance sheet
sensitivity to interest rate changes and exchange rate risk. In addition, tighter
macroprudential policies could be considered in countries where large capital inflows
have fuelled rapid credit growth and the buildup of overly leveraged positions.

10
APPENDIX 1. METHODOLOGY FOR CORPORATE SENSITIVITY ANALYSIS
A. Analytical Approach
A firm’s capacity to service debt hinges on its interest coverage ratio (ICR), computed as
EBIT/Interest Expense, where EBIT is earnings before interest and taxation
8
. The lower the ratio,
the more the company is burdened by debt expense relative to earnings. An ICR of less than 1
implies that the firm is not generating sufficient revenues to service its debt without making
adjustments, such as reducing operating costs, drawing down its cash reserves, or borrowing
more. This analysis uses an ICR threshold of 1.5 times to take into account of the potential
vulnerabilities to funding risks, in addition earnings risks, that could emanate in a scenario when
funding liquidity thins, particularly during times of heightened global risk aversion. This is also a
benchmark used widely by analysts as an early warning signal as firms with ICR below 1 may
have already been in distress.
B. Data
The analysis is based on annual firm-level balance sheet information from 15 emerging market
countries across Asia (China, India, Indonesia,
Philippines, Malaysia, Thailand), Latin America
(Argentina, Brazil, Chile, Mexico) and EMEA
(Poland, Hungary, Bulgaria, Russia, South Africa).
Data is sourced from Orbis, with close to 43,000
firms in the sample countries that include public
and private, large and small companies, though
they vary between countries. The coverage of
firms’ total assets is around half of the total GDP
of these sample countries (Table 1).
C. Estimating the Proportion of Debt at Risk
The sensitivity analysis shows how the
combination of exchange rate, earnings and
interest rate shocks affects debt at risk – defined as
those with ICR below 1.5. In this analysis, a
simultaneous shock of 30 percent increase in
8
EBIT (also known as operating profit/loss) is used as a measure of earnings instead of EBITDA (earnings
before interest, taxation, depreciation and amortization) to account for the need for investment and replacement
of assets.
Table 1. Coverage of Firms by Orbis
Source: Orbis
Number of
Firms
Total Assets (in
percent of GDP)
Total Debts (in
percent of GDP)
Asia
China
3,720
48
16
India
4,818
16 5
Indonesia 436
28
10
Malaysia 2,986
130
42
Thailand 4,920
91 36
Philippines 4,982 87
33
LATAM
Argentina 4,994 18
6
Chile
367
170
71
Brazil 573 52
24
Mexi co 123
52
28
EMEA
Russia 195
51
18
South africa 289
45 14
Poland 4,902 31
9
Hungary 4,587
185
45
Bulgaria
4,741 226
67

11
interest expense, 20 percent decline in EBIT and exchange rate depreciation (30 percent and 15
percent against the dollar and euro respectively) is applied across the sample firms
9
. Debt at risk
for each country is computed as:
< 1.5
D. Estimating the Share of Corporate External Debt
As the breakdown of firm-by-firm foreign currency borrowing is not available through Orbis and
other in-house databases, such debts are approximated, at the aggregate level, by external debt
statistics and other sources as follows:
Sources of Corporate Borrowing
Data
External Debt 1/
Quarterly External Debt Statistics (QEDS)
(http://web.worldbank.org/WBSITE/EXTERNAL/DATASTATISTICS/EXTDEC
QEDS/0,,contentMDK:20721958~menuPK:4704607~pagePK:64168445~piPK:64
168309~theSitePK:1805415,00.html)
NOTE: QEDS shows a breakdown of corporate external debt
according to debt from affiliates, direct investment and others
which include loans, money market instruments, trade credits,
bonds and notes.
Domestic Banks
Banking system data from “Financial Soundness Indicators”
Domestic Capital Markets
Bloomberg
1/ While external debt could be in foreign or local currency, most of foreign holdings of corporate debts are in hard
currencies given that (i) many emerging market local currency debt markets are illiquid; (ii) most foreign funds are less
willing to take exchange rate risk in addition of liquidity and corporate credit risks (carry trade-driven funds, on the other
hand, would prefer local currency government debts rather than corporate debts as the former are more liquid and easier to
unwind); and (iii) disclosures and covenants in some emerging market local currency bonds are weak and are not rated by
widely accepted international rating agencies.
The share of aggregate corporate external debt to total corporate debt is estimated as:
External Debt
External Debt + Loans from Domestic Banks + Borrowings from Domestic Capital Markets
E. Estimating Potential Exchange Rate Losses from Foreign Currency Debt
Potential exchange rate losses from foreign currency debt interest payment due in the current
year could be estimated
as:
9
These levels of shocks are consistent with observed median in sample countries following the Global Financial
Crisis. The differences in exchange rate depreciation against the dollar and euro account for the synchronicity of
monetary conditions between the U.S. and euro area.
12
Share of External Debt
.
+ ( . )
Assumptions underlying this estimation are:
• The share of FX debt is approximated by the share of external debts.
• The proportion of debts denominated in USD and EUR is approximated by the share of
USD and EUR bonds from Bloomberg.
F. Accounting for Natural Hedges
FX losses from interest expense and revaluation of foreign currency debt principal and are offset
by FX gains from overseas earnings, computed as:
Share of Foreign Sales
[
(
.
)
+
( . )
]
Assumptions
underlying this estimation are:
• Foreign sales are assumed to be in foreign currencies.
• The share of FX revenues is derived from the country trade weights.
• The multiplication by EBIT (operating profit) effectively takes into account of foreign
currency costs as it assumes that the share of these costs are in proportion to foreign
currency incomes.
It is worth noting that the effectiveness of natural hedges is an approximation as it may fall
short of expectations. Past episodes have demonstrated that overseas revenues declined in
tandem with the depreciating currencies during turbulent periods.
G. Accounting for Financial Hedges
Currency hedging of foreign currency debts could also mitigate potential FX losses. Offset
from financial hedging of foreign currency debt principal and interest is computed as:
Hedge Ratio x (FX losses from interest and principal revaluation)
As information on financial hedging is sparse, this analysis assumes that at least 50 percent
of foreign currency debts are hedged, on aggregate basis.
1
Global Liquidity and External Bond Issuance in Emerging Markets
and Developing Economies
Erik Feyen*
Swati Ghosh
Katie Kibuuka
Subika Farazi
World Bank
Washington, D.C.
Abstract
Using the universe of all externally issued bonds by corporates and sovereigns in emerging and
developing economies during 2000-14, this paper analyzes various issuance trends, including the
unprecedented post-crisis surge. The paper focuses on external issuance at the country-industry
and individual bond levels and finds that global factors matter greatly for emerging and
developing economies issuance. A decrease in U.S. expected equity market (or interest rate)
volatility, U.S. corporate credit spreads, and U.S. interbank funding costs and an increase in the
Federal Reserve’s balance sheet (i) raise the odds that the monthly issuance volume of a country-
industry is above its historical average; (ii) decrease individual bond yields and spreads; and (iii)
raise bond maturities, after controlling for country pull factors and bond characteristics (for
example, type of issuer, industry, and riskiness). Additionally, we document support that the
risk-taking channel of exchange rate appreciation also operates for external bond issuance.
Moreover, while the paper finds that country pull factors affect the impact of global factors, it
does not find consistent evidence for this across the board. This result suggests that, during loose
global funding conditions, flows are mostly driven by push factors and do not systematically
discriminate between emerging and developing economies. Taken together, the findings suggest
that although issuers might be able to benefit from benign international funding conditions, the
large issuance volumes, currency risks, and high exposure to global factors could pose external
and domestic challenges for policy makers, particularly when global cycles reverse.
Key words: Global Liquidity, Bonds, Primary Market, Capital Flows, International Finance.
JEL Classification: F21, F32, F36, G12, G15.
* Corresponding author: Erik Feyen is a Lead Financial Sector Economist in the Finance and
Markets Global Practice ([email protected]). Swati Ghosh is an Adviser in the Macro and
Fiscal Management Global Practice. Katie Kibuuka and Subika Farazi are both Financial Sector
Specialists in the Finance and Markets Global Practice. We thank Pierre-Laurent Chatain, Stijn
Claessens, Mario Guadamillas, Roberto Rocha, Hyun Shin, and participants of the Analytical
Group on Vulnerabilities of the Financial Stability Board for comments and Diego Sourrouille
for excellent research assistance.

2
I. Introduction
The global financial crisis has given new impetus to the debate on the global financial liquidity
cycle, which is primarily brought forth by monetary policy, risk appetite, and leverage in
“financial center countries” and transmitted through loose funding conditions to the rest of the
world (e.g. Rey (2013)). Emerging and developing economies (EMDEs) benefited from the pre-
crisis upturn in this global cycle mainly through internationally active banks (e.g. Bruno and
Shin (2015a, 2015b)). However, the process had also led to a build-up in global imbalances and
financial fragilities which came to the fore when global banks deleveraged to strengthen their
balance sheets and to comply with the new global regulatory architecture.
In the wake of the crisis, various developed economies embarked on unprecedented,
extraordinary monetary policies (EMPs) to rekindle domestic economic growth and battle
disinflationary pressures mainly via (promises of future) ultra-low policy rates and large-scale
asset purchasing programs (LSAP) that aimed to bring down long-term interest rates. Since
2009-10, EMPs in the United States in particular have produced a prolonged episode of ultra-low
global interest rates as well as extremely low volatility in financial markets. This in turn has
contributed to a revival of ample global funding conditions and widespread financial risk taking
as developed market investors searched for yield to meet targeted returns.
The spillover effects of these EMPs on EMDEs have been profound—EMDEs have experienced
an unparalleled surge in total gross capital inflows from an annual average of $0.5 trillion during
2000-2007 to $1.1 trillion during 2010-2013. As a result, portfolio investors in developed
markets currently allocate over $4 trillion or 13 percent of their investments to EMDEs.
Moreover, bonds funds allocations from developed markets to EMDEs have grown by 375% to
$385 billion since 2009 (Figure 1), equities funds allocations have expanded by 70% to $985
billion (Figure 2), and foreign participation in some local bond markets has increased up to 26
percent of volume outstanding (Figure 3).
These massive capital inflows can set a in motion a feedback loop in EMDEs that consists of: i)
ample domestic liquidity and loosening lending conditions, ii) increasing leverage, iii) rising
asset prices and stronger domestic balance sheets through local currency appreciation, and iv) an
improving growth and fiscal outlook. And as long as the cycle is virtuous, it attracts even more
inflows which reinforces the cycle. Yet, while producing short-term growth, boosting investor
optimism, and potentially extending debt maturities, these flows also provide challenges for
EMDE policy makers, as they can put pressure on currencies and foreign reserves management,
interfere with the local credit cycle and monetary policy, produce shadow banking risks, distort
asset prices, and reduce incentives for structural reform.
In this context, the inevitable exit from EMPs and the normalization of global interest rates could
prove disruptive for EMDEs (e.g. Rajan (2013), Turner (2014), IOSCO (2014)). The “Taper
Tantrum”
1
episode is instructive in this respect and shows that market expectations regarding
EMPs matter greatly (e.g. Eichengreen and Gupta (2014)). Now, more than 6.5 years later since
their launch, EMPs appear to have contributed to the nascent economic recovery in the United
States, and the Federal Reserve has finally discontinued its LSAP series of mortgage-backed
securities and Treasury bonds purchases and is preparing to raise the policy rate for the first time
1
In May 2013, the Federal Reserve hinted it might start scaling down its LSAP triggering virulent bouts of volatility
in EMDE currencies, equities, and capital inflows.

3
in a decade. In contrast, the European Central Bank has recently launched its own LSAP in
addition to other EMPs. These measures have helped drive down yield curves in Europe to
record lows, suggesting the impacts of EMPs on global financial markets and its contribution to
global liquidity will endure.
This paper focuses on the impact of global liquidity factors on a subset of capital inflows to
EMDEs which has grown dramatically: the external issuance of bonds by corporates and
sovereigns. Bond markets have become a major transmission channel of global liquidity (e.g.
Shin (2013), Avdjiev et al (2014)). During 2009-14, corporates and sovereigns in EMDEs
cumulatively issued $1.5 trillion in external bonds—overwhelmingly in foreign currencies—
representing almost a tripling from $520 billion in 2002-07. This surge is not driven by a single
region or country, but reflects a broad-based trend since the cumulative issuance to GDP ratio is
6.7% for the median EMDE, up from 4.3% in the pre-crisis period. For example, various
countries issued externally for the first time during the period, including Angola, Armenia,
Botswana, Ghana, Kenya, Laos, Namibia, and Mozambique.
Against this backdrop, this paper seeks to answer five main research questions:
• Question 1: What are the main trends in external issuance by EMDE entities during the
2000-14 period (e.g. volumes, stocks, currencies, maturities, yields)?
• Question 2: What is the impact of global factors—proxied by financial conditions in the
United States—on the propensity to issue external bonds by an EMDE country-industry
compared to its historical issuance average?
• Question 3: What is the impact of these global factors on two important bond
characteristics at the time of issuance: its yield (and spread) and maturity?
• Question 4: Do country characteristics interact and amplify or dampen the impact of
global factors?
• Question 5: Does the risk-taking channel through exchange rate appreciation as described
and tested in Bruno and Shin (2015a, 2015b) also operate in a similar fashion for external
bond issuance by increasing the propensity for country-industries to issue externally? In
our setting, this channel hypothesizes that local currency appreciation strengthens local
borrowers’ balance sheets and their external bond issuance capacity which triggers higher
cross-border flows by international investors who are willing to take on more risk.
Our paper makes four contributions. First, we compile external bond issuance data sets, which
cover the universe of external bond issuances by EMDEs during 2000-14. We use these data sets
to document recent trends in bond flows, stocks, pricing, and maturities across EMDEs. Second,
to our knowledge, this paper is the first to study the impact of global factors on primary activity
of EMDE entities in international bond markets since the start of new millennium. Third, we find
support for the risk-taking channel of exchange rate appreciation for external bond issuance.
Fourth, we undertake the analysis on the country-industry or bond tranche level which allows us
to account for industry-specific and deal-specific factors (e.g. currency, bond riskiness, bond
size). This ameliorates bias due to compositional and selection effects which are present in
aggregated capital flows data which are typically the focus of inquiry in the literature.
The remainder of this paper is structured as follows. Section II provides a brief overview of the
literature. Section III documents external issuance trends to answer Question 1. Section IV
4
discusses the data. Section V lays out the methodology to address the other research questions
and section VI discusses the empirical results. Section VII concludes.
II. Literature Overview
Global liquidity
The pronounced simultaneous resurgence in capital flows to EMDEs seen since 2009-10 is not a
new phenomenon. An extensive literature dating to the 1990s (e.g. Calvo et al (1993)) has
emphasized the importance of global push factors, notably real interest rates and growth in
advanced economies. Indeed, capital flows to EMDEs have long tended to exhibit strong co-
movements suggesting that common drivers in the global environment are at play—both across
types of flows (with the exception of FDI flows) and across geographical regions. This
observation is corroborated by Koepke (2015), who, while summarizing relevant empirical
literature, concludes that global push factors matter relatively more than country pull factors for
portfolio flows. He finds that country pull factors matter more for banking flows.
Bekaert, Hoerova and Lo Duca (2013) show that a lower Federal Funds rate triggers a
subsequent reduction in measures of uncertainty and risk aversion, proxied, for example, by the
VIX index, which measures the 30-day ahead expected volatility derived from S&P 500 index
options (Figure 16). And Forbes and Warnock (2012) show that a lower VIX is associated with a
surge in capital flows. Rey (2013) finds that capital inflows are negatively correlated with the
VIX even at a geographically disaggregated level, and that this pattern holds even when
conditioned by other global factors such as the real interest rate and world growth rate.
Bruno and Shin (2015a, 2015b) highlight banks as a channel of transmission. Bruno and Shin
(2015a) provide and empirically test a model of risk-taking through currency appreciation. They
show that the leverage cycle of international banks is associated with higher cross-border bank
flows. This triggers currency appreciation in the recipient countries which strengthens local
balance sheets allowing banks to lend more. In a VAR framework, Bruno and Shin (2015b) find
that a lower VIX entices globally active banks to take on additional leverage, arguably because
they target a certain value-at-risk (VaR) measure which mechanically allows for higher leverage
when uncertainty measures fall (e.g. Adrian and Shin (2010)). They also find that the U.S. Dollar
depreciates as VIX decreases, which results in a loosening of Dollar lending conditions in
international funding markets. Rey (2013) and Bruno and Shin (2015b) also provide evidence
that higher leverage leads to a subsequent fall in risk aversion measures, giving rise to a positive
feedback loop. The mechanism is as follows: when balance sheets expand in response to lower
uncertainty (VIX) through increased collateralized lending and borrowing by financial
intermediaries, the newly released funding resources chase available assets for purchase. If this
leads to a generalized increases in asset prices in the financial system, it then affects future risk
appetite (leads to a fall in risk aversion).
However, recently, bond markets have taken over as a transmission channel. For example, Shin
(2013) documents the impact of the VIX on portfolio bond flows. He argues that since 2010,
“reaching for yield” by investors in developed economies has contributed to the decline in risk
premiums for debt securities and a surge in issuance of international debt securities. In particular,
5
Shin (2013) discusses the increase in offshore issuance of international debt securities by non-
financial firms that operate across borders.
Co-movement of capital flows also translates to co-movement of asset prices. For example,
Miranda-Agrippino and Rey (2012) look at equity markets and show that about 25% of the
variance of a large cross section of prices of risky assets is explained by a single global factor
(the VIX). That is, they find that irrespective of the geographical location of the market in which
the assets are traded or the specific asset class they belong to, risky returns load to a large extent
on this global factor.
Of course, domestic factors still matter for capital inflows as well. For instance, Ghosh et al
(2010) look at aggregate capital inflows and find that, conditional on a surge of capital inflows
occurring (which is determined by global factors), whether or not a particular country receives
any flows depends on its domestic macroeconomic and institutional factors. Similarly, Fratzscher
(2011) documents that common shocks exert a large effect on portfolio flows, but also finds the
effects are highly heterogeneous across countries, with a large part of this heterogeneity
explained by differences in the quality of institutions, country risk and the strength of domestic
fundamentals. Cerutti et al. (2014) who analyze cross-border banking flows in particular, find
that, while U.S. financial conditions (VIX and term premia) are important, recipient country
characteristics affect both the level of country specific flows as well as the cyclical impact of
global liquidity on the domestic economies.
EMPs
EMPs mainly operate through various channels to affect investor portfolio decisions and
contribute to the global liquidity cycle, with the attendant domestic and international
consequences, including:
• The portfolio balance channel: To the extent that assets are not perfectly substitutable,
the central bank’s purchase of a security such as a U.S. Treasury, affects the available
supply of this asset to investors and reduces its yield, pushing investors into holding other
assets.
• The expectations channel: If the markets interpret the central bank’s announcements or
operations as signaling lower future policy rates than they had previously expected, bond
yields may decline via a lower risk neutral component of interest rates.
• The confidence channel: The central bank’s actions may also provide new information
about the current state of the economy –which in turn could affect the portfolio decisions
and asset prices by changing investors’ risk appetites.
• The liquidity channel: Assets purchased through LSAP operations boost the reserves of
commercial banks held at the central bank which can more easily be traded on secondary
markets than can long term securities. As a result, the liquidity premium declines, which
helps unclog funding markets, lower borrowing costs, and boost bank lending (Joyce et
al. 2012).
Recent research has also looked specifically into the effects of EMPs in the United States on both
capital flows and asset prices in EMDEs. Fratzscher, Lo Duca and Straub (2013) find that the
first LSAP or quantitative easing (QE1) in the United States (which focused on providing
liquidity to financial institutions to repair markets) triggered a reversal of flows back to the

6
United States as investor anxiety over U.S. conditions subsided. In contrast, subsequent LSAPs
(QE2 and QE3, which focused on asset purchases) had the opposite effect and induced a
portfolio rebalancing out of U.S. equities and bonds and partly into EMDEs. These effects
occurred both at the time of announcement of the program as well as during actual asset
purchases.
Burns et al (2014) find that 13% of the total variation in capital flows from developed economies
to EMDEs can be specifically attributed to a QE effect in the Unites States. Jointly, financial
conditions in the United States and domestic pull factors in EMDEs account for 60% and 40% of
the variation, respectively.
Expectations regarding EMPs in the Unites States particularly matter for flows to EMDEs.
Koepke (2014) finds that a one percentage point increase in market expectations for the Federal
Funds rate three years forward was associated with a short-term decrease of $6-7 billion on bond
flows to EMDEs and $1.2-6.5 billion on equity flows. The cumulative, long-term effect might be
twice as large. The effect also appears to be asymmetric as a shift towards expectations of
monetary tightening is much larger than a shift towards expectations of easing.
III. The Evolution of EMDE Activity in International Primary Bond Markets
This section addresses the first research question. Since 2000, external issuance of corporate and
sovereign entities in EMDEs has shown various trends. We discuss i) issuance volume, ii)
outstanding stocks, iii) currencies, iv) issuing industries and use of proceeds, v) maturities and
yields at issuance, vi) maturing profile, and vii) quality of issuance. Panel A in Appendix 2
provides summary statistics on bond issuance by year.
Issuance volume trends
1. External bond issuance increased steadily before the global financial crisis and
accelerated rapidly after the crisis reaching unprecedented levels (Figure 4). Total
annual issuance rose from around $64 billion in 2000 to $400 billion in 2014. For the pre-
crisis years (2000-07), annual average issuance was about $80 billion and grew at an
average annual rate of 6%. The global financial crisis negatively affected external
issuance across all the regions. Subsequently, total external issuance dropped to $48
billion in 2008 compared to $100 billion a year before. However, issuance resumed
quickly and during the post-crisis period (2009-14) average annual issuance was about
$250 billion and grew by an average 24% annually. South Asia (SAR), Africa (AFR) and
the Middle East (MNA) regions have been the smallest external issuers, and, although in
recent years absolute volumes have increased, they are still among the lowest. Of
particular interest is China’s issuance, which grew rapidly since 2009 in the wake of the
major credit stimulus driven by banks and real estate developers, and surpassed Latin
America (LAC) in 2014.
2. Pre-crisis external issuance was mostly driven by sovereigns whereas post-crisis
issuance was dominated by corporates (Figure 5). Issuance by sovereigns and
corporates has been increasing on average since 2000 at 5% and 23% annually,
respectively. However, the pace of issuance accelerated in the post crisis period,
especially for corporates which posted a total issuance of around $300 billion in 2014,
compared to $14 billion in 2000. EMDE sovereigns experienced a much more moderate

7
increase in their external issuance, issuing $99 billion in 2014 compared to $50 billion in
2000.
3. Cumulative post-crisis issuance is large relative to country GDP and grew much
faster for the poorest countries (Figure 20). For all EMDEs combined, the median
cumulative external issuance to GDP ratio was 6.7% in 2009-14, a significant increase
from 4.3% in 2002-07. Richer EMDEs are the main issuers, accounting for 85% of total
issuance during this period. Yet, the median ratio for the poorest country group (LMIC)
2
is 6.2% of GDP, up from 1.9% in 2002-07. This dramatic increase has important
implications for sovereign and corporate liability structures in these countries.
4. External issuance of oil exporting EMDEs has also increased and might pose
additional risks given recent oil price and U.S. Dollar developments (Figure 20).
Total volumes by this group has increased from $68 billion in 2002-07 to more than $100
billion by 2009-14. Cumulatively, external bond issuance in 2009-14 was 3.8% of GDP
for the median oil exporter, up from 1.2% in 2002-07. A strong Dollar, current oil price
trends, and tightening of international funding conditions all raise financial risks for this
group.
Outstanding stock trends
5. External debt stocks in absolute terms and relative to the size of the economy have
risen to unprecedented levels post-crisis. This is a widespread phenomenon and is
not driven by a single country or region (Figure 6). For March 2015, we estimate
poorer EMDEs (LMICs) have about $280 billion outstanding while the corresponding
figure for richer EMDEs (non-LMICs) is $1.4 trillion. We find that the median ratio of
outstanding external bonds issued since 2000 to GDP has risen across all regions. Most of
the increase across regions has taken place since 2009 and 2011 when LSAPs in the
United States were fully operational and the long-term refinancing operations (LTROs)
of the European Central Bank were launched, respectively. In February 2015, the median
ratio was largest in LAC with 12.6%, up from 7.5% in 2007. It is also high in Eastern
Europe (ECA) and East Asia (EAP, excluding China) standing at 9.2 and 7.8%,
respectively. The ratio almost quadrupled in ECA from a crisis nadir of 2.3% in 2008.
Similarly, the ratio tripled for MNA to over 6% currently.
Currency trends
6. External issuance is still mostly denominated in foreign currencies. As such, the
recent trend of a strong U.S. Dollar raises financial vulnerabilities. Local currency
issuance has increased, driven by Dim Sum bonds (Figure 7). External issuance has
mostly occurred in foreign currencies though the share of local currencies has been
increasing gradually. In 2000, around 1% ($327 million) of total issuance by EMDEs was
in local currencies and this has increased to 15% ($60 billion) in 2014. A key contributor
to the trend are Dim Sum bonds issued offshore by Chinese entities which are
denominated in renminbi.
Industry and use of proceeds trends
2
These are countries with a GNI per capita of $4,125 or lower, according to World Bank Income group definitions.

8
7. The largest issuing industries include the Finance and Utilities Sectors (Figure 8).
Finance captured the largest share among sectors by second half of 2014. This might be
driven by the fact that large internationally active banks started to deleverage in the face
of stricter regulatory requirements and market pressures. Utilities and Other sectors
(which includes agribusiness, forestry and paper, healthcare, chemicals, closed end funds,
defense, and government) are the other two sectors with relatively larger volumes of total
issuances.
8. Proceeds have mostly been used to finance general corporate activities and public
investment. In the wake of the “Taper Tantrum”, refinancing has become a key use
(Figure 9). General corporate activities include capital expenditures, R&D expenditures,
and other productive investments. Refinancing of debt surged around the “Taper
Tantrum” suggesting EMDE entities issued to make their debt profiles less risky while
funding conditions were still benign. Public sector uses which cut across industries are
also substantial and primarily used for financing community projects at the sovereign and
sub-sovereign levels.
Maturities and yields trends
9. Average yields of new external issuances have dropped precipitously since the crisis
(Figure 10). In 2007, right before the financial crisis, yields stood at 8.4% and have
fallen since to about 5% in 2015. As expected, yields of the poorest countries (LMICs)
have been consistently higher than for richer EMDEs (non-LMICs). However, the spread
between the two has declined steadily from a peak of 4.4% in 2009 to 1.8% in 2015.
Taken together, these findings are consistent with search-for-yield motives.
10. The average maturity of external issuances dropped sharply during the crisis. While
maturities have increased since, they remain well below pre-crisis levels (Figure 11).
Right before the crisis, volume-weighted average maturities were almost 9 years. The
crisis triggered a sharp drop to 7.3 years in 2009. While maturities recovered somewhat
since, around the time of the Taper Tantrum, they started falling again, reaching 6.7 years
by the end of 2013, when search for yield flows resumed. Currently, the average maturity
for new issuances is almost 8 years. Maturities in richer EMDEs (non-LMICs) were
particularly affected during the crisis, dropping from almost 9 years in 2007 to 7.3 years
in 2009. Since then they have been on an upward trend and currently stand at almost 8
years. Post-crisis volatility of maturities have been high for poorer EMDEs (LMICs),
reflecting lower deal volume compared to non-LMICs. With that caveat, since 2014,
LMIC maturities have been increasing sharply from 6.6 to 8.6 years.
Maturity profile of currently outstanding bonds
11. The majority of the $1.7 trillion currently outstanding external bonds of EMDEs
will mature before 2024 with a peak in 2019. Richer EMDEs will experience another
peak in 2017 (Figure 12). In March 2015, we estimate the outstanding stock of external
bonds for EMDEs to be $1.7 trillion, of which $1.5 trillion will mature by 2035. Of this
initial $1.7 trillion stock, the average still outstanding monthly amount of bonds maturing
within the next 12 months is highest during 2015-19 when it peaks at $207 billion.
During this period, the average monthly amount of maturing bonds is $164 billion ($28
billion and $136 billion for LMICs and non-LMICs, respectively). This monthly
maturing amount declines during 2020-24 in which the average drops to $109 billion.

9
Non-LMICs experience two peaks of roughly $150 billion in 2017 and 2019. LMICs will
experience a single peak in 2019 when the amount that matures within 12 months reaches
$40bn. According to current market expectations, these peaks will occur after the Federal
Reserve has raised interest rates.
12. By 2020, all regions will have experienced peaks in which more than 10% of their
currently outstanding stocks will mature within 12 months (Figures 13 and 14).
China’s peak should occur in 2017 in when almost 20% of its currently outstanding
bonds will mature ($333 billion). A significant portion of these bonds however are
denominated in renminbi which ameliorates currency risks. South Asia peaks in 2019
with 20% of its current stock ($81 billion). Eastern Europe peaks at almost 15% in 2018
(current stock: $239 billion). East Asia (ex-China) peaks at 12% in 2019 (current stock:
$174 billion). Africa, Middle East, and Latin America peak at 15%, 15% and 10% in
2020, respectively (current stocks; $64 billion, $42 billion, and $751 billion).
Credit quality
13. The credit quality of post-crisis external issuance has improved significantly (Figure
15). Before the crisis, only 30-40% of issuance was investment grade. Since 2010, this
fraction has steadily improved from around 50% to 70%. While this is a positive trend, it
is important to keep in mind that ratings can be pro-cyclical.
IV. Data
We now turn to the description of our two data sets that cover the universe of EMDE external
bond issuance in the period 2000-14. Table 1 describes the variable definitions. Our data sets
matches three types of data: i) highly granular bond data (i.e. industry or bond deal level), ii)
high frequency financial global push factors, and iii) country pull factors. Data on bonds are
derived from Dealogic which provides information on borrowers, bond yields and non-pricing
terms at origination on the individual deal level, which typically comprises several tranches.
Global push factors are from Bloomberg and country pull factors are sourced from the IMF’s
World Economic Outlook.
A. Bond Deals
Country-industry panel dataset
First, to analyze the impact of global factors on the propensity to issue external bonds by EMDE
entities, we compile a balanced panel data set of monthly total external bond issuance for each
industry in 71 emerging and developing countries between 2000 and 2014. There are 7 industrial
sectors, which translates to 497 individual country-industries for which we have monthly
observations. Note that some of these country-industries have not issued externally at all in our
sample. Hence the number of country-industry-month observations in the panel is about 84,000.
Our dependent variable is a dummy which denotes for a particular country-industry whether its
total volume issuance in a given month is above its historical average over the period 2000-07. In
doing so, we essentially control for general issuance patterns for each country-industry and
ameliorate bias due to absolute size effects.
Bond tranche deal dataset

10
Second, to study the impact of global factors on individual bond yield and maturities, we
construct a data set which captures the universe of 6,307 individual bond deals for 71 emerging
and developing economies in the 2000-14 period. These bonds are issued by 210 country-
industries. The other 289 country-industries never issued externally during the sample period.
Appendix 1 provides details of issuance activity on the country level. Bonds often consist of
multiple tranches with different characteristics. Therefore the number of observations in this
dataset is 6,925 bond tranches.
Our two bond variables of interest are yield to maturity (defined as the rate of return on a bond
assuming the bond is held until maturity at the time of issuance) and maturity (defined as the
number of years for which the bond remains outstanding at the time of issuance). We lose
tranche observations due to missing data. As a result, we have yield data for 5,962 bond tranches
and maturity data for 6,804 (non-perpetual) bond tranches, respectively.
This bond tranche level data set allows us to control for bond-specific characteristics that could
influence the two variables of interest. We can therefore account for changes in issuance
composition over time. These bond tranche level variables include:
• Size of bond tranche issued refers to the total U.S. Dollar volume of the individual
tranche of the deal;
• Currency is an indicator variable that captures the currency in which the tranche is
issued;
• Investment grade type is a set of indicator variables that indicates whether the bond
tranches are investment grade or not – i.e. a credit rating of BBB- or higher according to
S&P or Baa3 or higher according to Moody's. This variable allows us to control for
adverse selection issues;
• Borrower industry is a set of indicator variables that captures the industrial sector of the
issuing entity (Consumer, Finance, Metals, Professional Services, Transportation,
Utilities, and Other);
• Borrower type distinguishes between three different types of borrowing entities, public-
local (local and state/provincial authorities), public-other (central government) and non-
public; and
• Deal type is a set of indicator variables which reflects the type of bond tranche such as
Asset Backed Securities, Corporate Bond-High Yield, or Sovereign (see Table 2 for more
details). The grouping is defined by Dealogic.
B. Global Push Factors
We study the impact on external bond issuance of four global push factors that proxy for global
financial conditions:
1. The VIX index (VIX) (Figure 16) captures the options-implied 30-day ahead volatility of
the S&P 500 equity index and is the most frequently used indicator as a proxy for global
risk appetite, risk, and uncertainty. Higher values of VIX are associated with higher bond

11
yields and lower maturities. Research suggests EMPs have contributed to extremely low
volatility.
2. The Libor-OIS spread (LIBOR) (Figure 17) is used as a control for risk perception in
credit markets. This spread is a measure of inter-bank risk and liquidity in the money
market and captures fear of bank insolvency. Higher spreads indicate low liquidity and an
unwillingness of banks to lend to each other, and are typically associated with higher
bond yields and a decrease in maturities.
3. The corporate credit spread (RISK) (Figure 18) tracks the performance of U.S. Dollar
denominated investment grade rated corporate debt that is publically issued in the U.S.
domestic market. This options-adjusted spread is the difference between U.S. treasury
bonds and corporate bonds with a BBB rating or higher. RISK is an indicator of corporate
sector health, where wider spreads are associated with deteriorating investor confidence
and are expected to increase bond premiums and shorten the duration at which EMs can
issue debt. Search-for-yield will exert a downward pressure on this spread. In unreported
robustness regressions we use the high-yield corporate debt spread instead with
qualitatively similar results.
4. The size of the Federal Reserve Balance Sheet (FED) (Figure 19), calculated as the sum
of mortgage- backed securities and U.S. treasuries, is used to gauge spillover effects from
U.S. LSAPs.
Panel B in Appendix 2 provides average values of these global push factors around time of each
individual bond issue by year.
In all our regressions, we also control for the United States 10-year Treasury yield (UST10Y),
which is generally considered a pricing benchmark and a proxy for global liquidity conditions as
well. Falling U.S. long-term treasury yields are associated with an abundance of capital in the
international market and an increased willingness to hold relatively riskier assets, such as
emerging and developing market debt. Indeed, the empirical literature has found this global
factor to be a key determinant of emerging market bond prices. Notably, an increase in U.S.
treasury yields tends to increase emerging market bond yields and spreads while decreasing the
probability of bond issuance (e.g. Eichengreen and Mody (1998a) and Eichengreen and Mody
(1998b)).
Global push factors are all based on daily time series. To best estimate the global financial
conditions that impacted bond issuance as well as investor confidence, we incorporate these
global factors into our two data sets as follows (See Table 2 for more details on global push
factors). For the industry-level dataset, we calculate for each month the average value of each
factor for the 6 preceding months. For the bond-level data set, for each individual bond we
compute the average value for each factor the 6 months prior to the issuance date.
C. Domestic Pull Factors
As regards country-specific factors, the analysis controls for five macro-financial variables used
to evaluate a country’s development, creditworthiness, and vulnerability. These variables are
available on an annual basis and we match the macro variables with the corresponding year for

12
each month in the industry-level panel dataset and the year of the bond issue date in the bond-
level dataset:
• Real GDP per capita in U.S. Dollars (GDPPC) is used to control for the level of
development of a country given its positive correlation with international bond issuance.
• Real GDP growth rate (GROWTH) is used to proxy for investment opportunities as
higher economic growth can potentially drive down bond yields and increase their
maturities.
• The current account balance expressed as a percent of GDP (CA) is used as larger current
accounts can make countries more vulnerable to a slowdown in capital inflows or sudden
stops and hence can result in higher yields and shorter maturities on debt issued.
• Total external debt as a percentage of GDP (EXT) is used as lower levels of external debt
are expected to reduce default risk and boost investor confidence in the economy which
can positively impact bond issue prices and maturities.
• Total bank credit to the private sector as a percentage of GDP (PCRED) is often used as a
proxy of financial depth and development which can enhance resilience to economic and
financial shocks, and, in turn, positively impacts bond prices and maturities. While
private sector credit is considered a financial variable, it is also an indicator of economic
activity – improved economic activity is usually reflected in greater credit growth and
potentially in reduced prices and maturities for bonds.
D. Descriptive Statistics and Correlations
Table 2 provides descriptive statistics. Panel A shows the average yield and maturity at issuance
in our universe of bonds during the 2000-14 period was 5.1% and 6 years, respectively. The
average bond size was about $123 million. The average propensity for a country-industry to
issue above its 2000-07 historical average in any month was 3% (Panel B). All global push
factors exhibit very high variation as a result of the pre-crisis boom, the global financial crisis,
and the effect of subsequent policy measures, including EMPs, which drove down interest rates,
volatility, and risk spreads.
Table 3 reports correlations. We document a particularly strong negative unconditional
association between individual bond yields in EMDEs and the size of the Fed’s balance sheet
around the time of issuance (ρ=-0.58), suggesting that EMPs have contributed to search-for-yield
climate to EMDEs. The correlations between bond features and various country characteristics
(e.g. PCRED) are also quite high, suggesting pull factors are important as well. Correlations
between the global push factors are relatively strong, with the exception of the Fed’s balance
sheet.
Appendix 2 Panels A, B and C display annual bond issuance characteristics (excluding issuance
by Chinese entities) and annual averages of push and pull factors around the time of issuance.
Panel D shows the fraction of all country-industries with monthly issuance volume above their
historical average by year.

13
A few points are worth highlighting. Panel C shows that the country profile of issuers has
changed significantly, with both positive and negative features. Post-crisis, issuing countries are
significantly richer than before the crisis as measured by GDP per capita (2010-14: $7,800 vs.
2000-07: $4,300). They also have deeper financial systems as proxied by private credit to GDP
(2010-14: 51% vs. 2000-07: 36%). Moreover, they have lower levels of external debt to GDP
(2010-14: 39% vs. 2000-07: 48%). However, at the same time the current account and economic
growth of issuing countries has deteriorated significantly, particularly during 2011-14 (3.8% and
-3% of GDP, respectively).
Panel D clearly shows the presence of synchronized external issuance waves on the country-
industry level, even after correcting for historical average issuance patterns of individual
country-industries. In the run up to the crisis, the average monthly fraction of country-industries
with higher issuance than their own average during 2000-07 climbed from 1.59% in 2002 to
3.35% in 2006. This fraction fell to 1.14% during the height of the crisis in 2008. However, the
fraction has increased again since 2010 to record levels from 3.67% in 2010 to 5.30% in 2013.
V. Methodology
This section describes our econometric approach to analyze research questions 2, 3, and 4 of this
paper.
A. Modeling the Propensity to Issue Externally on the Country-Industry Level
To address the first research question, we fit logistic regressions on our industry-level panel data
set to test the impact of our global factors on the tendency of country-industries in EMDEs to
issue external bonds above their own historical average. By comparing monthly issuance of a
country-industry to its own historical average issuance volume, we effectively control for
country-industry level issuance trends. In all regressions, we cluster standard errors on the
country-industry level to allow for within industry correlation. We estimate the issuance
propensity for a particular country-industry as:
(__
= 1) =
F(
0
+
+
+
+
+
)
(1)
where __
is an indicator variable which assumes a value of 1 if total
issuance volume in industry s in country i during month t is above the pre-crisis historical
monthly average of industry s during 2000-07 and 0 otherwise. F(∙) denotes the cumulative
logistic distribution.
denote vectors of time-varying explanatory variables that contain global
push factors (INT) and domestic pull factors (DOM). The vector of global factors consists of
=
(
,
)
where
∈ (
,
,
,
). In other words, we always
control for the United States 10 year Treasury rate. The vector of domestic factors is defined as:
=
(
,
,
,
,
)
.

14
Importantly, we include a battery of fixed effects. We account for time-invariant country factors
such as the overall institutional environment, the macro-financial framework, and the level of
development of the country which influences investment opportunities and investor appetite. We
include year factors to capture the overall impact of global conditions such as trade and crisis
effects. As such, we exploit within-year variation and avoid drawing false inference due to
general cyclical or time trends. Finally, we include industry factors to capture intrinsic
differences between industries in terms of their need for and use of external bond finance.
B. Modeling Yields and Maturities on the Bond Tranche Level
We estimate pooled OLS regressions on the bond tranche-level dataset to evaluate the impact of
global factors on the pricing and maturity of bonds. Again, in all regressions, we cluster standard
errors on the country-industry level to allow for within industry correlation. The model can be
written as:
=
0
+
+
+
+
+
+
(2)
where
denotes the yield to maturity
3
or the maturity of bond tranche b. The first two
vectors capture global push factors (INT) and domestic pull factors (DOM) around the time bond
b was issued, as described above.
is a vector of bond-specific characteristics: Size of bond
issued, Currency, Investment grade, Borrower industry, and Deal type. For yield to maturity
regressions, we also include Maturity in
. Importantly,
allows us to isolate the
impact of issuance composition and bias effects (e.g. differences in bond risk, bond size or
industry) so we can make much stronger inference than is possible at higher levels of
aggregation where such information is lost. We also incorporate two sets of indicator variables
that capture general global conditions such as global trade and general crisis effects in the year
which bond b was issued (
) as well as time-invariant factors associated with
the country in which bond b was issued (
).
Missing data in
limits the sample size. Therefore, in robustness regressions we substitute
and the country fixed effects for country-period fixed effects. Our model becomes:
=
0
+
+
+
+
−
+
(3)
VI. Empirical results
This section addresses research questions two through five. It summarizes and discusses the main
empirical results for the impact of global push factors on external bond issuance in EMDEs.
Given that the global factors are relatively highly correlated, we estimate their effects in separate
regressions.
3
Note that because the regression controls for the 10-yr U.S. government yield, the results can also be interpreted as
if the dependent variable were a “spread”.

15
A. Impact of Global Factors on the Propensity to Issue Externally on the
Country-Industry Level
Table 4 shows the results of the logistic regressions that estimate Equation (1) on the country-
industry-month level in EMDEs during the 2000-14 period. All four global push factors (VIX,
RISK, FED, and LIBOR) are highly statistically significant on the 1-percent level with the
expected sign. This finding supports the notion that external issuance across EMDEs is highly
synchronized with the global financial cycle which triggers capital flows out of developed
markets in search for yield in EMDEs.
Model 1 shows that industries are less likely to issue above their historical 2000-07 average if
VIX increases even after controlling for the UST10Y, and time-varying and time-invariant (e.g.
country fixed effects) country pull factors. The result is also economically significant. A 10%
increase in the VIX leads to a decline in the odds an industry will issue above its average by
almost 6% (1.1^(-0.63)-1).
Model 2 shows that a decrease in the BBB U.S. corporate credit spread (RISK) lowers the odds
of above-average issuance even more than for the VIX. These odds drop by 10% for a 10%
increase in RISK. Model 3 indicates that an increase in the size of the Fed’s balance sheet (FED)
boosts the odds of above-average issuance. The coefficient suggests that a 10% increase in the
Fed balance sheet increases the odds by 8%. Finally, Model 4 shows that lower interbank risk
increases the above-average issuance odds. A 10% decline in LIBOR increases the odds by
5.5%.
Table 4 also consistently shows that GDP per capita (GDPPC), GDP growth (GROWTH), and
the current account (CA) are the most important country pull factors. Industries in countries with
higher GDPPC and GROWTH are more likely to issue above their historical 2000-07 average
volume in a given month. This could reflect both demand and supply factors: industries in more
developed or faster growing countries could have a higher need for external finance while
investors have more appetite to supply it given lower risks. Similarly, industries in countries with
current account surpluses are less likely to issue above average, perhaps since countries with
surpluses are net exporters of capital. We don’t find evidence that other macro pull factors such
as external debt (EXT) or financial development (PCRED) of the country contain additional
information.
In unreported robustness regressions we use the MOVE index and obtain qualitatively similar
results as for the VIX in Model 1. The MOVE Index captures expected U.S. Treasury volatility
and acts as a proxy for interest rate uncertainty. Higher values indicate greater uncertainty. More
specifically, the Merrill Lynch Option Volatility Estimate Index is a yield curve weighted index
of the normalized implied volatility on 1-month Treasury options which are based on the 2, 5,
10, and 30 year contracts. Intuitively, MOVE is similar to VIX for the government bond market.
In another set of unreported robustness regressions, we assess the impact of the U.S. Economic
Policy Uncertainty (EPU) Index as developed in Baker et al (2015), but do not find any
statistically significant results. The EPU Index is based on three types of underlying

16
components:
4
“One component quantifies newspaper coverage of policy-related economic
uncertainty. A second component reflects the number of federal tax code provisions set to expire
in future years. The third component uses disagreement among economic forecasters as a proxy
for uncertainty.”
B. Impact of Global Factors on Yields of External Bonds at Time of Issuance
Table 5 presents bond tranche-level OLS regressions which document the impact of the global
factors on individual bond yields in EMDEs during the 2000-14 period. For each global push
factor we present two models to estimate Equations (2) and (3), respectively. We exclude
Chinese issuance in the second model to avoid a possible China bias since 2,945 bonds in the
sample (consisting of 3,143 tranches) are issued by Chinese entities.
A consistent picture emerges in which favorable global conditions bring down bond yields across
EMDEs in a synchronized manner. Since the regressions control for the 10-year U.S. treasury
yield (UST10Y), the results also imply that the “spread” (see footnote 3) relative to U.S.
treasuries falls when global factors are benign. Except for one model, all results are significant at
the 5 percent level at least.
Models 1 and 2 demonstrate that a decrease in the VIX is associated with lower bond “spreads”
across EMDEs. A 10% decrease in the VIX decreases the EMDE bond “spread” by 6 to 12 basis
points. Model 2 excludes Chinese issuance and adds data for 11 countries by dropping time-
varying country factors and produces a result that is significant on the 1 percent level and
doubles in magnitude. Models 3 and 4 show that the impact of RISK is strong and highly
significant as well. A 10% decrease in RISK decreases EMDE bond “spreads” by 12-13 basis
points. Models 5 and 6 are also highly significant and indicate that a 10% increase in the Fed’s
balance sheet size brings down EMDE bond “spreads” by 8-9 basis points. Finally, a 10% fall in
the LIBOR-OIS spread is significantly associated with a reduction in EMDE bond spreads by 3-6
basis points.
As expected, we find that the UST10Y and bond maturity have a consistent positive impact on
the yield. The size of the bond does not contain additional explanatory power. Unreported
regressions show the level of economic development (GDPPC) as well as economic growth
(GROWTH) are significantly negatively associated with spreads, as expected. However, after
inclusion of year fixed effects the GDPPC coefficient switches sign and GROWTH is no longer
significant. This suggests global factors play a more significant role.
Again, in unreported robustness regressions we use the MOVE index and obtain qualitatively
similar results as for the VIX in Models 1 and 2. In another set of unreported robustness
regressions assessing the impact of the U.S. Economic Policy Uncertainty (EPU) Index, we again
do not find any statistically significant results.
4
For details, see http://www.policyuncertainty.com/.

17
C. Impact of Global Factors on Maturities of External Bonds at Time of
Issuance
Table 6 documents bond tranche-level OLS regression results which show the impact of global
factors on maturities of non-perpetual external bonds issued during 2000-14. The standard errors
are clustered on the country-industry level. As in Table 5, for each global push factor we present
two models to estimate Equations (2) and (3), respectively. Overall, we find that favorable global
factors are associated with a maturity extension across EMDEs. This result is consistent with a
willingness of investors to extend maturities when global liquidity is ample and search for yield
effects are strong. However, the results are somewhat weaker in terms of statistical significance,
compared to the impact on yields.
Models 1 and 2 suggest that a 10% fall in VIX extends bond maturities by 16-17 weeks, although
Model 2 is only significant at the 10-percent level. The results in Models 3 and 4 are statistically
strongest, both at the 1 percent level, and suggest that a 10% fall in RISK boosts maturities by
17-24 weeks. Only Model 5 is statistically significant and suggests a 10% increase in the Fed’s
balance sheet increases maturities by 14 weeks. We do not find strong evidence of a significant
impact of a lower LIBOR-OIS spread although the coefficient has the expected sign, suggesting
that a lower spread has a positive impact on maturities.
Across regressions we also find evidence that larger bonds typically carry longer maturities. This
is in line with expectations since larger issuers are typically able to issue at longer maturities. As
regards country characteristics, in unreported regressions we find that economic growth
(GROWTH) has a strong significant positive impact on maturities, consistent with expectations
as well. However, after inclusion of year fixed effects, GROWTH is no longer significant.
In unreported robustness regressions we use the MOVE index and obtain similar results as for
the VIX in Model 1 and 2. The impact of the U.S. Economic Policy Uncertainty (EPU) Index is
again statistically insignificant.
D. Interaction of Country Characteristics with Global Factors
Appendix 3 contains 60 additional regressions in which we investigate whether country
characteristics amplify or dampen the impact of our four global factors
∈ (
,
,
,
). In doing so, we modify Equations (1) and (2) by
sequentially adding an interaction between a global factor and a country variable from
=
(
,
,
,
,
)
. This strategy produces 4*5=20 additional
regressions for each independent variable. For all 40 bond tranche level regressions (i.e.
Equation (2)), we omit Chinese bonds to avoid a China bias.
While some of these interactions are statistically significant, we do not find consistent evidence
across the board that country variables amplify the effect of global factors. This suggests search-
for-yield flows during loose global funding conditions do not strongly discriminate between
EMDEs but are primarily driven by global factors.

18
In that context, in our 20 additional augmented Equation (1) regressions we highlight that the
interaction with PCRED is significant for VIX and FED at the 1-percent level and RISK at the
10-percent level. This suggests higher financial development could amplify benign global factors
and raise the odds that a country-industry will issue above its historical average.
In addition, for our 20 additional Equation (2) regressions to explain individual bond yields (and
“spreads”), we document that the interaction with GROWTH is significant for VIX and RISK at
the 5-percent level and LIBOR at the 1-percent level. We also find significant interactions for
EXT with RISK and LIBOR at the 5-percent level. These findings provide some support for the
notion that country growth and external debt can amplify the impact of these global factors on
individual bond yields and spreads.
We do not find any strong results in our 20 additional Equation (2) regressions to explain
individual bond maturities, indicating that maturities are not significantly differently affected by
global factors across EMDEs with different domestic characteristics.
E. The Risk-Taking Channel of Exchange Rate Appreciation
Following Borio and Zhu (2012) and Bruno and Shin (2015a, 2015b), in this section, we briefly
explore the risk-taking channel of financial conditions and monetary policy in developed
countries via exchange rate appreciation. As described earlier, Bruno and Shin (2015b) argue
that looser financial conditions are associated with an increase in cross-border capital flows
intermediated through higher leverage in the international banking system. The mechanism
operates via stronger local borrower balance sheets as a result of local currency appreciation,
allowing banks to lend them more and take on more risk.
We test whether this risk-taking channel is active for international investors and external bond
issuance as well. Under that hypothesis we would expect U.S. Dollar depreciation/local currency
appreciation to be associated with a higher propensity for country-industries to be able to issue
higher external bond volumes, all else equal.
We use two exchange rate variables as global push factors, following Bruno and Shin (2015a,
2015b):
• The 6-month log difference of the U.S. real effective exchange rate (USREER), along the
lines of the VAR framework in Bruno and Shin (2015b). USREER is a trade-weighted
Dollar index. Higher values imply a real depreciation of trade partner currencies
(appreciation of the U.S. Dollar).
• The 6-month log difference of the real U.S. Dollar – Local currency exchange rate
(XRATE), which is similar to the panel regression setting in Bruno and Shin (2015a).
XRATE reflects the real bilateral exchange rate where higher values indicate a real
depreciation of the local currency (appreciation of the U.S. Dollar). We use the 6-month
log difference of the real exchange rate which is calculated as the log of the nominal
exchange rate multiplied by the U.S. CPI and divided by the local CPI.

19
Table 7 presents the results. Analogous to Table 4, Models 1 and 2 estimate Equation (1) and
provide strong support for the risk-taking channel of exchange rate appreciation hypothesis: the
coefficients on USREER and XRATE are negative and highly statistically significant
5
. This
indicates that the propensity to issue bonds externally above historical average volumes for a
particular country-industry is significantly higher when the U.S. Dollar depreciates in real terms
in the 6 months prior. In other words, when the local currency appreciates, local borrowers’
balance sheets strengthen. This in turn increases their external borrowing capacity which triggers
higher cross-border flows by international investors who are willing to take on more risk.
These results are closely tied to our findings in Table 4 of the impact of the VIX on external
bond issuance volume discussed in Section A. Particularly, the results point to a channel through
which the VIX operates since Bruno and Shin (2015b) document a link between the VIX and
USREER.
VII. Conclusion and Policy Implications
Using the universe of all externally issued bonds during the 2000-14 period, this paper shows the
post-crisis period has seen an unprecedented surge in external bond issuance and stocks across
emerging and developing economies (EMDEs). Bond yields (and spreads) at the time of issuance
have fallen to record lows, in part as a result of loose global funding conditions produced by
extraordinary monetary policies (EMPs) in developed economies.
In particular, the volume of bonds issued in the six post-crisis years tripled to $1.5 trillion
compared to the six years before the crisis, overwhelmingly denominated in foreign currencies
and driven by corporate issuance. This surge is not driven by a single region or country, but
reflects a broad-based trend, since the 2009-14 cumulative external issuance to GDP ratio is
6.7% for the median EMDE, up from 4.3% in the pre-crisis period. The trend is also present at
the country-industry level across EMDEs even after we correct for their own historical issuance
average. Under such benign conditions, many EMDEs issued externally for the first time,
including Armenia, Angola, Ghana, Laos, and Tanzania.
Contrasting the pre- and post-crisis periods, we find that countries of external issuers currently
are on average richer, have deeper financial systems, and lower external debt. The fraction of
issuance that is rated investment grade has also improved. However, these countries currently
also have much slower GDP growth and larger current account deficits which can weaken debt
servicing capacity and raise external vulnerabilities.
This paper also finds that global factors have a powerful impact on primary activity in
international bond market by corporates and sovereigns EMDEs. Controlling for United States
interest rates, a battery of country pull factors, and year fixed effects to account for the overall
impacts of major global conditions and time trends, we find that a decrease in i) expected U.S.
equity market (or interest rate) volatility, ii) U.S. corporate credit spreads, iii) U.S. interbank
funding costs and iv) an increase in the Federal Reserve’s balance sheet:
5
We are aware that there may be potential endogeneity issues in that the local currency appreciation could also be
the result of capital inflows. While the use of the 6-month prior exchange rate difference should help to address this
issue, we leave it to future work to examine it further.
20
1. Raise the odds that a country-industry’s monthly external issuance volume is above its
own historical average. For example, a doubling (halving) of the Fed’s balance sheet
increases these odds by about 75% (-43%);
2. Lower the yield-to-maturity spread of external bonds at the time of issuance, even after
accounting for individual bond characteristics (e.g. volume, currency, riskiness, industry,
type of issuer). For example, a doubling (halving) of the Fed’s balance sheet lowers
(increases) a bond’s spread by 63 basis points; and
3. Increase the maturity of non-perpetual external EMDE bonds at the time of issuance,
again after accounting for individual bond characteristics. For example, a doubling
(halving) of the Fed’s balance sheet is associated with a maturity lengthening
(shortening) of 48 weeks.
We also find empirical support that the risk-taking channel of exchange rate appreciation (e.g.
Bruno and Shin (2015b)) also operates for external bond issuance: real depreciation of the U.S.
Dollar is associated with a higher propensity for country-industries to issue externally above
their historical average volume. More specifically, when the local currency appreciates, local
borrowers’ balance sheets strengthen. This in turn increases their external borrowing capacity
which triggers higher cross-border flows by international investors who are willing to take on
more risk. This process can be self-sustaining, at least for a while.
In addition, in line with the literature, we find evidence that some country characteristics such as
the level of financial development can affect the impact of global factors. However, the results
are not consistently statistically significant implying that the global cycle is mostly driven by
push factors and does not structurally discriminate between EMDEs.
Taken together, our findings provide strong support for synchronized primary issuance flows
across EMDEs driven mostly by global factors. As a result, both sovereigns and corporates in
EMDEs have collectively been able to take advantage of ample international liquidity by
lowering their borrowing costs and extending maturities which can improve risk profiles,
although in the wake of the crisis, maturities in EMDEs remain below pre-crisis levels.
The massive and widespread external issuance in EMDEs raises important questions regarding
the impact of procyclical investor behavior once the global cycle winds down, or if global shocks
materialize, with potential systemic implications for EMDEs. Moreover, while issuance at lower
cost and maturity extension can help lower individual borrower risk profiles, large foreign
currency exposures raise risks, particularly for unhedged issuers. The recent trend of a rapidly
strengthening U.S. Dollar against most EMDE currencies further heightens currency risks.
In this context, the inevitable exit from EMPs will tighten international funding conditions,
which could prove disruptive for currencies, balance sheets, and funding capacity in EMDEs.
Additionally, fragility in EMDEs can be further compounded by their shallow local financial
markets and a lack of strong institutions, supervisory and surveillance capacity, and technical
experience. As such, in terms of financial sector policies, there is a continued need for, inter alia:
i) creating vibrant local currency (corporate) bond markets and an active, diverse domestic
investor base; ii) building macroprudential tools and monitoring capacity to deal with
synchronized foreign investor activity to prevent or manage a situation where certain flows
create a variety of risks which jeopardize undoing financial and (socio-)economic progress made;
iii) strengthening data collection efforts, particularly regarding sufficiently granular and timely
21
foreign currency exposures and natural and financial hedges; and iv) strengthen the banking
sector to safeguard against potential spillovers.
References
Adrian, T., and H. S. Shin (2010). “Liquidity and Leverage,” Journal of Financial
Intermediation, 19(3), pp. 418-437.
Avdjiev, S., M. Chui, and H.S. Shin (2014). “Non-Financial Corporations from Emerging
Market Economies and Capital Flows”, BIS Quarterly Review, December 2014.
Baker, S., N. Bloom, and S. Davis (2015). “Measuring Economic Policy Uncertainty”, Stanford
University Working Paper.
Bekaert, G., M. Hoerova, and M. Lo Duca (2013). “Risk, Uncertainty and Monetary Policy”
Journal of Monetary Economics 60, pp. 771-788.
Borio, C. and H. Zhu (2012). “Capital regulation, risk-taking and monetary policy: a missing link
in the transmission mechanism?” Journal of Financial Stability, 8(4), pp. 236-251.
Bruno, V. and H.S. Shin (2015a). “Cross-Border Banking and Global Liquidity”. Review of
Economic Studies 82, pp. 535-564.
Bruno, V and H.S. Shin (2015b). “Capital Flows and the Risk Taking Channel of Monetary
Policy”. Journal of Monetary Economics 71, pp. 119-132.
Burns, A., M. Kida, J. Lim, S. Mohapatra, M. Stocker (2014). Unconventional Monetary Policy
Normalization in High-Income Countries Implications for Emerging Market Capital Flows and
Crisis Risks. World Bank Policy Research Working Paper 6830.
Calvo, G., L. Leiderman, L. and Reinhart, C. (1993). “Capital Inflows and Real Exchange Rate
Appreciation in Latin America: the Role of External Factors.” IMF Staff Papers: 108-151.
Cerruti, E., Claessens, S. and Ratnovski (2014). “Global Liquidity and Drivers of Cross Border
Bank Flows” IMF Working Paper 14/69.
Fratzscher, M., M. Lo Duca, and R. Straub (2014). “On the International Spillovers of U.S.
Quantitative Easing”, European Central Bank Working Paper 1557.
Eichengreen, B. and P. Gupta (2013). “Tapering Talk: The Impact of Expectations of Reduced
Federal Reserve Purchases on Emerging Markets”. World Bank Policy Research Working Paper
6754.
Eichengreen, B., and A. Mody (1998a). "Interest Rates in the North and Capital Flows to the
South: Is There a Missing Link?", International Finance, Vol. 1, No. 1, pp. 35-57.
Eichengreen, B., and A. Mody (1998b). "What Explains Changing Spreads on Emerging-Market
Debt: Fundamentals or Market Sentiment?," NBER Working Paper 6408.
Fratzscher M. (2011). “Capital Flows Push Versus Pull Factors and the Global Financial Crisis”.
ECB Working Paper No. 1364.
22
Fratzscher, M., M. Lo Duca, and R. Straub (2013). “On the International Spillovers of U.S.
Quantitative Easing”, European Central Bank Working Paper 1557.
Ghosh A. Kim, J. Qureshi, M. and J. Zalduendo (2012). “Surges”. IMF Working Paper
WP/12/22.
International Organization of Securities Commissions (IOSCO) (2014). “Securities Markets Risk
Outlook 2014-2015”, October 2014.
Koepke, R. (2014). “Fed Policy Expectations and Portfolio Flows to Emerging Markets”,
Institute of International Finance Working Paper.
Koepke, R. (2015). “What Drives Capital Flows to Emerging Markets? A Survey of the
Empirical Literature” Institute of International Finance Working Paper.
Miranda-Agrippino S. and H. Rey (2012). “World asset Markets and Global Liquidity” presented
at the Frankfurt ECB BIS Conference, London Business School, mimeo, February.
Rajan, R. (2013).”A Step in the Dark: Unconventional Monetary Policy after the Crisis”. Bank
for International Settlements, Andre Crockett Memorial Lecture, June 2014.
Rey, H. (2013). “Dilemma not Trilemma: The Global Financial Cycle and Monetary
Independence”. Federal Reserve Jackson Hole Symposium.
Shin, H. S. (2013). “The Second Phase of Global Liquidity and Its Impact on Emerging
Economies”, mimeo Princeton University.
Turner, P. (2014) “The Global Long-Term Interest Rate, Financial Risks and Policy Choices in
EMEs”. BIS Working Paper 441.

23
Figure 1: Bonds Funds Allocations ($ billions)
Source: EPFR; Author’s calculations
Figure 2: Equities Funds Allocations ($ billions)
Source: EPFR; Author’s calculations
Figure 3: Foreign participation in local currency government bond markets (%)
Source: IMF Global Financial Stability Report (2014)
0
20
40
60
80
100
120
140
160
180
200
0
10
20
30
40
50
60
70
80
2005 2006 2007 2008 2009 2010 2011 2012 2013 2014 2015
AFR ECA MNA
SAR EAP (RHS) LCR (RHS)
0
100
200
300
400
500
600
0
10
20
30
40
50
60
70
80
2005 2006 2007 2008 2009 2010 2011 2012 2013 2014 2015
AFR ECA
MNA EAP (RHS)
LCR (RHS) SAR (RHS)
0
10
20
30
40
50
Colombia
Brazil
Thailand
Turkey
Romania
Indonesia
Poland
Hungary
Mexico
South
Africa
Malaysia
Share of total (current; percent)
Share of total (7-year average;
percent)

24
Figure 4: Total External Volume Issued by EMDEs
(billions USD)
Figure 5: Total External Volume Issued by EMDEs, by
borrower type (billions USD)
Figure 6: Outstanding External Bonds as % of GDP by
EMDEs - Medians
Figure 7: Total External Volume Issued by EMDEs, by
currency (billions USD)
Figure 8: Total External Volume Issued by EMDEs, by
industry (billions USD)
Figure 9: Total External Volume Issued by EMDEs, by use
of proceeds (billions USD)
0
2
4
6
8
10
12
14
16
EAP ECA
LCR MNA
SAR AFR
China
0
5
10
15
20
25
30
35
Corporate
Sovereign
0
2
4
6
8
10
12
14
EAP ECA
LCR MNA
SAR AFR
China
0
5
10
15
20
25
30
35
Billion, USD
Local Currency Local Currency-China
Non-Local Currency
0
2
4
6
8
10
12
2000
2001
2002
2003
2004
2005
2006
2007
2008
2009
2010
2011
2012
2013
2014
CONS FIN
META OTH
PROFS TRAN
UTIL
0
4
8
12
16
20
0
2
4
6
8
ACQ OTH
PFIN RFIN
WCAP Unknown
PUBF GCP (rhs)

25
Figure 10: Yields of External Issuance by EMDEs, by
income level
Figure 11: Maturities of New External Issuance by
EMDEs, by income level
Figure 12: Maturity Profile Outstanding External Bonds,
by Income Group (billions USD) per March 2015
Figure 13:Maturity Profile Outstanding External Bonds,
by Regions (billions USD)
Figure 14: Maturity Profile Outstanding External Bonds,
% of stock in March 2015
Figure 15: Credit Quality of External Issuance (billions
USD)
3
4
5
6
7
4
5
6
7
8
9
10
11
LMICs
WB Countries
Non-LMICs (rhs)
6
7
8
9
2
4
6
8
10
12
LMICs
WB Countries
Non-LMICs (rhs)
0
20
40
60
80
100
120
140
160
0
5
10
15
20
25
30
35
40
2015
2016
2017
2018
2019
2020
2021
2022
2023
2024
2025
2026
2027
2028
2029
2030
2031
2032
2033
2034
2035
LMIC
Non-LMICs (rhs)
0
10
20
30
40
50
60
70
80
90
2015
2016
2017
2018
2019
2020
2021
2022
2023
2024
2025
2026
2027
2028
2029
2030
2031
2032
2033
2034
2035
EAP
ECA
LCR
MNA
SAR
AFR
China
0%
2%
4%
6%
8%
10%
12%
14%
16%
18%
20%
2015m3
2016m3
2017m3
2018m3
2019m3
2020m3
2021m3
2022m3
2023m3
2024m3
2025m3
2026m3
2027m3
2028m3
2029m3
2030m3
2031m3
2032m3
2033m3
2034m3
2035m3
EAP ECA
LCR MNA
SAR AFR
China
0
5
10
15
20
25
30
35
Billions, USD
Investment Grade China
Investment Grade Other
EMDEs
Non-Investment Grade

26
Figure 16: VIX Index (% per annum)
Figure 17: Libor-OIS Spread (bps)
Figure 18: BofA Merrill Lynch U.S. Corporate BBB
Index OAS (%)
Figure 19: Federal Reserve Balance Sheet Size (billions
USD)
Figure 20: Cumulative total bond issuance by emerging and developing economies
6 pre-crisis years (2002-2007)
6 post-crisis years (2009-2014)
Total
Issuance
(Bil USD)
Median
Issuance/GDP
Issuance in
foreign
currencies
(Bil USD)
Total
Issuance
(Bil USD)
Median
Issuance/GDP
Issuance in
foreign
currencies
(Bil USD)
EMDEs
519
4.3
498
1492
6.7
1323
Low and
Low-Middle
Income
87 1.9 82 246 6.2 238
Other
432
6.2
416
1246
9.1
1084
Oil Exporters
68
1.2
64
110
3.8
102
0
10
20
30
40
50
60
70
80
90
2000
2001
2002
2003
2004
2005
2006
2007
2008
2009
2010
2011
2012
2013
2014
2015
0
50
100
150
200
250
300
350
400
2000
2001
2002
2003
2004
2005
2006
2007
2008
2009
2010
2011
2012
2013
2014
2015
0
1
2
3
4
5
6
7
8
9
2000
2001
2002
2003
2004
2005
2006
2007
2008
2009
2010
2011
2012
2013
2014
2015
0
500
1,000
1,500
2,000
2,500
3,000
3,500
4,000
4,500
5,000
2000
2001
2002
2003
2004
2005
2006
2007
2008
2009
2010
2011
2012
2013
2014
2015

27
Table 1: Definition of Variables
Variable
Definition
Source
Bond Variables
Fixed Yield-to-Maturity
Rate of return on security assuming it is held until maturity at
time of issuance, weighted by deal volume.
Dealogic
Maturity of Bond issued
Duration (Years) of bonds weighted by deal volume
Dealogic
Log of Size of Bond Issued
Log of total proceeds of bond deal (U.S. Dollars)
Dealogic
Currency
Denotes the currency in which the bond issue is priced, either:
U.S. Dollar, Euro, British Pound Sterling, Japanese Yen,
Australian Dollar, Canadian Dollar, or Other
Dealogic
Investment Grade
Indicator value with value 1 if a bond tranche is investment
grade rated and 0 otherwise (credit rating is BBB- or higher
according to S&P or Baa3 or higher according to Moody's)
Dealogic
Borrower Industry
Type of industry: Consumer, Finance, Metals, Professional
Services, Transportation, Utilities, and Other
Dealogic
Borrower Type
Type of the borrowing entity, either: Local or State/Provincial
Authority, Central Government, Non-Public
Dealogic
Deal Type
Type of security offered, either of the following product
types: Asset Backed Securities, Corporate Bond-High Yield,
Corporate Bond-Investment-Grade, Covered Bond, Medium-
Term Note, Money Market, Mortgage-Backed Security, Non-
U.S. Agency, Preferred Share, Short-term Debt, Sovereign,
Local Authority
Dealogic
UST10Y
6 month trailing average of 10Y U.S. Treasury Constant
Maturity Rate
Bloomberg
Global Push Factors
VIX
Log of 6 month trailing average of VIX index. VIX captures
the implied 30-day ahead market volatility derived from S&P
500 index options.
Bloomberg
RISK
Log of 6 month trailing average of U.S. Corporate BBB
Option Adjusted Spread.
Bloomberg
FED
Log of 6 month trailing average of Fed Balance Sheet (Sum
of Mortgage Backed Securities and U.S. treasuries)
Bloomberg
LIBOR
Log of 6 month trailing average of 3 Month Libor-OIS Spread
(3 Month Libor less 3 Month USD Overnight Indexed Swap)
Bloomberg
MOVE
Log of 6 month trailing average of the MOVE index. The
Merrill lynch Option Volatility Estimate (MOVE) Index is a
yield curve weighted index of the normalized implied
volatility on 1-month Treasury options which are weighted on
the 2, 5, 10, and 30 year contracts.
Bloomberg
USREER
6 month log difference of U.S. Real Effective Exchange rate
from BIS. Base year is 2010 (Weighted basket of foreign
Bloomberg

28
Variable
Definition
Source
currencies vs USD)
XRATE
6 month log difference of real exchange rates of each EMDE
country in the sample (USD to country local currency)
Bloomberg
Domestic Pull Factors
GDPPC
Real GDP per capita in U.S. Dollars
IMF World
Economic
Outlook
GROWTH
Year-on-year percentage changes in real GDP
IMF World
Economic
Outlook
EXT
Total debt owed to nonresidents repayable in currency, goods,
or services as a percent of GDP
IMF World
Economic
Outlook
CA
Current account balance as a percent of GDP
IMF World
Economic
Outlook
PCRED
Total domestic private credit to the real sector by deposit
money banks as a percent of GDP
IMF
International
Financial
Statistics
Country-Industry Issuance
ABOVE_AVG_ISSUANCE
Indicators variable which assumes value 1 for a given month
in which a country-industry’s total external bond issuance is
above its monthly 2000-07 average and 0 otherwise
Author’s
calculations

29
Table 2. Descriptive Statistics of Variables
Panel A. Bond tranche data
Variable Obs. Mean
Std.
Dev.
Min Max
Bond Variables
Fixed Yield-to-Maturity
5962
5.06
3.25
0.20
12.31
Maturity of Bond issued
6804
6.00
7.31
0.10
100.08
Log of Size of Bond Issued
6925
18.63
1.49
11.51
22.63
Global Push Factors
VIX
6925
2.86
0.28
2.41
3.95
RISK
6925
0.69
0.29
0.15
1.97
FED
6925
14.44
0.67
13.08
15.23
LIBOR
6573
2.84
0.49
1.92
5.09
MOVE
6925
4.38
0.24
4.03
5.22
USREER
6925
-0.002
0.026
-0.074
0.098
XRATE
6883
-0.015
0.057
-0.319
1.449
UST10Y
6925
3.08
1.14
1.66
6.36
Domestic Pull Factors
GDPPC
6894
8.62
0.59
6.10
9.63
GROWTH
6897
6.02
3.06
-14.80
34.50
EXT
6918
27.63
29.28
1.30
203.70
CA
6922
-0.15
4.48
-39.50
35.50
PCRED
6905
84.56
48.16
2.23
135.76

30
Panel B. Country-Industry data
Variable Obs. Mean
Std.
Dev.
Min Max
Bond Variables
ABOVE_AVG_ISSUANCE
89957
0.03
0.17
0
1
Global Push Factors
VIX
89957
2.99
0.33
2.42
3.95
RISK
89957
0.73
0.41
0.15
1.97
FED
72065
14.00
0.68
13.08
15.24
LIBOR
78029
2.91
0.75
1.92
5.08
MOVE
89957
4.54
0.27
4.04
5.20
USREER
89957
-0.003
0.034
-0.074
0.098
XRATE
84707
-0.007
0.084
-0.570
1.503
UST10Y
89957
3.88
1.17
1.66
6.36
Domestic Pull Factors
GDPPC
87696
7.79
0.99
4.69
9.64
GROWTH
87780
4.82
4.41
-14.80
59.74
EXT
88452
49.74
35.39
1.30
282.90
CA
88788
-3.82
9.17
-49.80
35.50
PCRED
83328
38.00
26.29
1.97
135.76

31
Table 3. Correlations between Key Variables
Fixed Yield-
to-Maturity
Maturity of
Bond issued
Log of Size of
Bond Issued
Global push factors
VIX
0.1891
0.0251
0.0945
RISK
-0.0677
-0.087
-0.0006
FED
-0.5751
-0.2587
-0.2324
LIBOR
-0.1391
-0.0951
-0.0471
MOVE
0.3311
0.1099
0.1641
USREER
-0.1492
-0.1159
-0.0979
XRATE
-0.0962
-0.0397
-0.0575
UST10Y
0.5469
0.2319
0.2039
Domestic Pull Factors
GDPPC
-0.2249
-0.0394
-0.0429
GROWTH
-0.358
-0.2328
-0.3234
EXT
0.3692
0.2112
0.2807
CA
-0.2592
-0.1892
-0.2212
PCRED
-0.6565
-0.3912
-0.4685
Global push factors
VIX
RISK
FED
LIBOR
MOVE
USREER
XRATE
RISK
0.7864
FED
-0.2948
0.1282
LIBOR
0.6738
0.8203
0.1469
MOVE
0.7908
0.5221
-0.5604
0.3982
USREER
-0.0118
0.0171
0.2012
0.0792
-0.2156
XRATE
-0.0885
-0.0361
0.1398
0.0065
-0.146
0.3598
UST10Y
0.0983
-0.3783
-0.836
-0.4811
0.408
0.8279
0.0249
Domestic Pull Factors
EXT
CA
PCRED
GDPPC
-0.0936
-0.0028
0.2108
GROWTH
-0.3165
0.3445
0.5031
EXT
-0.5258
-0.3839
CA
-0.5258
0.3815
PCRED
-0.3839
0.3815

32
Table 4. Bond Issuance Logit Regression Results
Dependent variable: Country-industry monthly issuance above 2000-07 average (1=Yes, 0=No)
(1)
(2)
(3)
(4)
VIX
-0.603***
(0.185)
RISK
-0.789***
(0.199)
FED
0.728***
(0.193)
LIBOR
-0.494***
(0.0833)
GDPPC
1.543***
1.544***
1.435***
1.431***
(0.384)
(0.384)
(0.431)
(0.443)
GROWTH
0.0294**
0.0294**
0.0339**
0.0375***
(0.0133)
(0.0133)
(0.0156)
(0.0144)
EXT
0.00520
0.00520
0.00630
0.00709*
(0.00358)
(0.00358)
(0.00433)
(0.00411)
CA
-0.0329***
-0.0329***
-0.0315**
-0.0289**
(0.0121)
(0.0121)
(0.0124)
(0.0127)
PCRED
0.000204
0.000194
0.00255
0.00227
(0.00757)
(0.00758)
(0.00831)
(0.00791)
UST10Y
-0.0143
-0.0400
-0.0858
-0.196**
(0.100)
(0.0960)
(0.0990)
(0.0962)
Country fixed effects
Yes
Yes
Yes
Yes
Year fixed effects
Yes
Yes
Yes
Yes
Observations
79,464
79,464
61,824
69,048
No. of Countries
64
64
62
64
No. of Country-Industries
448
448
434
448
Pseudo R-squared
0.359
0.360
0.352
0.356
Robust standard errors clustered on the country-industry level in parentheses. *** p<0.01, ** p<0.05, * p<0.1

33
Table 5. Bond Pricing OLS Regression Results
Dependent Variable: Fixed yield-to-maturity of Bond Tranche
(1)
(2)
(3)
(4)
(5)
(6)
(7)
(8)
VIX
0.550*
1.141***
(0.297)
(0.300)
RISK
1.219***
1.266***
(0.299)
(0.376)
FED
-1.125***
-0.837***
(0.295)
(0.308)
LIBOR
0.335**
0.556***
(0.146)
(0.145)
GDPPC
0.777**
0.742**
0.740**
1.227***
(0.320)
(0.323)
(0.325)
(0.238)
GROWTH
-0.0187
-0.0206
-0.0200
-0.0284
(0.0229)
(0.0231)
(0.0219)
(0.0299)
EXT
(0.00754)
(0.00761)
(0.00761)
(0.00950)
0.0225
0.0217
0.0213
0.0236
CA
(0.0215)
(0.0215)
(0.0214)
(0.0218)
0.00867
0.00857
0.00835
0.0139
PCRED
-0.000675
-0.000986
-0.000631
0.000119
(0.00571)
(0.00576)
(0.00569)
(0.00666)
Log of Size of Bond Issued
-0.0441
-0.0666
-0.0495
-0.0684
-0.0506
-0.0683
-0.0318
-0.0479
(0.0479)
(0.0706)
(0.0472)
(0.0706)
(0.0473)
(0.0718)
(0.0471)
(0.0759)
Maturity of Bond issued
0.0537**
0.0344***
0.0542**
0.0347***
0.0536**
0.0341***
0.0548**
0.0326***
(0.0205)
(0.00766)
(0.0207)
(0.00761)
(0.0203)
(0.00774)
(0.0215)
(0.00764)
UST10Y
0.370*
0.850***
0.378*
0.848***
0.432**
0.822***
0.416*
0.932***
(0.201)
(0.175)
(0.202)
(0.174)
(0.187)
(0.163)
(0.218)
(0.190)
Bond Tranche fixed effects
Yes
Yes
Yes
Yes
Yes
Yes
Yes
Yes
Country fixed effects
Yes
No
Yes
No
Yes
No
Yes
No
Year fixed effects
Yes
Yes
Yes
Yes
Yes
Yes
Yes
Yes
Country-period fixed effects
No
Yes
No
Yes
No
Yes
No
Yes
Includes China issuance
Yes
No
Yes
No
Yes
No
Yes
No
Observations
5,881
3,153
5,881
3,153
5,881
3,153
5,593
2,863
R-squared
0.805
0.703
0.805
0.702
0.805
0.704
0.795
0.687
No. of Countries
63
70
63
70
63
70
63
70
No. of Industries
187
192
187
192
187
192
187
191
No. of Bonds
5437
2865
5437
2865
5437
2865
5176
2602
Robust standard errors clustered on the country-industry level in parentheses. *** p<0.01, ** p<0.05, * p<0.1

34
Table 6. Bond Maturity OLS Regression Results
Dependent Variable: Maturity of Bond Tranche
(1)
(2)
(3)
(4)
(5)
(6)
(7)
(8)
VIX
-2.951**
-3.076*
(1.245)
(1.749)
RISK
-3.301***
-3.201***
(0.983)
(1.157)
FED
1.186
2.822**
(1.824)
(1.385)
LIBOR
-1.364*
-1.176
(0.738)
(0.735)
GDPPC
-2.046**
-1.988**
-2.031**
-2.213*
(0.836)
(0.847)
(0.844)
(1.121)
GROWTH
0.0968
0.0996
0.0929
0.0974
(0.0652)
(0.0657)
(0.0658)
(0.0763)
EXT
-0.0355*
-0.0351*
-0.0346*
-0.0419*
(0.0185)
(0.0187)
(0.0186)
(0.0229)
CA
-0.0553
-0.0549
-0.0563
-0.0273
(0.0714)
(0.0719)
(0.0721)
(0.0654)
PCRED
0.0528*
0.0542*
0.0532
0.0609
(0.0316)
(0.0320)
(0.0324)
(0.0387)
Log of Size of Bond Issued
0.524**
0.717**
0.527**
0.713**
0.525**
0.722**
0.445*
0.573
(0.250)
(0.320)
(0.246)
(0.317)
(0.253)
(0.311)
(0.238)
(0.352)
UST10Y
0.00287
-0.361
0.0999
-0.339
0.160
-0.299
-0.0613
-0.425
(0.265)
(0.533)
(0.257)
(0.501)
(0.301)
(0.519)
(0.261)
(0.537)
Bond Tranche fixed effects
Yes
Yes
Yes
Yes
Yes
Yes
Yes
Yes
Country fixed effects
Yes
No
Yes
No
Yes
No
Yes
No
Year fixed effects
Yes
Yes
Yes
Yes
Yes
Yes
Yes
Yes
Country-period fixed effects
No
Yes
No
Yes
No
Yes
No
Yes
Includes China issuance
Yes
No
Yes
No
Yes
No
Yes
No
Observations
6,749
3,684
6,749
3,684
6,749
3,684
6,406
3,347
R-squared
0.393
0.298
0.393
0.298
0.391
0.297
0.401
0.301
No. of Countries
64
71
64
71
64
71
64
71
No. of Industries
198
203
198
203
198
203
197
202
No. of Bonds
6144
3268
6144
3268
6144
3268
5840
2969
Robust standard errors clustered on the country-industry level in parentheses. *** p<0.01, ** p<0.05, * p<0.1

35
Table 7. The Risk-Taking Channel and the Exchange Rate
Country-industry logit regressions
Dependent variable: Country-industry monthly issuance above 2000-07 average (1=Yes, 0=No)
(1)
(2)
USREER
-4.474***
(0.840)
XRATE
-2.399***
(0.478)
Controls
As in Table 4
As in Table 4
Observations
79,464
76,664
No. of Countries
64
63
No. of Country-Industries
448
441
Pseudo R-squared
0.360
0.361
Robust standard errors clustered on the country-industry level in parentheses. *** p<0.01, ** p<0.05, * p<0.1

36
Appendix 1. Country Sample and Issuance Activity by EMDE Entities
Pre-crisis
(2000-2006)
Crisis
(2007-2010)
Post-crisis
(2011-2014)
Country
No. of
Bonds
Total
Volume
($ mln)
No. of
Bonds
Total
Volume
($ mln)
No. of
Bonds
Total
Volume
($ mln)
Albania
1
405
Angola
1
1,000
Argentina
70
40,105
36
6,807
25
6,414
Armenia
1
690
Azerbaijan
2
5
5
279
6
3,444
Bangladesh
1
297
Belarus
3
3
6
1,350
1
800
Belize
2
223
Bolivia
2
989
Bosnia and Herzegovina
1
110
Botswana
1
80
Brazil
331
103,668
190
89,006
260
175,420
Bulgaria
12
3,040
1
291
5
4,583
China
48
16,802
132
29,783
2765
374,001
Colombia
42
15,852
18
12,380
43
33,492
Congo, Democratic Republic of
h
1
478
Costa Rica
8
1,600
8
5,496
Cote d'Ivoire (Ivory Coast)
1
2,332
1
736
Dominican Republic
10
2,271
3
1,180
9
5,160
Ecuador
1
596
2
2,981
Egypt
7
3,664
4
3,439
7
5,261
El Salvador
12
3,540
2
1,244
4
2,558
Ethiopia
3
741
Fiji
1
149
1
250
Gabon
1
1,000
2
2,109
Georgia
4
982
5
1,645
Ghana
1
750
2
1,985
Grenada
1
99
Guatemala
5
1,205
1
85
9
3,770
Honduras
2
1,000
Hungary
44
22,675
25
15,872
22
21,385
India
46
10,277
53
22,235
151
53,640
Indonesia
44
14,380
37
22,487
60
43,058
Iran
2
993
Iraq
1
2,700
Jamaica
22
4,604
10
4,482
9
6,060
Jordan
8
407
1
742
2
2,250
Kazakhstan
67
15,634
33
19,558
21
14,681
Kenya
2
2,794

37
Pre-crisis
(2000-2006)
Crisis
(2007-2010)
Post-crisis
(2011-2014)
Country
No. of
Bonds
Total
Volume
($ mln)
No. of
Bonds
Total
Volume
($ mln)
No. of
Bonds
Total
Volume
($ mln)
Laos
4
348
Lebanon
41
19,899
17
9,796
10
9,791
Macedonia
1
176
1
243
1
666
Malaysia
41
17,650
11
8,612
75
21,765
Marshall Islands
1
230
Mexico
117
78,882
103
60,935
163
131,257
Mongolia
3
249
7
3,404
Montenegro
1
253
3
744
Morocco
1
453
2
2,007
6
5,674
Mozambique
2
810
Namibia
1
491
Nigeria
2
522
14
5,971
Pakistan
3
1,900
1
750
2
3,000
Panama
15
6,855
7
2,365
13
5,242
Paraguay
6
2,398
Peru
15
6,168
29
14,393
61
22,056
Philippines
76
28,983
25
13,968
35
14,382
Romania
11
3,502
3
2,569
12
17,082
Rwanda
1
393
Senegal
1
196
2
988
Serbia
1
1,018
7
6,109
Seychelles
1
199
1
30
South Africa
28
11,632
25
13,204
54
23,902
Sri Lanka
1
100
3
2,000
10
5,775
Tanzania
1
600
Thailand
21
6,218
10
3,531
23
15,954
Togo
1
248
Tunisia
9
2,949
1
253
5
2,017
Turkey
78
45,091
30
24,270
128
58,555
Ukraine
28
8,993
27
10,729
32
21,746
Venezuela
23
16,464
10
31,785
4
12,444
Vietnam
1
737
3
1,173
4
1,532
Zambia
2
1,728

38
Appendix 2. Annualized External Bond Issuance Statistics
Averages are not weighted. Statistics exclude issuance by Chinese entities.
Panel A. Bond issuance characteristics
Year
Total Volume
($mln)
Number of
bond tranches
Avg. Yield (%)
Avg. Maturity
(years)
Investment
grade (%)
2000
6.33E+10
189
9.5
7.2
21%
2001
5.73E+10
170
8.8
6.7
33%
2002
4.39E+10
125
9.0
8.5
36%
2003
5.76E+10
167
8.0
7.9
41%
2004
7.71E+10
200
7.4
8.3
36%
2005
1.11E+11
249
7.3
9.7
40%
2006
9.56E+10
294
8.0
9.3
32%
2007
9.94E+10
297
8.1
12.2
45%
2008
4.55E+10
103
7.4
8.3
46%
2009
1.07E+11
159
7.7
9.2
48%
2010
1.60E+11
300
7.1
9.4
53%
2011
1.56E+11
284
6.8
9.4
53%
2012
2.05E+11
400
5.3
8.9
70%
2013
2.24E+11
438
5.3
7.8
64%
2014
2.16E+11
407
5.1
8.7
69%
Panel B. Global push factors around time of issuance
Year Avg. VIX Avg. RISK (%)
Avg. LIBOR
(bps)
Avg. FED
($mln)
Avg. UST10Y
(%)
2000
23.05
1.85
-
5.90E+05
6.20
2001
25.01
2.35
23.33
6.09E+05
5.24
2002
26.12
2.59
14.68
6.63E+05
4.80
2003
24.69
2.25
14.67
6.52E+05
3.93
2004
16.57
1.35
11.85
6.75E+05
4.31
2005
13.13
1.28
9.56
7.19E+05
4.23
2006
13.10
1.23
7.93
7.54E+05
4.73
2007
13.53
1.27
13.87
7.79E+05
4.71
2008
24.17
2.84
70.84
6.67E+05
3.89
2009
33.88
5.08
66.03
9.77E+05
3.30
2010
23.67
2.48
16.28
1.78E+06
3.35
2011
20.41
2.15
15.23
2.16E+06
3.05
2012
21.27
2.68
33.14
2.51E+06
1.88
2013
14.92
2.05
16.66
2.84E+06
2.04
2014
13.80
1.67
14.57
3.84E+06
2.67

39
Panel C. Domestic pull factors around time of issuance
Year
Avg. GDPPC
(real US$)
Avg.
GROWTH (%)
Avg. CA (%) Avg. EXT (%)
Avg. PCRED
(%)
2000
4706
3.64
-3.14
45.39
31.89
2001
4077
0.88
-3.03
52.08
34.40
2002
2980
3.50
-0.87
54.66
36.99
2003
3282
3.00
0.53
48.83
31.53
2004
3983
6.50
-0.01
51.60
36.24
2005
4662
5.36
-0.71
42.64
35.98
2006
4946
6.43
-0.88
47.95
39.65
2007
5799
6.63
-2.62
42.53
42.72
2008
7848
4.28
-1.85
41.81
46.30
2009
6401
0.00
-1.11
41.28
40.34
2010
7507
6.87
-1.62
33.97
41.86
2011
8293
4.64
-2.45
40.36
50.92
2012
7856
3.51
-3.15
38.16
54.65
2013
7611
3.66
-3.40
39.96
53.76
2014
7669
3.43
-3.22
40.77
53.34
Panel D. Fraction of country-industries with monthly issuance volume above historical average
Year
% of country-
industries that
issue above their
historical average
2000
1.98%
2001
1.83%
2002
1.59%
2003
1.91%
2004
2.53%
2005
3.02%
2006
3.35%
2007
3.10%
2008
1.14%
2009
1.96%
2010
3.67%
2011
3.79%
2012
4.63%
2013
5.30%
2014
5.26%

40
Appendix 3. Interactions between Country Characteristics and Global Factors
Table 1. Country-Industry Level Logit Regressions (Equation (1))
Dependent Variable: Issuance Country-industry monthly issuance above 2000-07 average (1=Yes, 0=No)
Push
Factor
GDPPC
Inter-
action
Push
Factor
GROWTH
Inter-
action
Push
Factor
EXT
Interaction
Push
Factor
CAD
Inter-
action
Push
Factor
PCRED
Interaction
VIX
-1.710
-0.710***
-0.735***
-0.713***
-0.351*
(1.269)
(0.135)
(0.154)
(0.103)
(0.184)
Pull Factor
0.504
0.0126
0.00351
-0.0334
0.0197**
(0.464)
(0.0631)
(0.00719)
(0.0381)
(0.00918)
Interaction
0.119
-0.000720
0.000504
0.000276
-0.00724***
(0.150)
(0.0200)
(0.00231)
(0.0132)
(0.00270)
Obs.
#C
#Id
Obs.
#C
#Id
Obs.
#C
#Id
Obs.
#C
#Id
Obs.
#C
#Id
70,644
61
427
70,644
61
427
70,644
61
427
70,644
61
427
70,644
61
427
RISK
-0.535
-0.642***
-0.575***
-0.628***
-0.462***
(0.873)
(0.120)
(0.128)
(0.0912)
(0.154)
Pull Factor
1.034***
-0.000531
0.00636*
-0.0322***
0.00104
(0.159)
(0.0201)
(0.00329)
(0.0118)
(0.00511)
Interaction
-0.0111
0.00310
-0.00126
-0.000528
-0.00343*
(0.105)
(0.0154)
(0.00173)
(0.00939)
(0.00208)
Obs.
#C
#Id
Obs.
#C
#Id
Obs.
#C
#Id
Obs.
#C
#Id
Obs.
#C
#Id
70,644
61
427
70,644
61
427
70,644
61
427
70,644
61
427
70,644
61
427
FED
2.540***
0.353***
0.894***
0.569***
0.178
(0.939)
(0.101)
(0.101)
(0.0812)
(0.142)
Pull Factor
3.183**
-0.704**
0.112***
-0.212
-0.111***
(1.376)
(0.328)
(0.0274)
(0.182)
(0.0368)
Interaction
-0.229**
0.0540**
-0.00789***
0.0135
0.00774***
(0.106)
(0.0236)
(0.00194)
(0.0129)
(0.00255)
Obs.
#C
#Id
Obs.
#C
#Id
Obs.
#C
#Id
Obs.
#C
#Id
Obs.
#C
#Id
53,928
59
413
53,928
59
413
53,928
59
413
53,928
59
413
53,928
59
413
LIBOR
-1.018**
-0.473***
-0.452***
-0.462***
-0.408***
(0.442)
(0.0631)
(0.0684)
(0.0495)
(0.0871)
Pull Factor
0.921***
-0.000968
0.00742*
-0.0288
0.00225
(0.190)
(0.0294)
(0.00392)
(0.0178)
(0.00584)
Interaction
0.0654
0.00266
-0.000242
8.13e-05
-0.00105
(0.0510)
(0.00923)
(0.00115)
(0.00579)
(0.00117)
Obs.
#C
#Id
Obs.
#C
#Id
Obs.
#C
#Id
Obs.
#C
#Id
Obs.
#C
#Id
60,732
61
427
60,732
61
427
60,732
61
427
60,732
61
427
60,732
61
427
Robust standard errors clustered on the country-industry level in parentheses. *** p<0.01, ** p<0.05, * p<0.1 Note: Obs. = Observations, #C = Number of
Countries, #Id = Number of Industries

41
Table 2. Bond-Level Pricing OLS Regressions (Equation (2), excluding Chinese issuance)
Robust standard errors clustered on the country-industry level in parentheses. *** p<0.01, ** p<0.05, * p<0.1 Note: Obs. = Observations, #C = Number of
Countries, #Id = Number of Industries, # Bd = Number of Bonds. R-squared for regressions with the VIX, RISK, and FED = 0.65; R-squared for regressions with
LIBOR = 0.63.
Dependent Variable: Fixed yield-to-maturity of Bond Tranche
Push
Factor
GDPPC
Inter-
action
Push
Factor
GROWTH
Inter-
action
Push
Factor
EXT
Inter-
action
Push
Factor
CAD
Inter-
action
Push
Factor
PCRED
Interaction
VIX
-0.907
0.654*
0.860**
0.946***
1.390**
(1.654)
(0.334)
(0.340)
(0.328)
(0.523)
Pull Factor
-0.423
-0.317**
-0.00223
0.103
0.0153
(0.792)
(0.137)
(0.00719)
(0.108)
(0.0233)
Interaction
0.224
0.0945**
0.00371
-0.0340
-0.00814
(0.188)
(0.0412)
(0.00232)
(0.0362)
(0.00805)
Obs.
#C
#Id
#Bd
Obs.
#C
#Id
#Bd
Obs.
#C
#Id
#Bd
Obs.
#C
#Id
#Bd
Obs.
#C
#Id
#Bd
2,738
58
173
2,502
2,738
58
173
2,502
2,738
58
173
2,502
2,738
58
173
2,502
2,738
58
173
2,502
RISK
-0.179
0.893**
0.937**
1.076***
1.277***
(2.163)
(0.381)
(0.390)
(0.375)
(0.446)
Pull Factor
0.155
-0.0874**
0.00516
0.0264
-0.00645
(0.456)
(0.0387)
(0.00751)
(0.0266)
(0.00557)
Interaction
0.154
0.0713**
0.00419**
-0.0355
-0.00396
(0.251)
(0.0277)
(0.00204)
(0.0264)
(0.00655)
Obs.
#C
#Id
#Bd
Obs.
#C
#Id
#Bd
Obs.
#C
#Id
#Bd
Obs.
#C
#Id
#Bd
Obs.
#C
#Id
#Bd
2,738
58
173
2,502
2,738
58
173
2,502
2,738
58
173
2,502
2,738
58
173
2,502
2,738
58
173
2,502
FED
-0.832
-0.640*
-0.624*
-0.694*
-0.655*
(1.844)
(0.357)
(0.362)
(0.382)
(0.389)
Pull Factor
0.0478
0.457
0.0292
-0.0677
0.00858
(2.794)
(0.449)
(0.0401)
(0.355)
(0.0408)
Interaction
0.0141
-0.0354
-0.00152
0.00531
-0.00125
(0.207)
(0.0327)
(0.00284)
(0.0258)
(0.00300)
Obs.
#C
#Id
#Bd
Obs.
#C
#Id
#Bd
Obs.
#C
#Id
#Bd
Obs.
#C
#Id
#Bd
Obs.
#C
#Id
#Bd
2,738
58
173
2,502
2,738
58
173
2,502
2,738
58
173
2,502
2,738
58
173
2,502
2,738
58
173
2,502
LIBOR
0.311
0.294*
0.286
0.438***
0.496**
(1.380)
(0.170)
(0.174)
(0.149)
(0.236)
Pull Factor
0.753
-0.165**
0.00290
0.0571
-0.0110
(0.628)
(0.0711)
(0.00972)
(0.0568)
(0.0133)
Interaction
0.0188
0.0423*
0.00396**
-0.0188
-0.000521
(0.163)
(0.0218)
(0.00167)
(0.0194)
(0.00460)
Obs.
#C
#Id
#Bd
Obs.
#C
#Id
#Bd
Obs.
#C
#Id
#Bd
Obs.
#C
#Id
#Bd
Obs.
#C
#Id
#Bd
2,454
58
173
2,245
2,454
58
173
2,245
2,454
58
173
2,245
2,454
58
173
2,245
2,454
58
173
2,245

42
Table 3. Bond Maturity OLS Regressions (Equation (2), excluding Chinese issuance)
Dependent Variable: Maturity of Bond Tranche
Push
Factor
GDPPC
Interaction
Push Factor
GROWTH
Interaction
Push Factor
EXT
Interaction
Push Factor
CAD
Interaction
Push Factor
PCRED
Interaction
VIX
2.399
-4.766**
-4.108
-3.735*
-2.003*
(6.849)
(2.198)
(2.560)
(1.869)
(1.008)
Pull Factor
-0.0849
-0.416
-0.0407
-0.404
0.184
(2.825)
(0.412)
(0.0434)
(0.404)
(0.187)
Interaction
-0.747
0.175
0.00160
0.122
-0.0457
(0.780)
(0.132)
(0.0111)
(0.122)
(0.0541)
Obs.
#C
#Id
#Bd
Obs.
#C
#Id
#Bd
Obs.
#C
#Id
#Bd
Obs.
#C
#Id
#Bd
Obs.
#C
#Id
#Bd
3,247
60
184
2,887
3,247
60
184
2,887
3,247
60
184
2,887
3,247
60
184
2,887
3,247
60
184
2,887
RISK
-0.122
-5.049***
-4.708**
-4.486***
-3.325***
(3.943)
(1.873)
(1.928)
(1.630)
(1.089)
Pull Factor
-2.005
0.0198
-0.0366
-0.112
0.0761
(1.254)
(0.117)
(0.0229)
(0.123)
(0.0569)
Interaction
-0.531
0.120
0.00145
0.0990
-0.0352
(0.496)
(0.115)
(0.00741)
(0.103)
(0.0389)
Obs.
#C
#Id
#Bd
Obs.
#C
#Id
#Bd
Obs.
#C
#Id
#Bd
Obs.
#C
#Id
#Bd
Obs.
#C
#Id
#Bd
3,247
60
184
2,887
3,247
60
184
2,887
3,247
60
184
2,887
3,247
60
184
2,887
3,247
60
184
2,887
FED
5.666
3.432**
3.399**
3.649***
4.318***
(3.871)
(1.406)
(1.471)
(1.365)
(1.530)
Pull Factor
0.912
-0.656
-0.0704
-0.648
0.312
(5.961)
(1.510)
(0.118)
(0.995)
(0.228)
Interaction
-0.241
0.0552
0.00255
0.0431
-0.0190
(0.454)
(0.109)
(0.00797)
(0.0693)
(0.0151)
Obs.
#C
#Id
#Bd
Obs.
#C
#Id
#Bd
Obs.
#C
#Id
#Bd
Obs.
#C
#Id
#Bd
Obs.
#C
#Id
#Bd
3,247
60
184
2,887
3,247
60
184
2,887
3,247
60
184
2,887
3,247
60
184
2,887
3,247
60
184
2,887
LIBOR
0.154
-2.102*
-1.496
-1.467
-0.675
(2.437)
(1.107)
(1.058)
(0.883)
(0.561)
Pull Factor
-2.772
-0.188
-0.0371
-0.220
0.120
(1.693)
(0.183)
(0.0300)
(0.196)
(0.0854)
Interaction
-0.206
0.105*
-0.00277
0.0690
-0.0224
(0.293)
(0.0616)
(0.00381)
(0.0535)
(0.0196)
Obs.
#C
#Id
#Bd
Obs.
#C
#Id
#Bd
Obs.
#C
#Id
#Bd
Obs.
#C
#Id
#Bd
Obs.
#C
#Id
#Bd
2,918
60
183
2,595
2,918
60
183
2,595
2,918
60
183
2,595
2,918
60
183
2,595
2,918
60
183
2,595
Robust standard errors clustered on the country-industry level in parentheses. *** p<0.01, ** p<0.05, * p<0.1 Note: Obs. = Observations, #C = Number of
Countries, #Id = Number of Industries, # Bd = Number of Bonds. R-squared for all regressions = 0.25; R-squared for regressions with LIBOR = 0.63

Annex C - The role of taxation in shaping corporate liability structures
1
Tax incentives to use debt finance
The deductibility of interest payments against corporate income tax (CIT) is associated
with two types of distortion to corporate financial structures favoring debt finance:
• ‘Debt bias’: Since returns to equity are generally not deductible, debt finance is tax-
preferred over equity finance.
2
• ‘Debt shifting’: Cross-country differences in rates of CIT create opportunities for tax
planning within multinational groups, by lending from low tax countries to related
entities in high tax countries or by locating external borrowings in high tax countries.
Variants include use of hybrid instruments that give rise to deductible interest expense
but no corresponding taxable income elsewhere, and hybrid entities that can claim more
than one tax deduction for the same interest expense.
The two are related: within multinational groups, the tax gains from debt shifting may exacerbate
the bias in favor of financing externally by debt.
There is ample empirical evidence that these tax distortions significantly affect the
financial structures of non-financial corporations.
3
The meta analysis in de Mooij (2011)
derives a consensus value for the impact of the CIT rate on the debt-asset ratio of non-financial
firms of 0.28. This means, for instance, that a CIT rate of, for instance, 40 percent (roughly the
combined federal-state rate in the U.S.) might be responsible for leverage ratios that are more
than 10 percentage-points higher than otherwise. There is significant variation according to firm
size, with the smallest and largest firms being notably more responsive to tax than medium-sized
firms (Heckemeyer and De Mooij, 2013). Preliminary OECD analysis suggests that MNEs’ overall
leverage is sensitive to the possibility to locate external and internal debt in higher-tax rate
countries, though the magnitude of this effect appears limited.
1
Prepared by staff of the International Monetary Fund and the Organisation for Economic Co-operation and
Development. This note represents views of those staff and not necessarily those of the Management, Executive
Boards or Member States of these organizations. This is a draft and should not be cited.
2
Treatment under the personal income tax (PIT) and withholding taxes also need to be taken into account. The
tax preference for debt generally remains not only for tax-exempt entities but also for top rate PIT payers (ZEW,
2012).
3
Debt bias is also prevalent in the financial sector, where it might be of a bigger concern to financial stability (see
for example Keen and De Mooij (2015)).

2
There is no good reason to tax-favor debt. The original rationale for allowing a deduction only
for debt was that interest is a cost of doing business and equity returns reflect business income,
a view also reflected in international accounting principles. In economic terms, however, both
payments represent a return to capital and there is no a priori reason to tax one different from
the other. In principle, there could be a reason to tax favor debt if, for some reason, leverage
ratios would be too low in the absence of taxation. But the corporate finance literature offers
little reason to believe this to be the case. To the contrary, to the extent that bankruptcy (or the
risk of bankruptcy) imposes costs not borne by shareholders, the presumption is that leverage
would tend to be excessive. From a legal and administrative perspective too, the differential
treatment is problematic, and hybrid financial instruments (in certain cases treated as debt for tax
purposes, but with equity-like characteristics) increasingly blur the distinctions between the two.
Implications for financial stability
The primary financial stability concern is with the tax incentive towards excessive use of
external borrowing.
4
Intragroup debt can result in significant levels of debt of MNE affiliates
without showing up on the consolidated financial statement of the MNE group. But so long as
there is full risk-sharing within MNE groups, internal borrowing likely has limited stability
implications. Manipulating the location of group debt may increase bankruptcy risks of the
entities where debt is located if there is not full risk sharing within the group. However, MNE
entities are generally thought to benefit from explicit or implicit guarantees from their parents
Huizinga et al., 2008). The primary concern is thus with external debt.
The stability risks associated with excess leverage in the non-financial sector can run
through different channels. First, high leverage in firms can magnify financial distress and
increase the probability that a firm goes bankrupt—or requires costly bail-out—in case of an
adverse shock. Debt bias can thus magnify swings in business cycle and exacerbate the depth of
an economic crisis. Second, high debt levels in the non-financial sector may spill over to the
financial system. For instance, increased default risks and greater vulnerability of non-financial
firms may affect financial institutions through increased losses on bank loans. Finally, if taxation
encourages substitution of debt for equity and debt is primarily channeled through the banking
system, debt bias makes the banking sector inefficiently large. Given the significant externalities
associated with contagion and systemic effects of bank defaults, debt bias in non-financial
corporates may thus contribute to the overall size of financial stability risks.
4
A few papers have looked at the welfare costs of debt bias under the assumption that the no-tax outcome
would be efficient. Sorensen (2014), for instance, puts this at between 2 and 3 percent of total corporate tax
revenue for the case of Norway (which has a 28 percent CIT rate). This though ignores the social costs involved
with risks to financial stability.

3
There is little evidence on the significance of these effects, though there are signs that they
are not trivial. Sutherland and Hoeller (2012) find that higher leverage in the non-financial
corporate sector is associated with a significantly greater volatility of investment spending and,
related, a higher probability of, and deeper, recession; Davis and Stone (2004) find that it is
associated with larger investment and inventory declines after financial crisis. There have been
cases in which non-financial corporates have been treated as systematically important.
Policy responses
Policy makers are increasingly focused on tax incentives to debt financing:
• Measures to address debt shifting have attracted increased attention (Box 1),
though these relate less directly to stability concerns than does debt bias in relation to
external finance.
• Debt bias concerns have come to increasing prominence, not only in relation to the
financial sector—several countries having introduced special bank levies—but non-
financials too. The European Commission, for instance, highlights this as an area
requiring attention in making tax policy recommendations to the member states (see for
instance, European Commission, 2012).
Box 1: Addressing debt shifting
Thin capitalization or earnings stripping rules, which limit the extent of interest deductibility, have become more
widespread. In two-thirds of the countries with such restrictions, however, they apply only to intracompany
interest, rather than all interest expenses (Merlo and Wamser, 2014), and so do not address the debt bias.
The empirical evidence is that these restrictions have the intended effect of reducing leverage in the country
adopting them, but may result in external and internal debt being shifted to other countries (Blouin et al., 2014;
Buettner et al. 2012; Overreach and Wamser 2014). This points to the importance of a coordinated approach to
this aspect of avoidance, which is being addressed in Action 4 of the G20-OECD Base Erosion and Profit Shifting
(BEPS) Project.
,
A pragmatic response to debt bias is to extend interest limitation rules to loans between
both related and unrelated parties. The disadvantage of this is that simple limits struggle to
take account of the distinct circumstances of different sectors and enterprises.
One way to eliminate debt bias is by denying all interest deductions: a ‘comprehensive
business income tax’ (CBIT). The base broadening this implies would also allow the statutory
CIT rate to be cut as part of a revenue-neutral reform. However, the CBIT has serious drawbacks:
it (i) increases the cost of capital on debt-financed investment (unless compensating measures
are taken); (ii) raises significant problems with the taxation of banks (not least in terms of public
perception), which would become effectively untaxed on their margin-based profits; and
4
(iii) significantly distorts international financial transactions. No country has ever adopted the
CBIT.
A more promising and practicable approach than the CBIT is to provide an ’Allowance for
Corporate Equity’ (ACE) deduction: a deduction, that is, for a notional return on equity. The
base to which this rate would apply is the book value of equity, minus equity participations in
other firms (to avoid duplication of tax relief). There is now meaningful experience from countries
that have or had an ACE or a variant thereof for some time, including Austria, Belgium, Brazil,
Croatia, Italy, and Latvia. The system seems to have reduced leverage ratios (Hebous and Ruf,
2015).
Potential concerns with the adoption of an ACE include its revenue cost and avoidance
opportunities—but these can be mitigated. Tentative calculations suggest that an ACE, being
a base-narrowing measure, would have an average budgetary cost in advanced countries of 0.5
percent of GDP, or over 15 percent of CIT revenues (De Mooij, 2012).
This loss can be mitigated
by applying the ACE only to new investment (as in Italy), without reducing the economic benefits
of the ACE since, for existing capital, the ACE is simply a windfall gain. Care is also needed to
craft the ACE to limit avoidance opportunities (Hebous and Ruf, 2015; Zangari, 2014).
5
References
Blouin, Jennifer, Harry Huizinga, Luc Laeven, and Gaetan Nicodème, 2014, “Thin Capitalization
Rules and Multinational Firm Capital Structure,” IMF Working Paper, WP/14/12
(Washington: International Monetary Fund).
Buettner, Thiess and Georg Wamser, 2013, “Internal Debt and Multinational Profit Shifting:
Empirical Evidence from Firm-Level Panel Data,” National Tax Journal, Vol. 66 (1).
Buettner, Thiess, Michael Overesch, Ulrich Schreiber, and Georg Wamser, 2012, “The impact of
thin capitalisation rules on the capital structure of multinational firms,” Journal of Public
Economics, Vol. 96, (11-12).
Davis, E. Philip and Mark Stone, 2004, “Corporate Financial Structure and Financial Stability,”
Journal of Financial Stability¸ Vol. 1, pp. 65-91.
De Mooij, Ruud A., 2011, “The Tax Elasticity of Corporate Debt: A Synthesis of Size and
Variations,” IMF Working Paper 11/95 (Washington: International Monetary Fund).
De Mooij, Ruud A., 2012, “Tax Biases to Debt Finance: Assessing the Problem, Finding Solutions,”
Fiscal Studies Vol. 33 (4), pp. 489-512.
Dischinger, Matthias, Ulrich Glogowsky, and Marcus Strobel, 2010, “Leverage, Coporate Taxes
and Debt Shifting of Multinationals: The Impact of Firm-specific Risk”, Mimeo, University
of Munich.
European Commission, 2012, “Tax Reforms in EU Member States, 2012 Report,“ Taxation Paper
no. 34-2012.
Hebous, Shafik and Martin Ruf, 2015, “Evaluating the Effects of ACE Systems on Multinational
Debt Financing and Investment,” Mimeo, University of Frankfurt.
Huizinga Harry, Luc Laeven and Gaetan Nicodème, 2008, “Capital Structure and International
Debt Shifting,” Journal of Financial Economics, Vol. 88.
Heckemeyer, Jost, and Ruud A. de Mooij, 2013, “Taxation and Corporate Debt: Are Banks any
Different?,” IMF Working Paper 13/221 (Washington: International Monetary Fund).
International Monetary Fund, 2009, “Debt Bias and Other Distortions: Crisis-Related Issues in Tax
Policy,” IMF Policy Paper (Washington: International Monetary Fund).
Keen, Michael, and Ruud A. de Mooij, forthcoming in 2015, “Debt, Taxes and Banks,” Journal of
Money, Credit and Banking.
Merlo, Valeria, and Georg Wamser, 2014, “Debt Shifting and Thin-Capitalization Rules,” CESifo
Dice Report 4/2014.
Møen, Jarle, Dirk Schindler, Guttorm Schjelderup, and Julia Tropina, 2011, “International Debt
Shifting: Do Multinationals Shift Internal or External Debt?,” CESifo Working Paper Series,
No. 3519.

6
Overesch, Michael and Georg Wamser, 2014, “Bilateral internal debt financing and tax planning
of multinational firms,” Review of Quantitative Finance and Accounting, Vol. 42 (2).
Sørensen, Peter Birch, 2014, “Taxation and the Optimal Constraint on Corporate Debt Finance,”
CESifo Working Paper No. 5101.
Sutherland, Douglas and Peter Hoeller, 2012, “Debt and Macroeconomic Stability: An Overview of
the Literature and Some Empirics,” OECD Economics Department Working Papers No.
1006, OECD publishing. http://dx.doi.org/10.787/5k8xb75txzf5-en
ZEW (Zentrum für Europaische Wirtschaftsforschung), 2012, Effective Tax Levels Using the
Devereux/Griffith Methodology, Mannheim.
Zangari, Ernesto, 2014, “Addressing the Debt Bias: A Comparison Between the Belgian and the
Italian ACE Systems,” European Commission Taxation Papers Working Paper N.44-2014.
http://ec.europa.eu/taxation_customs/resources/documents/taxation/gen_info/economic
_analysis/tax_papers/taxation_paper_44.pdf

PLEN/2015/47 ANNEX D
1
International Organization of Securities Commissions
International Policies for Public Disclosure -
Corporates as Public Issuers of Debt and Equity Securities
I. Introduction
The International Organization of Securities Commissions (IOSCO) has established six
principles of securities regulation related to an issuer’s disclosure of information to investors
who purchase its securities in the public capital markets.
1
These principles are primarily in
support of IOSCO’s objective of securities regulation related to investor protection.
To assist securities regulators in implementing these six principles IOSCO has also developed
standards and principles specific to the content of issuer disclosure for cross-border offerings and
listings of both debt and equity securities in the public capital markets. Further, from time to
time IOSCO has made public statements related to the issuer financial information element of
these issuer disclosures. These public statements—versus IOSCO’s development of its own
principles for the preparation of issuer financial statements—are precipitated by the fact that
other international organizations develop international accounting and auditing standards,
respectively.
Securities regulators establish issuer disclosure requirements to protect investors by addressing
the asymmetry of information about the issuer that exists between management and the investors
who buy, hold, and sell a company’s securities in the public capital markets. The disclosures
that a securities regulators selects are intended to give investors information that is timely,
material and not misleading about a company and its circumstances (for example, issuer
domicile, size, industry, number of securities holders, and so forth). As an interest in the residual
profits of a company, the pricing of equity capital may more keenly depend on the disclosures
made to address this asymmetry than the pricing of debt capital.
Issuer disclosure requirements for publicly traded debt and equity securities may be one factor
that companies consider in assessing the cost of capital for purposes of making capital structure
determinations, such as whether to raise capital by issuing debt securities, equity securities, or
some combination of each or utilizing other sources of capital, such as bank loans. More broadly
speaking, companies’ capital structure (debt versus equity) decisions involve their assessment of
market conditions and their own company characteristics and needs. All of these would affect
the overall cost of capital.
1
See International Organization of Securities Commissions Objectives and Principles of Securities Regulation, June
2010, available at: https://www.iosco.org/library/pubdocs/pdf/IOSCOPD323.pdf

2
II. Issuer Disclosure for Cross-Border Offerings and Listings
IOSCO has developed two sets of issuer disclosure standards and principles for prospectuses
used in cross-border offerings and listings of securities in the public capital markets; namely, the
International Debt Disclosure Principles
2
(debt principles) and the International Equity
Disclosure Standards
3
(equity standards). IOSCO principles and standards are not self-
executing; rather, they are prepared to assist national securities regulators in establishing national
requirements by informing them of the view of multiple countries on a particular policy matter.
The International Debt Disclosure Principles are more in the form of principles that jurisdictions
can implement as they deem appropriate in the context of their national regulatory frameworks.
In this sense the debt principles are intended as more of a starting point for consideration by
national securities regulators. The International Equity Disclosure Standards, however, are
broadly accepted as a disclosure benchmark, and the equity disclosure regimes of many IOSCO
member jurisdictions are based more directly on them. The next page contains a comparison of
the disclosure topics that IOSCO has cited in its International Debt Disclosure Principles as
compared to those it has cited in its International Equity Disclosure Standards. The actual debt
principles and equity standards contain more elaborative and detailed content than is listed here.
IOSCO has also developed issuer disclosure principles to complement its debt principles and its
equity standards. These are the Ongoing Disclosure Principles
4
(ongoing principles) and the
Periodic Disclosure Principles
5
(periodic principles). Both the ongoing and the periodic
principles address the issuer disclosure that informs investors who participate in the secondary
public capital markets; that is, the trading that occurs among investors after the initial offering
and /or listing of an issuer’s securities. A common example of this type of disclosure is an
issuer’s annual financial report. In developing its ongoing and periodic principles, IOSCO has
not distinguished between disclosures that issuers would make to the secondary public debt
markets versus to the secondary public equity markets.
2
See International Disclosure Principles for Cross-Border Offerings and Listings of Debt Securities by Foreign
Issuers - Final Report, Report of the Technical Committee of IOSCO, March 2007, available at:
https://www.iosco.org/library/pubdocs/pdf/IOSCOPD242.pdf.
3
See International Disclosure Standards for Cross-Border Offerings and Initial Listings by Foreign Issuers, Report
of IOSCO, September 1998, available at:
https://www.iosco.org/library/pubdocs/pdf/IOSCOPD81.pdf.
4
See Principles for Ongoing Disclosure and Material Development Reporting by Listed Entities, A Statement of the
Technical Committee of the International Organization of Securities Commissions, October 2002, available at:
https://www.iosco.org/library/pubdocs/pdf/IOSCOPD132.pdf.
5
See Principles for Periodic Disclosure by Listed Entities - Final Report, Report of the Technical Committee of
IOSCO, February 2010, available at:
https://www.iosco.org/library/pubdocs/pdf/IOSCOPD317.pdf.

3
IOSCO Principles and Standards for Issuer Disclosure
In Cross-Border Offerings and Listings
International Debt Disclosure Principles –
Disclosure Topics
International Equity Disclosure Standards -
Comparable Disclosure Topics
Identity of Parties Responsible for the Document
Identity of Directors, Senior Management and
Advisors
Description of the Debt Securities (including
Covenants Relating to the Issuance)
Offer and Listing Information
Risk Factors
Key Information: selected financial data,
capitalization and indebtedness, reasons for the
offering, use of proceeds, and risk factors
Markets (including identity of exchanges, and
entities providing liquidity)
Offer and Listing Information
Information about the Public Offering
Offer and Listing Information; Offer Statistics and
Expected Timetable
Taxation
Additional Information (e.g., taxation)
Selected Financial Information
Key Information: selected financial data,
capitalization and indebtedness, use of proceeds,
and risk factors
Information about the Issuer
Information on the Company
Operating and Financial Review and Prospects
Operating and Financial Review and Prospects
Directors, Senior Management and Employees
Directors, Senior Management and Employees
Major Shareholders and Related Party Transactions
Major Shareholders and Related Party Transactions
Interests of Experts and Counsel
Identify of Directors, Senior Management and
Advisors
Financial Information
Financial Information
Additional information (e.g., memorandum and
articles of association; material contracts)
Additional Information (e.g. share capital, material
contracts, subsidiary information)

4
III. Issuer Financial Statement Disclosure
Issuers prepare the financial statement element of their financial information disclosures in
accordance with a set of accounting standards, such as a set of national accounting standards or
International Financial Reporting Standards (IFRS). IFRS contain standards that address how an
issuer should recognize, measure, and present its outstanding debt and equity in its balance sheet,
as well as disclose information about each in the footnotes to its financial statements.
6, 7
An issuer’s debt and equity financing will often comprise a large majority of its total financing,
and thus compose a significant portion of the right hand side of its balance sheet, and sometimes
of its statement of cash flows. Thus, debt and equity are typically substantial components of an
issuer’s financial statements, and therefore the associated disclosures may be extensive. The
next page contains a comparison of IOSCO’s understanding of the IFRS disclosure topics for an
issuer’s outstanding debt as compared to those contained in IFRS for its outstanding equity.
In certain circumstances, an entity may be involved with a structured entity (SE) that has its own
debt or equity financing. In some cases, the structured entity will be consolidated by the
reporting entity, and therefore the issuer will make disclosures in its financial statements about
the debt issued by the SE of the same type as for its own debt. In the circumstances in which the
issuer does not consolidate the SE, IOSCO understands that IFRS nonetheless requires issuer
disclosures about the risks and potential exposures that result from its relationship with the SE.
In 2007 IOSCO surveyed its members about their experience with financial reporting for SEs
(also often referred to as Special Purpose Entities or SPEs, or as Structured Entities or Variable
Interest Entities).
8
During the years immediately preceding the issuance of the survey results,
IOSCO members had implemented various approaches to improving disclosure and reporting of
SEs. In some jurisdictions the national accounting standard setter had also made improvements
to the accounting and disclosure requirements, and in other jurisdictions, the securities regulator
had taken similar steps to improve disclosure requirements. At the time of the survey IOSCO
members observed that there were fewer unconsolidated SEs than there had been before the most
recent accounting standard setting. Accordingly, this may have led to a lesser influence on an
issuer’s pursuit of issuing debt in an SE versus its own debt or equity.
The other common obligation of an issuer that may contain an element of financing is the
issuer’s commitments as a lessee. Based upon specified criteria IFRS requires an issuer to reflect
certain lessee payment commitments on its balance sheet, and to disclose the others.
6
IFRS disclosure requirement for debt are described in the following standards: IAS 1, Presentation of Financial
Statements; IFRS 7, Financial Instruments: Disclosure; IFRS 9, Financial Instruments; IAS 23, Borrowing Costs;
IAS 17, Leases; IAS 32, Financial Instruments: Presentation.
7
IFRS disclosure requirements for equity are described in the following standards: IAS 1, Presentation of Financial
Statements; IAS 32, Financial Instruments: Presentation; IAS 33, Earnings per Share.
8
See Special Purpose Entities, Technical Committee of the International Organization of Securities Commissions,
April 2007, available at: https://www.iosco.org/library/pubdocs/pdf/IOSCOPD243.pdf.

5
IFRS Financial Statement Disclosures – Debt
IFRS Financial Statement Disclosures - Equity
Balance of total long-term and short-term debt
outstanding at the end of each year there is a statement
of position presented as part of the financial statements.
Balance of total share and share capital outstanding by
class at the end of each year there is a statement of
position presented as part of the financial statements.
Changes in the amount of debt outstanding during the
year, noting issuances, payments, changes in fair value,
and other changes.
Changes in the amount of share and share capital
outstanding during the year by class of share, noting
issuances, redemptions, and other changes.
Details of any stock split or reverse stock split during the
periods presented.
Earnings per share for all periods presented.
Total amount of interest expense incurred and paid
during each year presented.
Total amount of cash of stock dividends declared and
paid during each year presented.
Total fees and gains and losses incurred during the year.
Fees will be disclosed as a component of the changes in
share capital during the year.
Specific terms and provisions of the debt by class or
instrument whereby details such as convertibility, term
or due date, availability of unutilized lines of credit or
other credit commitments, interest rates and whether
they are fixed or variable, timing of required principal
and interest payments, and terms of the most restrictive
covenants.
Total number of shares authorized, issued and
outstanding and the respective par value for each class of
shares.
Specific rights, privileges, and restrictions of the
different share classes including a description of call and
convertibility provisions, prices and dates, dividend and
liquidity preferences, unusual voting rights, and other
unique provisions for each class of shares.
If a right of set-off exists related to the debt, the details
of such arrangement, and the gross amounts of items set-
off.
Balances of treasury stock outstanding, including
number of shares, and related activity during the periods
presented.
Collateral pledged or held by the lender as security for
the debt.
Whether the debt has any embedded derivatives,
whether such derivatives have been bifurcated, and, if
so, how and why.
Details of any guarantees of debt by third parties.
Whether any defaults of debt or covenant violations
exist at year end or have occurred during the year and if
they have been cured, how and when.
The fair value of outstanding debt and whether or not it
is carried at fair value. If so, the methodology for
computing fair value. A discussion regarding the effects
of credit and market risk on the fair value and carrying
value of debt.
6
IV. Auditor Assurance
An audit firm’s engagement to audit a set of issuer financial statements is geared toward
expressing its opinion on whether the financial statements taken as a whole are presented in all
material respects in accordance with the applicable accounting framework, such as national
accounting standards or IFRS. Correspondingly, the audit firm’s engagement is not geared
toward expressing its opinion on any individual element of the issuer’s financial statements, such
as the amount of its reported debt or equity.
In light of this overall objective, auditing standards generally call for the audit firm to plan and
conduct its work on the various aspects of a company’s financial statements (such as its
outstanding debt and equity) in accordance with the risks that the item could result in a potential
material misstatement of the company’s financial statements taken as a whole. In this sense the
standards do not distinguish between auditing the financial statements of issuers financed largely
with debt versus those financed largely with equity. To illustrate, consider International
Auditing Standards (ISAs). IOSCO understands that the ISAs that would generally apply and
encompass the audit risks presented by either an issuer’s outstanding debt or equity include:
• ISA 315, Identifying and Assessing the Risks of Material Misstatement through
Understanding the Entity and Its Environment, and ISA 330, The Auditor’s
Responses to Assessed Risks, which deal with identifying and assessing risks of
material misstatement and responding to those risks.
• ISA 500, Audit Evidence, which explains what constitutes audit evidence and
deals with the auditor’s responsibility to design and perform audit procedures to
obtain sufficient appropriate audit evidence to be able to draw reasonable
conclusions on which to base the auditor’s opinion.
• ISA 505, External Confirmations, which deals with the auditor’s use of external
confirmation procedures to obtain audit evidence in accordance with the
requirements of ISA 330, The Auditor’s Responses to Assessed Risks, and ISA
500.
• ISA 520, Analytical Procedures, which deals with the auditor’s use of analytical
procedures as substantive procedures and also the auditor’s responsibility to
perform analytical procedures near the end of the audit that assist the auditor
when forming an overall conclusion on the financial statements.
• ISA 540, Auditing Accounting Estimates, Including Fair Value Accounting
Estimates, and Related Disclosures, which deals with the auditor’s
responsibilities relating to auditing accounting estimates, including accounting
estimates related to financial instruments measured at fair value.

7
In addition, International Auditing Practice Note 1000, Special Considerations in Auditing
Financial Instruments, provides advisory guidance regarding audits of financial instruments,
which includes a company’s debt financing.
The ISAs do not specify an auditor’s responsibilities, if any, with respect to the information that
is contained in an issuer’s offering or listing document but placed outside of the audited financial
statements, their associated footnotes, and the auditor’s report thereon. There may be national
laws and regulations that address these auditor responsibilities, if any. ISAs do, however,
address the auditor’s involvement with financial and non-financial information (other than
financial statements and the auditor’s report thereon) that is contained within the issuer’s annual
report. Specifically, International Auditing Standard 720 (Revised), The Auditor’s
Responsibilities Relating to Other Information, (ISA 720) requires the auditor to read the
information that is outside of the issuer’s financial statements and:
• Consider whether there is a material inconsistency between this information and
the financial statements; and
• Consider whether there is a material inconsistency between this information and
the auditor’s knowledge obtained in the audit, in the context of audit evidence
obtained and conclusions reached in the audit.
9
As the basis for making these considerations, the auditor is required to compare selected amounts
or other items in the information outside of the financial statements with such amounts or other
items within the financial statements. The auditor is also required, while reading the information
outside of the financial statements, to remain alert for indications that such information appears
to be materially misstated based on the auditor’s knowledge obtained through their audit
procedures applied in auditing the financial statements. These provisions do not distinguish
between situations in which the issuer is financed with debt versus with equity.
Madrid, Spain.
6 May 2015.
9
For additional information about ISA 720, see http://www2.ifac.org/publications-resources/international-standard-
auditing-isa-720-revised-auditor-s-responsibilities--0.

Secretariats 11 September 2014
Summary: Joint CGFS – FSB-SCAV workshop on
risks from currency mismatches and leverage on
corporate balance sheets
Hong Kong Monetary Authority (HKMA); Hong Kong SAR; Friday 20 June 2014
Outline
On 20 June 2014, the CGFS and FSB-SCAV co-organised a workshop with public and
private sector participants at the Hong Kong Monetary Authority to gather views on
current trends affecting corporate balance sheets in emerging market economies
(EMEs).
1
Its main aim was to help CGFS and SCAV members develop a common
understanding of the analytical needs for the assessment of related vulnerabilities.
Specifically, the objectives were to: (1) explore the channels through which
corporate balance sheets can pose financial stability risks; (2) provide an initial
assessment of current vulnerabilities (based on the available data, eg using country
case studies or similar analyses); and (3) gather ideas for ways to address data gaps,
including enhanced disclosures, stress tests and other data-gathering efforts.
The workshop was organised in three sessions, followed by a final discussion to
summarise the key observations. The first two sessions featured case studies
(supplied by Brazil, China, India, Mexico, Turkey as well as the IMF), focusing on
experiences gained with monitoring corporate balance sheet risks in individual
jurisdictions. The third session involved private sector participants from both the
buy and sell side of the market (such as credit and rating agency analysts, corporate
bankers, asset managers and accountants, mostly covering the Asian region),
providing a broader perspective. The discussions during the various sessions are
summarised below; the last section reports the key findings and possible follow-up
options identified during the final workshop session.
Summary of discussion
Case study sessions
All six case studies highlighted that borrowing by non-financial EME corporates
(NFCs) is on the rise, both domestically and from foreign sources. Issuers generally
benefited from a deepening of domestic financial markets, while channels for
foreign funding differed across jurisdictions. In some countries, such as Mexico,
corporates increasingly resorted to direct issuance of foreign debt. In other
jurisdictions, where corporates do not have direct access to external bond markets
(either due to prohibitive costs or regulation), foreign borrowing of NFCs is
1
The workshop was co-chaired by Eddie Yue (HKMA) and Ismail Momoniat (South African Treasury).
1/9
PLEN/2015/47 ANNEX E.1
intermediated mostly by banks. This is, for instance, the case in Turkey. In yet other
jurisdictions, such as Brazil, China and India, corporates often draw on foreign bond
market funds through offshore subsidiaries and special purpose vehicles.
Assessing broad trends. The average level of NFC debt in major EMEs is
estimated at about half of GDP, with significant variation across jurisdictions. While
this compares favourably with the levels observed in many advanced economies,
growth rates are high and many borrowers have recently accessed bond markets for
the first time. Several workshop participants pointed to record issuance of new
corporate debt in their jurisdictions and, in some cases such as Turkey, to sizeable
shares of corporate liabilities denominated in foreign currencies. Participants
generally agreed that the combination of low yields in international debt markets
with strong demand from international investors was the main driver behind the
recent rapid growth in corporate borrowing, particularly in terms of foreign currency
debt. For Mexican corporates, for example, the cost advantage relative to issuing
domestic debt is apparently significant even when currency swap spreads are taken
into account.
There was general agreement that an assessment of current trends using
aggregate, macroeconomic data would tend to understate risks. For example,
credit-to-GDP ratios are not particularly elevated for most EMEs, ratios of short-
term to long-term debt seem relatively stable, and country fundamentals are
often healthy, suggesting that risks at the aggregate level are limited. Yet,
aggregate data can often mask risks accumulating at the sectoral level and are
subject to known biases (eg due to their reliance on the residency principle; see
below), necessitating the use of more granular data in coming to an overall
assessment.
Therefore, most case studies focused on risk assessments using firm-level data
combining different risk metrics (eg debt to GDP, debt-to-EBITDA, share of foreign
currency liabilities, debt maturity structure), often supplementing basic statistics
with scenario analyses of interest rate and foreign exchange risks.
Leverage-related risks. Higher indebtedness can raise rollover risks, debt
service burdens, and balance sheet sensitivity to interest rate changes. Even though
the recent increase in borrowings has meant that upcoming maturities have
significantly increased in select jurisdictions, representatives broadly judged rollover
risks to be limited at the current juncture. In many cases, the maturity of corporate
liabilities has been lengthening, and the share of long-term debt is growing faster
relative to earnings than that of short-term debt. Still, some parts of the corporate
sector continue to have shorter-dated liability profiles, which may expose them to
risks once the current funding environment changes. Longer debt maturities, in turn,
translate into higher duration risks for investors, which were mentioned as a potent
amplification mechanism in case of shocks.
There was greater degree of disagreement concerning corporate debt service
ratios and exposure to interest rate risk. While, despite fast debt growth, risk
assessments within a number of individual jurisdictions pointed at stable debt
service ratios, one case study cited evidence that the debt service ratios of many
EMEs have been deteriorating, judging by the rising net debt-to-EBITDA ratios.
Similarly, while several representatives judged interest rate risk facing corporates in
their jurisdictions as limited (referring, eg, to fixed rate coupons for the majority of
outstanding foreign bonds), cross-country comparisons suggest that net interest
2/9

rate expenses have broadly gone up, despite the current low interest rate
environment (Graph 1, left-hand and centre panels).
In general, the risks associated with corporate leverage were judged to be
greater when the assessment relied on firm-level data, taking the distribution of
losses and, hence, sectoral differences or other relevant dimensions into account.
This is in line with broader evidence, suggesting that leverage may be concentrated
in particular sectors (eg the more cyclical ones) and in the weaker part of the
corporate spectrum (Graph 1, right-hand panel). Such concentrations can be an
issue particularly in those sectors where corporate profitability may have peaked or
which have been experiencing a sustained run-up in prices (eg real estate).
Leverage, interest rate expenses
and distribution of debt at risk
Cross
-country comparison Graph
1
Net debt
-to-EBITDA ratio
Growth rates (yoy) of interest
expenses
Distribution of debt
-at-risk by ICR
1
Ratio
Per cent
Per cent of total debt
1
As a share of total debt; ICR = interest coverage ratio. The red dots indicate (as a share of total debt) the debt held by firms with ICR <
2 if
interest service costs where to rise by 25%
.
Source: IMF.
Currency mismatches. Workshop participants were less concerned about
exchange rate risk, at least when taken in isolation. The development of local
currency bond markets, particularly in Asia, reduces the need for foreign currency
borrowing for many companies. Furthermore, while both domestically and
internationally financed leverage seem to have risen (Graph 2, left-hand panel), in
many jurisdictions foreign currency borrowing appears to be done in large part by
firms from sectors with natural hedges (see, eg, Graph 2 centre and right-hand
panels). In some cases, these appear to be supplemented with financial hedges,
even though firm-level data on the use of these hedges are scarce (see below).
Some of the relatively benign country views on foreign exchange risks were
corroborated by scenario analyses based on firm-level data. For example, using
balance sheet information for listed companies, several countries reported analyses
of projected losses (as a percentage of EBITDA or total equity) due to a given large-
scale currency depreciation under alternative assumptions about natural and
financial hedging ratios. A key result from these analyses is that the shocks needed
3/9

to generate significant projected losses appear to be relatively large.
2
Still, the
impact of correlated shocks, such as the joint effect of interest rate changes and,
exchange rate volatility, coupled with disruptions in bond market access, are more
difficult to analyse, which may bias the results.
Overall, subject to data availability issues, country authorities typically found
truly unhedged corporates to be a small part of their corporate universe (ie in terms
of total corporate debt). Even so, they noted signs that unhedged borrowing is
clustered in particular sectors, which may raise concentration concerns.
3
Leverage of co
rporates active in international capital markets and distribution of
borrowers by sector in selected
economies
Graph
2
Leverage of publicly listed
firms in
Mexico
Sectoral distribution of unhedged FX
debt in Brazil
Sectoral composition of high
-risk
firm
s in Turkey
1
Ratio of total assets to equity
In per cent
Number of firms
1
Firms that are categorised as having relatively low exports/high FX liabilities; size of FX revenues will differ according to sectors.
Source: Central Bank of Mexico;
Central bank of Brazil; Central Bank of Turkey.
Sectoral interactions. Interactions between the corporate and other sectors of
the economy received relatively little coverage during the discussions, in part
because related risks are very difficult to analyse with the available data. Participants
noted, however, that the degree of bank involvement in both domestic and external
financing of EME NFCs remained large across jurisdictions. Domestic as well as
foreign banks and their subsidiaries also remain key counterparties to EME
corporates in derivatives markets, with some local banks depending on corporate
deposits for part of their funding. Standard metrics suggest that EME banks tend to
have relatively good loss-absorbing buffers, which may explain why workshop
participants assessed the risks for their respective banking sectors to be rather
contained. There was agreement, however, that weaker borrowers tend to interact
with weaker banks, pointing to potential vulnerabilities at individual institutions.
2
For example, a scenario analysis of Indonesian corporates estimated that only nine out of 85
assessed firms would face solvency issues if the rupiah was to depreciate by 41%.
3
In response, jurisdictions, such as India, have tightened their regulatory requirements on bank
lending to unhedged corporate borrowers.
4/9

Finally, it was acknowledged that bond market financing has grown in size across
EMEs, raising the importance of asset managers and other institutional investors in
the transmission of shocks as well as related spillover risks.
Data availability. Workshop participants agreed that granular data on financial
statements for listed corporates were generally available from a variety of
commercial sources as well as public disclosures. Data gaps, therefore, affect
predominantly unlisted firms, even though inconsistencies across data sources and
a lack of standardisation in public disclosures can complicate analysis even for listed
firms. Several participants pointed out that, although listed companies represent
only a fraction of the firms in their jurisdictions, their share in cross-border business
and foreign funding markets tends to be large.
4
Yet, this does not exclude the
possibility that the listed universe may represent only a very small share of
estimated total domestic and international debt in some country cases.
In addition to public sources, some jurisdictions were able to obtain granular
balance sheet information on NFCs from their own reporting systems (eg through
the supervisory reporting of their banks), including for part of the unlisted sector.
For example, the Central Bank of Turkey presented results based on corporate
balance sheet data for more than 9,400 firms. However, some workshop participants
noted that collection of NFC data can raise serious legal issues for central banks, as
it may be outside their existing data-gathering mandates. Several participants also
indicated that in their jurisdictions central banks would face restrictions on the
scope of data collection as well as confidentiality issues; therefore, some form of
collaboration with national statistical authorities or other agencies would be
necessary to gather more granular data in practice.
Data availability is more problematic in the area of derivatives-related
information, as public disclosures on hedging practices and the use of derivatives
are not standardised, and therefore cannot be turned into quantifiable metrics for
financial stability assessment purposes. Even so, individual jurisdictions have
managed to generate useful information at the aggregate (ie via surveys) or micro
levels (ie from derivatives exchanges). For example, the Reserve Bank of Australia
(RBA) collaborates with the national statistical authorities to augment their quarterly
balance of payments data collection (every four years) with quantitative questions
on the foreign currency exposures and derivatives positions of financial and non-
financial institutions. Based on the survey results, the RBA is able to monitor the
aggregate currency composition of the country’s external position and banks’
hedging of foreign currency debt liabilities. However, several shortcomings of this
approach were also discussed. These include a lack of consolidated information,
because the data are collected on a residency basis, and restrictions on the use of
the granular, firm-level survey responses (for confidentiality reasons).
Examples of jurisdictions with access to micro-level data through derivatives
exchanges or dealer networks include Brazil and South Africa.
5
In Brazil, two clearing
houses handle derivatives transactions and provide derivatives registry services,
4
For example, while publicly listed firms in Turkey represented only about 3% of the number of firms
for which the central bank has granular data, they accounted for about half of all assets and export
volume. Similarly, listed firms in Mexico reportedly accounted for approximately 90% of
international bond issuance by Mexican non-financials during the 2009–13 period.
5
Some jurisdictions also pointed out that data which used to be gathered for capital control
purposes could also be useful to monitor corporate balance sheets; hence it may be worthwhile to
keep such data collections in place even after the controls have been relaxed or dismantled.
5/9

which allow banks to collect information on the derivatives exposures of their
clients. One shortcoming of the Brazilian registry is that data on offshore derivatives
activity (ie derivatives with non-resident banks) are not or, at best, are only partially
covered.
Overall, it was apparent that information from a variety sources can typically be
combined to allow for basic sensitivity analyses, including those of interest or
exchange rate shocks. Yet, participants also pointed to consistency issues across
data sources, highlighting that data validation can be a challenge. In addition, a
recurring theme was that aggregate data often suffer from residency bias in that
they fail to capture the activities of offshore vehicles and subsidiaries.
Roundtable discussion
The views of market practitioners during the roundtable discussion broadly
supported those from the country case studies. Overall, participants agreed that
EME corporate leverage was growing to varying degrees across jurisdictions in Asia
(just as in other regions). There was also agreement that borrowing had taken place
predominantly in domestic currencies. Thus, interest rate and rollover risks were
seen as the more relevant issues for EME corporates, with currency mismatch
regarded as a lesser concern. In terms of outstanding currency exposures, while
market practitioners acknowledged that shallow hedging markets tend to make
financial hedges less attractive (as they will tend to eat up any foreign currency
funding advantage), they also suggested that issuers typically have natural hedges
in place, which would seem to mitigate any foreign exchange risk.
As already highlighted during the earlier sessions, market practitioners also
acknowledged the importance of sectoral differences and the existence of “pockets
of risk”, such as in property-related sectors and with regard to the use of derivatives.
Overall, therefore, they felt that growing leverage as well as maturity and currency
mismatches may cause EME corporates to be increasingly vulnerable to sharp (and
correlated) adjustments in interest rates and exchange rates. The exact size and
repercussions of these effects, however, remained hard to assess.
In terms of data availability, private sector participants underscored the lack of
granular data, particularly for unlisted firms, and how this affects their ability to
assess the full array of firms’ currency risks (unless a direct client relationship is in
place). They also highlighted that national balance of payments data do not
typically enable the identification of debt raised offshore, and that such offshore
borrowing is important in jurisdictions such as Brazil, China, Russia, and Turkey.
6
Corporate leverage. Market practitioners highlighted the significant growth in
Asian corporate debt since the global financial crisis, spurred by very low interest
rates and generally positive, though moderating, economic growth. While local
currency debt markets have deepened in Asia, dollar-denominated borrowing has
also increased, reflecting lower funding costs than in local markets and, in some
jurisdictions, an expectation of currency appreciation on the part of corporate
issuers (see below).
In terms of overall leverage trends, analysts noted that EME corporate leverage
was on the rise in terms of a variety of balance sheet and income statement metrics
6
In addition, in making sectoral assessments, debt issued by SPVs and similar entities may have to
be reclassified according to the sector of the ultimate issuer to avoid the associated leverage risk to
be allocated to the non-bank financial sector.
6/9
(eg debt-to-assets, debt-to-equity, debt-to-earnings, and interest coverage ratios)
as well as in broad economic terms (debt-to-GDP). However, in most jurisdictions,
corporate leverage metrics remain below those of advanced economies, even
though there are signs of weakness at the sectoral level (eg in Brazil, China, India
and Indonesia). For example, the growing leverage of part of the Chinese corporate
sector, in particular property developers, was mentioned by several workshop
participants. It was noted that the lack of foreign currency revenues and the
absence of hedging may leave such agents with large currency mismatches, while
short maturities and less reliable sources of funding (eg via the shadow banking
sector) may increase their vulnerability to rollover risks. Such risks would be highest
for unlisted and unrated property developers that provide little financial
information, do not have sophisticated risk management and suffer from
concentration risk on property markets of third- or fourth-tier cities. (Yet, private
sector participants also highlighted that they perceived high levels of foreign
exchange reserves as an ultimate backstop for corporate sector risks at the
aggregate level).
Instrument choice, in turn, has become more selective, amid signs that deal
structures may be getting riskier. Hybrid equity/debt products (such as perpetuals),
for example, are used to more actively manage leverage metrics, which may conceal
the true extent of leverage in some sectors. At the same time, weaker loan
covenants appear to be proliferating at a time when the sheer volume of issuance
may be starting to stretch the due diligence capabilities of even the larger
institutional investors. In this context, analysts highlighted the emergence of
structures utilising “keep-well agreements” from the parent company to reassure
holders of the structurally subordinated debt issued by offshore subsidiaries; such
commitments remain essentially untested, as bankruptcy cases are rare. In addition,
there was mention of guarantees or stand-by letters of credit provided by domestic
banks to facilitate offshore borrowing through subsidiaries or special purpose
vehicles.
Currency mismatches and hedging. Private sector participants generally
suggested that they were less concerned over currency mismatches relative to
leverage, while acknowledging that, at the firm level, they often had only limited
information on actual currency exposures, terms of hedging, and counterparties.
Still, overall, the more active foreign currency borrowers appeared to come from
sectors generating foreign currency revenues (providing natural hedges), such as
exporters and commodities firms. An exception is property-related sectors, where
revenues are typically in local currency.
However, workshop participants also noted that shallow hedging markets and
associated hedging costs as well as complicated hedge accounting rules can reduce
corporates’ inclination to hedge. They also highlighted the role of currency regimes
in setting borrowing incentives and noted that capital controls can raise the
attractiveness of unhedged foreign currency funding (including for speculative
purposes) for those corporates that are able to issue internationally (eg through
offshore vehicles). In this context, recent cases of over-invoicing in Chinese trade
finance markets were seen as evidence for speculative, carry trade-type corporate
activities. There was also some disagreement over how far Asian corporates are
7/9

using the more exotic, structured hedging instruments (such as KIKO products),
7
which have led to financial stability concerns in the past.
Data challenges. Market participants highlighted two key challenges with
regard to data availability. The primary data gap arises from the significant lack of
information on leverage and currency hedging of unlisted corporates. A second
data challenge is the qualitative nature and inconsistency of public company
disclosures of currency risks and hedging. While commercially available information
was the primary source used to assess such risks, data on the nature and
comprehensiveness of actual hedges were lacking. In Asia, for example, hedge
accounting as such is not yet commonly adopted because corporates reportedly
find the relevant rules complex and difficult to apply. However, the expected
issuance of the new accounting standards on financial instruments by the end of
2014 should make it easier to apply hedge accounting and hence may help
promote a wider adoption of hedge accounting and related disclosures in the
region. More broadly, for the majority of corporates that have not adopted IFRS,
hedging disclosure is generally weak. Any enhanced reporting, therefore, would
need to include more detail on types and maturities of derivatives, counterparties,
and the extent to which hedging aims to mitigate currency (and interest rate) risks.
Key messages
The key messages from the workshop can be summarised as follows:
Current assessment
• Rising leverage. Participants generally agreed that EME corporate leverage was
on the rise, both through bank borrowing and debt issuance. Based on the
available data, leverage (and associated interest rate and rollover risks) were
assessed to be a more important issue than currency mismatches. Overall, EME
authorities seemed to be largely aware of the relevant risks and had stepped up
their monitoring activities, albeit to varying degrees in different countries.
• Pockets of risk. While the overall assessment was relatively benign,
participants also acknowledged that this view may change if present trends
toward increased leverage were to continue. They also noted that aggregate
data can understate risks in particular sectors or at individual corporates. For
example, firm-level data showed that, in some jurisdictions, growth in foreign
currency borrowing has been concentrated among risker firms and sectors,
including property developers in countries such as China. Such “pockets of risk”
put a premium on more granular analysis, but detailed data (eg from income
statements) are often unavailable, particularly for non-listed firms.
• Amplification effects. In addition, while the recent increase in the maturity of
corporate external liabilities was seen as a mitigant for rollover risks, there was
less discussion concerning the flip-side implications for duration risk and the
associated amplification effects from the behaviour of buy side investors. In this
context, the recent shift in the composition of external funding from banks to
7
“Knock-in-knock-out” (KIKO) contracts use option features to insure their users against modest
exchange rate movements, while exposing them to potentially large losses if the local currency
depreciates sharply – a feature that reduces hedging expenses at the cost of retaining the tail risk
of stronger currency depreciations.
8/9

bond market sources may have shifted duration risk to institutional investors,
which may result in greater bond market volatility and amplify market reactions
to any disruptions.
Data availability and gaps
• Data availability. There was agreement that granular data on corporate
financial statements are available from a variety of sources, including
commercial vendors. In addition, in some jurisdictions, balance sheet data can
be obtained from countries’ own reporting systems (eg banks’ supervisory
reporting), at least for listed firms. Combined with information from other
sources, such information allows for basic sensitivity analysis, including that of
interest or exchange rate shocks. Consistency across data sources, however,
remains an issue, implying that data validation can be a challenge and that
simplifying assumptions may be needed to cover for missing information.
• Derivatives positions. Data gaps were identified mainly in two areas. The first
is corporate hedging activities and other derivatives-related positions. Three
different approaches were suggested to improve data availability. The first
would be enhanced disclosures of financial hedges via improved accounting
standards (eg providing detailed currency and maturity information on financial
hedges and their undelying positions, including those not qualifying for hedge
accounting). The second approach would follow the Australian example and
collect information on corporate hedges in the context of existing BOP data
surveys, leveraging the existing statistical infrastructure and legal reporting
requirements in this area (possibly based on a common template across
countries). The third response, in turn, would follow the Brazilian example and
seek to obtain information on outstanding derivatives positions directly from
trade repositories and central counterparties (possibly also on a cross-border
basis to capture off-shore derivative activities).
8
• Non-listed firms. The second data gap is financial statements for non-listed
companies. While some countries do have information on non-listed firms and
standard databases tend to cover the sector at least to some extent (ie those
companies that issue debt in public markets even though they are not listed on
the stock market), coverage is much less complete than for larger, listed
companies. Workshop participants proposed a variety of measures that could
be taken to alleviate this problem. One is country-level surveys of consolidated
corporate balance sheet positions, focusing specifically on the sectoral,
currency and maturity breakdowns of external debt.
9
In addition, given that
unlisted firms are more likely than their listed peers to depend on bank
financing, information obtained through banks (eg through supervisory
channels) may be a viable way forward for some jurisdictions.
8
International workstreams exist in all three of these areas, suggesting that any follow-up work could
possibly be addressed via BOPCOM (BOP surveys), standard setters such as IOSCO (enhanced
disclosures), and the FSB AFSG initiative (options for aggregating trade repository data).
9
Such surveys would be implemented at the national level, but could benefit from international
coordination (eg via the G20 data gaps initiative) to improve the consistency and comparability of
the reporting templates.
9/9
BIS Quarterly Review, September 2014
35
Risks related to EME corporate balance sheets: the
role of leverage and currency mismatch
1
Corporates in many EMEs have taken advantage of unusually easy global financial conditions
to ramp up their overseas borrowing and leverage. This could expose them to increased interest
rate and currency risks unless these positions are adequately hedged. The key question is
whether EME corporate balance sheets have become more susceptible to shocks. Greater
corporate exposures could, in turn, spill over into vulnerabilities for both local banks and the
financial system more broadly. Shocks to interest or exchange rates could generate damaging
feedback loops if credit risk concerns were to prevent existing bank or bond market funding
from being rolled over.
JEL classification: D21, F31, G32.
Very low yields in advanced countries post-crisis have triggered huge investment
flows into emerging market economies (EMEs), thanks to their brighter growth
prospects. While these capital inflows have brought economic benefits, they could
make EMEs more vulnerable to external shocks if unchecked surges in credit and
asset prices were to raise the spectre of renewed boom-bust cycles (BIS (2014),
Chapter IV). Events in May 2013 and early 2014, for example, suggest that large
cross-border capital movements could cause considerable volatility in EME asset
prices and exchange rates, with implications for growth and financial stability (see
eg Avdjiev and Takáts (2014)).
In this environment, the financial exposures of EME non-financial corporations,
in particular, could have wider implications. Debt issuance in foreign currencies
exposes these borrowers to rollover and foreign currency risks. If such risks
materialise, the creditworthiness of some corporations could worsen, pushing up
bond yields. Higher financing costs and tighter funding conditions for firms could
then become a drag on economic growth. Higher bond yields would also inflict
losses on holders of EME corporate debt, which include local banks and other
investors, such as global asset managers. Balance sheet pressure on corporations
could also subject banks and other intermediaries to funding stresses, as firms are
forced to withdraw their deposits. All in all, such developments could generate
1
The views expressed in this article are those of the authors and do not necessarily reflect those of
the BIS or the CGFS. We are grateful to Claudio Borio, Dietrich Domanski, Mathias Drehmann,
Masazumi Hattori, Ulf Lewrick, Hyun Song Shin, Philip Turner, Christian Upper and the participants
of the Joint CGFS – FSB-SCAV workshop in Hong Kong SAR on risks from currency mismatches and
leverage on corporate balance sheets for useful comments and discussions, and we thank Branimir
Gruić, Mario Morelli and Jhuvesh Sobrun for their expert research assistance.
Michael Chui
michael.chui@bis.org
Ingo Fender
Vladyslav Sushko
PLEN/2015/47 ANNEX E.2

36 BIS Quarterly Review, September 2014
powerful feedback loops in response to exchange rate shocks if credit risk concerns
mean that existing bank or bond market funding is not rolled over.
Against this background, this article examines the risks related to EME
corporate balance sheets and their possible implications for the broader financial
system. To set the scene, the first section below reviews recent patterns in corporate
non-financial sector borrowing and the rising importance of cross-border financing
flows for EME corporates. On this basis, the second section then asks whether
corporate balance sheets have become more vulnerable. The third section discusses
the possible financial stability implications, followed by a short conclusion.
Recent patterns in corporate non-financial sector borrowing
In recent years, EME non-financial corporations have seen growing incentives and
opportunities to increase leverage, by borrowing in both foreign and domestic
currencies. The drivers include low interest rates and compressed term premia,
broad appreciation trends underpinning key emerging market currencies post-crisis,
and better access for EME borrowers to international markets.
2
Developments in cross-border credit are particularly noteworthy. Although
bank claims still account for the largest share of outstanding cross-border credit for
2
In this article, unless otherwise stated, the term “EME” is to be read as referring to the following 21
major emerging market economies: Argentina, Brazil, Chile, China, Chinese Taipei, Colombia, the
Czech Republic, Hungary, India, Indonesia, Korea, Malaysia, Mexico, Peru, the Philippines, Poland,
Russia, Turkey, South Africa, Thailand and Venezuela. Note that Hong Kong SAR and Singapore are
excluded from this group of EMEs, as many corporates headquartered in developed and other
emerging countries have raised funds there, which could blur the analysis of debt issuance by
residence and nationality in our study.
EME private cross-border bank borrowing and international debt issuance
1
In billions of US dollars Graph 1
Outstanding amounts Annual changes Issuance of international debt
securities
1
Private non-bank sector. Cross-border bank borrowing (by residence) also includes claims on the household sector and claims on
portfolio debt investment (implying a degree of double-counting), while international debt issuance (by nationality) includes securities
issued by non-bank financials and non-financial corporations; and these securities could be denominated in local or foreign currency.
Source: BIS consolidated banking statistics and international debt securities statistics.
0
30
0
60
0
90
0
1,20
0
04 06 08 10 12 14
International debt securities
Cross-border bank borrowing
0
50
100
150
200
05 06 07 08 09 10 11 12 13
International debt issuance
Cross-border bank borrowing
0
80
160
240
320
2005–08 2009–12
By residence
By nationality

BIS Quarterly Review, September 2014
37
the private non-bank sector (Graph 1, left-hand panel), a key feature of the past few
years has been the strong growth of international debt issuance by non-financial
sector corporates (Graph 1, centre panel). This stands in contrast to the pre-crisis
period (see eg Shin (2013)).
In aggregate, a significant part of the international debt of these EME
corporates is issued through their overseas subsidiaries (Graph 1, right-hand panel).
Issuance data based on issuer nationality (including issuance by the overseas
subsidiaries of the corporations headquartered in a given country) indicate that
private sector borrowers (other than banks) in major EMEs issued international debt
securities worth almost $375 billion in 2009–12, more than double their issuance in
the four-year period prior to the crisis.
3
Issuance in 2013 was also strong, even
though there were signs late in the year that global bank claims were recovering
too.
The scale and overall importance of recent developments in EME corporate and
wider private sector financing are also apparent from broader indicators of external
financing, such as international investment positions (IIPs). Many EMEs have seen
their net external positions shift considerably since 2008 (Graph 2, left-hand panel).
Comparison of the private sector contributions (Graph 2 right-hand panel) with
country-level IIP changes reveals that the observed decline in net IIP balances was
primarily driven by rising private sector liabilities (including those of corporates),
whereas official sector balances have been stable or rising. Note, however, that IIP
3
The issuer by nationality concept is similar to the consolidated claims concept in the BIS
international banking statistics. It is especially important in the case of EMEs such as Brazil and
China where local corporates have increased their issuance of international debt via overseas
subsidiaries – including non-bank financing vehicles. By contrast, the issuer by residence concept
does not include issuance by these overseas subsidiaries, but it does include international debt
issues by other nations’ subsidiaries residing in the respective country.
Changes in net international investment positions
Between end-2008 and end-2012, in billions of US dollars Graph 2
Country-level Private sector only
1
AR = Argentina; BR = Brazil; CL = Chile; CN = China; CO = Colombia; CZ = Czech Republic; HU = Hungary; ID = Indonesia; IN = India;
KR = Korea; MX = Mexico; MY = Malaysia; PE = Peru; PH = Philippines; PL = Poland; RU = Russia; TH = Thailand; TR = Turkey;
VE = Venezuela; ZA = South Africa.
1
Derived by excluding all official sector (government and central bank) components from the total net international investment position.
Source: IMF, Balance of Payments Statistics.
–800
–600
–400
–200
0
20
0
B
RTR ID INMXRUPLTHKRCOMYCZPECLARZAPHVEHUCN
↓ deterioration
Debtor country Creditor country
–800
–600
–400
–200
0
200
BR TR ID IN MXRU PL TH KRCOMYCZ PE CL AR ZA PH VEHUCN
↓ deterioration
–$1.2bn →
Debtor country Creditor country
38 BIS Quarterly Review, September 2014
data are derived from residence-based statistics and usually do not include the
gross positions of overseas subsidiaries; nor do they cover domestic positions.
4
Potential risks to the corporate sector
A key question is whether these developments have made EME corporates more
vulnerable – for example, to the combined effects of a slowdown in the domestic
economy, currency depreciation and rising interest rates globally. Such risks are
accentuated when leverage starts to loom too large relative to borrowers’ debt
servicing capacity or when foreign currency assets or revenues are insufficient to
match large foreign currency liabilities. Rising interest rates and depreciating
exchange rates will tend to raise the cost of servicing these debts, denting profits or
depleting capital cushions, unless appropriate hedges are in place.
Unfortunately, data limitations mean that such vulnerabilities are notoriously
hard to assess, especially in a cross-country context. For many EMEs, the lack of
financial accounts data at the national level means that internationally comparable
measures of corporate sector leverage are difficult to obtain. In what follows,
selected metrics are used to provide at least a partial picture.
Corporate leverage
Various measures point to rising leverage on corporate balance sheets. One such
indicator is the debt/earnings ratio as disclosed by individual firms. A recent study,
based on a sample of non-financial corporations from seven large EMEs, suggests a
more or less steady increase in corporate leverage over the last few years (Graph 3,
left-hand panel).
5
Country-level data (based on residence) on corporate debt-to-
GDP ratios appear to confirm this trend, while providing a perspective on broad
leverage levels across jurisdictions. According to this metric, corporate indebtedness
now hovers at around 100% of GDP for some EMEs (Graph 3, centre panel). Yet,
despite recent trend growth, levels vary considerably between countries and remain
modest by international standards.
Borrowing patterns have differed across countries in recent years. While
developments in some economies (eg for corporates in Latin America) appear to
reflect a more general shift from primarily domestic to more internationally
diversified funding sources (Powell (2014)), in others domestic debt rose in tandem
with external borrowing. For example, Chinese corporates (especially property
developers) now appear to be quite highly leveraged, at least in comparison with
their EME peers, and may find it challenging to manage these debt levels in an
environment of slowing growth and tightening profit margins (Bank of America
Merrill Lynch (2014)).
4
Over the past few decades, many Chinese companies have opted for a listing in overseas stock
markets (Hong Kong SAR in particular) to raise capital and hone their corporate governance. As of
end-June 2014, nearly 300 Chinese-owned or affiliated companies were listed on the main board of
the Hong Kong stock exchange with an aggregate market capitalisation of $660 billion.
5
See Bank of America Merrill Lynch (2014). BIS (2014), Chapter VI, provides additional information
based on capitalisation ratios.

BIS Quarterly Review, September 2014
39
Debt/earnings ratios can also reveal how rising leverage may be affecting the
capacity of firms to service their debts. A recent analysis based on firm-level data
finds that corporate debt grew faster than earnings in one third of the sample
economies between 2008 and 2012.
6
For Brazil, China and India, the average firm
required 2.5 to three years of current annual gross earnings to repay its debt in
2012, compared with two to 2.8 years in 2008. In many cases, the deterioration in
debt servicing capacity reflects a combination of rising debt loads and slowing
earnings growth. Furthermore, despite broadly stable and low interest rates over the
past five years, many EMEs have encountered a sharp increase in interest expenses
because of the larger debt loads (Graph 3, right-hand panel).
Asset composition
The nature or quality of assets acquired using the newly borrowed funds may either
strengthen or weaken a firm’s resilience against external shocks. Evidence on the
use of newly raised corporate funds is mixed. On the one hand, there are signs that
capital expenditure (capex) has been on the rise. Analyst estimates suggest that the
average capex of EME corporates (which includes funds used to upgrade production
capacity and acquire physical assets) has increased by almost one third over the
past few years, based on a sample of 120 EME corporate issuers.
7
In this context,
the stronger earnings prospects associated with capital spending would tend to
offset at least part of the risks associated with rising leverage.
6
See IMF (2014), which compares median corporate debt loads with earnings across 18 EMEs to
gauge the corporate sector’s debt servicing capacity.
7
See Bank of America Merrill Lynch (2014).
EME corporate balance sheets: selected metrics
Graph 3
Leverage ratio of EME corporations
1
Corporate sector debt in 2013
2
Annual growth rates of interest
expenses
Ratio to earnings
% of GDP
Per cent
AR = Argentina; BR = Brazil; CL = Chile; CN = China; CO = Colombia; HU = Hungary; ID = Indonesia; IN = India; MX = Mexico;
MY = Malaysia; PE = Peru; PH = Philippines; PL = Poland; RU =Russia; TH = Thailand; TR = Turkey; ZA = South Africa.
1
Firm-level data from S&P Capital IQ for 900 companies in seven EMEs; simple average across countries; gross leverage = total
debt/earnings; net leverage = (total debt – cash)/earnings.
2
External debt includes liabilities from affiliates, direct investments and other
sources.
Sources: IMF, Global Financial Stability Report, April 2014; Morgan Stanley; BIS calculations.
0.
0
0.
6
1.
2
1.
8
2.
4
2009 2010 2011 2012 2013
Gross leverage Net leverage
0
25
50
75
100
AR
MX
PH
PE
ID
IN
BR
PL
TR
RU
ZA
TH
MY
HU
CN
Domestic bank debt
Domestic market debt
External debt
–40
–20
0
20
40
AR
BR
MY
CO
TH
ID
PH
IN
TR
CN
RU
MX
ZA
CL
PL
2012 Five-year average

40 BIS Quarterly Review, September 2014
On the other hand, due to low volatilities, Sharpe ratio-type risk-adjusted
return metrics (eg interest rate differentials adjusted for exchange rate volatility)
suggest that carry trade incentives are also strong (Graph 4, left-hand panel), which
may have tempted some corporate treasurers into more speculative activities.
One indicator of such activities may be corporate cash holdings, as measured
by the difference between gross and net leverage ratios, which have increased
markedly since 2009 (Graph 3, left-hand panel). Similarly, corporate bank deposits
have grown in a number of banking systems during this period (Graph 4, centre
panel). The fact that the trend has not abated more recently suggests that post-
crisis caution may not be the only reason why firms have increased their cash
holdings. This is in line with reports that corporates in some jurisdictions were
seeking to take advantage of international interest rate differentials by borrowing
overseas and depositing the proceeds in local banks, subscribing to money market
mutual funds or purchasing high-yielding wealth management products.
8
In Korea,
for example, deposits by private non-financial companies in trust companies and
their shares in investment funds rose by a respective 36% and 45% in the two years
to end-2013. In China, reports of over-invoicing by Chinese importers have
emerged, especially for metals and other high value-to-density articles (Graph 4,
right-hand panel). The low-cost funds raised through trade financing for these
imported articles are reportedly being used for both business investment and
Carry trade incentives, corporate deposits and over-invoicing
Graph 4
Carry-to-risk ratios
1
Corporate deposits China’s copper trade with top three
partners
2
Basis points
% of total deposits
USD bn
1
One-month interest rate differentials, adjusted for implied volatility of the respective currency pairs; base currency: US dollar.
2
Bilateral trade of copper and articles thereof (international code: HS74) between China and the world’s top three copper producers:
Australia, Chile and the United States; over-invoicing is defined as the difference between imports and corresponding bilateral
exports.
3
For corporate deposits, business deposits.
Sources: IMF, Balance of Payments Statistics; UN Comtrade database; Bank of America Merrill Lynch; Bloomberg; JPMorgan Chase; BIS
calculations.
8
According to official data, the total balance of banks’ wealth management products in China rose
from CNY 2.3 trillion in late 2009 to almost CNY 10 trillion in late 2013; see Financial Times (2014).
0
5
0
10
0
15
0
2009 2010 2011 2012 2013 2014
Brazilian real
Mexican peso
Indian rupee
Indonesian rupia
h
15
20
25
30
07 08 09 10 11 12 13 14
Korea Thailand
3
–1.2
0.0
1.2
2.4
–8
0
8
1
6
93 98 03 08 13
Implied over-invoicing
Lhs:
China’s reported imports
Partners’ reported exports
Rhs:
BIS Quarterly Review, September 2014
41
speculation.
9
Yet the overall scale of these activities is difficult to judge, and even
normal treasury operations could well lead to a substantial rise in local currency
deposits at the local banks (eg due to time-to-build and similar constraints).
Increased bond market financing
A related issue concerns the composition of funding sources and, in particular, the
rising share of bond market financing. As highlighted above, strong investor interest
has underpinned EME corporate bond markets in recent years. If investors were to
suffer a significant loss of appetite, issuing firms might face difficulty in rolling over
their outstanding debts, particularly if shifts in risk appetite coincide with a fall-off in
projected earnings.
Many of the recent EME corporate borrowers have gained access to the debt
markets, both domestic and international, for the first time. The willingness of
investors to let these issuers roll over their debt in adverse circumstances is thus
untested. BIS international debt securities data, which exclude domestic as well as
short-term issuance, suggest that the rollover needs of corporates from major EMEs
and their overseas subsidiaries will rise from around $90 billion in 2015 to a peak of
$130 billion in 2017–18 (Gruić et al (2014)).
10
Note that these figures may
underestimate the risk of a sudden retreat by global investors, who may also hold
the domestic debt of EME corporates. For some corporations, rising debt
repayments will be particularly taxing in an environment of US dollar strengthening
(see below) and slowing domestic activity. Also, while domestic banks continue to
be the dominant source of funding for EME corporates, their ability and willingness
to help refinance market debt may be limited, particularly if risk appetite is on the
wane.
Currency mismatch
Given the elevated levels of foreign currency borrowing, currency mismatches
represent another possible source of vulnerability. Recent developments in Ukraine
are a reminder of how abruptly debt sustainability metrics can deteriorate when (in
this case, geopolitical) risks undercut the exchange rate, thus inflating the local
currency value of foreign currency liabilities. This raises the question of how far the
foreign exchange risks of rising foreign currency liabilities at EME corporates are
either financially hedged or naturally matched by foreign currency asset returns and
revenues.
11
9
For example, the World Gold Council (2014) estimates that, by the end of 2013, “surplus” gold
linked to financial operations in the Chinese shadow banking system could have reached a nominal
value of nearly $40 billion. See also Goldman Sachs (2013) for a detailed exposition of the
mechanics involved in the copper “carry trade”.
10
International issuance, which is dominated by US dollar-denominated debt, makes up about one
fifth of total debt issuance, with domestic debt accounting for the remainder. Domestic debt will
add to interest rate and rollover risks, but does not usually incur a currency mismatch risk (as
covered in more detail below).
11
Data on country-level foreign currency exposures and on how far they are hedged are generally
unavailable. Australia is an exception in that the Australian Bureau of Statistics conducts a Foreign
Currency Exposure Survey to gauge the country’s net foreign asset position (ie after taking into
account the hedging of foreign currency exposures using financial derivatives) (see Rush et
42 BIS Quarterly Review, September 2014
In the absence of more specific information on natural hedges, issuer sectors
may serve as an important proxy indicator. Commodity producers and manufactures
exporters, for example, earn much of their revenues in foreign currencies and are
thus likely to weather the rising debt service costs associated with currency
depreciation better than would issuers with mostly domestic incomes (eg domestic
telecoms, construction companies and utilities).
On this basis, a cursory examination of firm-level issuance data suggests that
non-financial borrowers from countries such as Brazil, Mexico, Russia and South
Africa would be more likely to have at least partially matching foreign currency
assets and liabilities, given the predominance of commodities producers and
exporters among the largest issuers. In contrast, assets and liabilities are less likely
to be matched at property developers in China or energy and utilities firms in India,
which have been among the more active international debt issuers in recent years,
pointing to possible “pockets of risk” in these sectors.
Companies can also manage their foreign currency exposures via derivatives.
Again, reliable data on corporate hedging activities are generally scarce, while
incentives to take open interest rate and foreign currency hedging positions have
been relatively strong recently. One issue is hedging cost and, hence, the depth of
the relevant hedging market. This might suggest that corporates from countries
such as Brazil, Korea or Mexico (which are known to have access to liquid domestic
or offshore markets that support financial hedging strategies for both currency and
interest rate risk exposures) are more likely to be hedged than their peers in, say,
China or Indonesia. Indeed, data for Mexico indicate that the volume of exchange
rate derivatives transactions picked up sharply from a monthly average of around
$12 billion in 2007–08 to more than $25 billion in late 2013, in line with the
observed increase in local corporates’ international issuance. In countries with less
developed markets, however, mismatches will often go unhedged because markets
may not be deep enough to provide appropriate and cost-effective hedging.
12
The flip side of this argument is that derivatives-related financial exposures can
change the sensitivity of corporate balance sheets in ways that may be unrelated to
what is suggested, say, by the issuer’s sector. In the early stages of the global
financial crisis, for example, some large corporates in Brazil, Korea and Mexico
experienced significant losses because of largely speculative positions in foreign
exchange derivatives contracts (see box). This experience shows that an abrupt
change in the exchange rate trend can conspire with complex financial exposures to
wreak significant damage on corporate balance sheets even when a firm’s foreign
exchange liabilities are deemed to be adequately hedged during normal times.
An additional concern is that liquidity in hedging markets can evaporate during
times of market stress. Even longer-term exposures are often hedged with more
liquid short-term contracts with the aim of reducing hedging costs. As the
respective contracts have to be rolled over regularly, this could significantly reduce
the value of financial hedges against large exchange rate fluctuations, since markets
are bound to be at their shallowest when hedging needs are greatest. In this
al (2013)). Yet the Survey is conducted infrequently (once every four years) and is residence-based
(as opposed to nationality-based).
12
For illustration, the 2013 annual report of one large Chinese property developer states: “The Group
manages its currency risk by closely monitoring the movements of currency exchange rates. The
Group currently does not have a currency hedging policy […] but will consider hedging significant
currency exposure should the need arise.”

BIS Quarterly Review, September 2014
43
Currency derivatives and corporate losses: this time is different?
The Lehman bankruptcy in September 2008 triggered a global shortage of US dollar funding, lifting the US currency.
According to one estimate, the ensuing sharp depreciation of local currencies against the dollar hit 50,000 or more
non-financial corporations with total losses of at least $30 billion, via positions on foreign exchange (FX) derivatives
contracts. This added to the uncertainty in those corporates’ domestic financial markets, worsening the impact of
the crisis still further. Given that many EME corporations are said to have increased their foreign exchange exposures
significantly in recent years, a key question is how vulnerable such firms are to, possibly abrupt, exchange rate
movements. This box reviews some key features of the derivatives activities of EME corporations in 2008, and
highlights differences between then and now.
One factor behind EME corporates’ foreign exchange losses in 2008 was the popularity of contracts with a
“knock-in, knock-out” (KIKO) feature. Heavy use of such contracts meant that many exporters, while insured against
modest exchange rate movements, were exposed to possibly large losses if the local currency depreciated sharply.
In a standard FX option transaction, a company (eg an exporter) with revenues mostly in foreign currency (eg in
US dollars) but with production costs in local currency buys, for a small fee (premium), a put option from a
counterparty (eg a local bank) that gives the exporter the right but not the obligation to sell its dollar income at a
specific strike price at a future time. If the domestic currency spot exchange rate at maturity is stronger than the
agreed rate, the exporter exercises the option and gets a higher income in local currency terms than it would
otherwise get at the spot rate.
Compared with this basic setup, KIKO contracts have two additional features. The first is a call option (knock-in)
held by the bank. If the reference currency (eg the US dollar) strengthens beyond a certain threshold, the knock-in
requires the exporter to sell its dollars at the strike price (ie below market rates). The second, so-called knock-out,
feature dictates that no option can be exercised by either the exporter or the bank if the dollar weakens below a
certain threshold. Both features serve to reduce hedging expenses, albeit at the cost of retaining the tail risk of
stronger currency depreciations.
A third feature is possible acceleration effects. KIKO contracts were quite often leveraged (at, say, 1:2), resulting
in payments that would double the contractual amounts. This resulted in open speculative positions on relatively
stable exchange rates. Furthermore, some EME corporations apparently purchased multiple KIKO contracts with
different banks to bypass each individual bank’s counterparty limit. As a result, when the US dollar rose sharply
against almost all currencies in late 2008, these corporations suffered “unexpected” losses owing to the knock-in
feature in their hedging operations.
Given the risk of high potential losses, a key question is why so many EME corporations used KIKO or similar
contracts to hedge their FX exposures prior to 2008. There are a number of possible explanations. By design, KIKO
features lower the premium charged by the contract seller. In that sense, many EME corporations were attracted by
the low hedging costs. This feature was particularly attractive at the time, as the major EME currencies had
experienced a long period of slow but steady appreciation against the US dollar. The resulting false sense of security
was reinforced by most commercial and official forecasts, which, up until 2007, called for this trend to continue in
the near term. Furthermore, local banks were often not the actual seller of the KIKO contracts, but merely acted as
intermediaries for foreign banks and ultimate investors, such as hedge funds. In doing so, banks earned a fee while
passing the exchange rate risk on to the ultimate contract sellers. Under such circumstances, banks may have had an
incentive to sell more contracts to increase their fee income, at least insofar as their client relationships with their
corporate customers were not jeopardised by any losses that their clients might incur.
Against this background, an important difference between now and then is that the recent prolonged period of
relatively low volatility in foreign exchange markets has been punctuated by the two “tapering” events, in May 2013
and January/February 2014. No major losses from corporate exposures in derivat
ives markets were revealed in the
aftermath of these episodes. That said, carry trade incentives have since strengthened again, and certain EME
corporations may have incurred exposures via contracts that will generate losses only at a later stage. For example,
there is anecdotal evidence of increased interest from Asian corporates in structured foreign exchange products with
KIKO-like features. In addition, for some EME hedging markets, the sellers of hedging products are often
concentrated and the markets themselves are not very liquid. Again, this tendency could exacerbate any market
reaction once the market changes direction.
See eg Sidaoui et al (2010) and Lee (2009).
44 BIS Quarterly Review, September 2014
context, the May 2013 and early 2014 episodes of sharp currency depreciation in
many EMEs may have served as wake-up calls, by inducing corporate treasurers to
review and trim any open currency exposures. Recent attempts by the Chinese
authorities to introduce more two-way risk into renminbi exchange rates would
seem work in the same direction.
Implications for local banks and the financial system
What are the implications of more vulnerable EME corporate sector balance sheets
for the financial system? Scope for spillovers arises from at least two channels, as
detailed below.
Liability-side exposures
One channel works through the liabilities of banks and, possibly, other financial
institutions.
13
Among these, local institutions are likely to be particularly exposed,
especially if they have come to rely on corporate deposits for part of their wholesale
funding. For deposits that are associated with corporates exploiting the “carry”
between local and foreign currency interest rates, the unwinding of such positions
when interest rate differentials narrow or volatilities increase will reduce these
funds. Deposits that are denominated in foreign currencies, in turn, are known to be
more procyclical than other types of deposits and may thus be subject to sudden
withdrawals by corporates facing rollover risks (Turner (2014)).
A key factor in the transmission of such effects is the shadow banking system.
In Korea, for example, assets held by non-bank financial institutions have grown at
an annual average rate of 10% since the global financial crisis. Securities companies,
in particular, have seen their assets increase more than twofold during that period.
In this context, it appears that the securities sector in Korea has accumulated
substantial claims on banks and other depository institutions. Securities firms, in
turn, finance themselves with short-term money market instruments held by the
non-financial corporate sector. To the extent that non-financial corporates issue
debt but hold the proceeds as liquid claims, they behave as surrogate
intermediaries channelling funding from global capital markets into the domestic
financial system (Bank of Korea (2014)).
Asset-side exposures
Another, more conventional, channel is the risks embodied in asset-side exposures.
Banks tend to have direct credit exposures to corporates via lending and through
counterparty risk from any derivative positions. While these exposures can be
important internationally, for example vis-à-vis Asia (Graph 5), local banks, again,
tend to be particularly exposed, with loans to non-banks still accounting for a large
part of domestic loans in many jurisdictions. Furthermore, since larger and more
creditworthy corporates have better access to cross-border borrowing, higher
foreign bank penetration could end up increasing the exposure of local lenders to
13
See Chung et al (2014) for a discussion of how the financial activities of non-financial corporates in
international markets could affect funding conditions and credit availability in home markets.

BIS Quarterly Review, September 2014
45
smaller, possibly less creditworthy, firms. That said, a mitigating factor is that
standard on-balance sheet leverage and capitalisation metrics for EME banks tend
to be rather favourable in the aggregate, which may help to reduce such risks at the
banking system level.
14
Another, less direct, source of credit risk for banks comes from broader
exposure to debt markets, eg via bond holdings. Recently, however, there have
been signs that asset managers and other buy-side investors have increasingly
displaced bank investors in corporate bond markets. This raises questions about
feedback effects if existing positions are not rolled over (see below).
Feedback effects
Working together, both types of channel can give rise to potentially powerful
feedback effects. Currency mismatches, for example, will tend to amplify both
default risk and pressure to deleverage if borrowers are hit by a depreciating local
currency. Combined with uncertainties about the true extent of such mismatches,
concerns about rising default risk could then result in a more widespread rout of
international investors, loss of market access and spillovers into domestic interbank
markets – exacerbating the financial and macroeconomic impact of the initial
interest rate or foreign exchange shock.
The duration risk exposures of asset managers and other institutional investors
(the flip side of corporates’ attempts to issue new debt and term out existing
borrowings) are another potential source of adverse price dynamics. These might be
further amplified by the correlated behaviour of asset managers. Such herding in
bond markets can arise from the reliance on common risk management
14
A possible caveat is that EME and advanced country bank balance sheet metrics may, in fact, be
converging; see CGFS (2014) and BIS (2014), Chapter VI, for details.
Changes in global banks’ foreign claims on EME non-bank private sector
1
In billions of US dollars Graph 5
Emerging Asia Latin America Other EMEs
AR = Argentina; BR = Brazil; CL = Chile; CN = China; CO = Colombia; CZ = Czech Republic; HU = Hungary; ID = Indonesia; IN = India;
KR = Korea; MX = Mexico; MY = Malaysia; PE = Peru; PH = Philippines; PL = Poland; RU = Russia; TH = Thailand; TR = Turkey;
VE = Venezuela; ZA = South Africa.
1
Not adjusted for exchange rate movements.
Source: BIS consolidated banking statistics.
–25
0
2
5
5
0
7
5
10
0
CN IN ID MY PH KR TH
2004 to 2007 2009 to 2012
–25
0
25
50
75
100
AR BR CL CO MX PE VE
2004 to 2007 2009 to 2012
–25
0
25
50
75
100
CZ HU PL RU ZA TR
2004 to 2007 2009 to 2012
46 BIS Quarterly Review, September 2014
technologies, from simultaneous buy and sell decisions due to index tracking, and
from a rush to exit due to concerns about market liquidity.
15
Conclusions
Unusually easy global financial conditions post-crisis and the ubiquitous quest for
yield have encouraged EME non-financial corporations to increase leverage and
overseas borrowing. In many jurisdictions, corporates have opted to lock in low
global interest rates and to sharply increase their international debt issuance. While
cheap funding could boost economic performance if it supports viable investment
projects, it inevitably increases the borrower’s interest rate, rollover and currency
risks. Furthermore, some EME corporations may have used borrowed funds for
purely financial (ie speculative) purposes. In other cases, these external positions
may be inadequately hedged, whether through natural offsets or by the use of
financial instruments.
Overall, these factors have increased the risks facing these companies, implying
the existence of “pockets of risk” in particular sectors and jurisdictions. If these risks
were to materialise, adding to broader EME vulnerabilities (BIS (2014)), stress on
corporate balance sheets could rapidly spill over into other sectors, inflicting losses
on the corporate debt holdings of global asset managers, banks and other financial
institutions. This could be a source of powerful feedback loops in response to
exchange rate and/or interest rate shocks, especially if credit risk concerns
prevented the rollover of existing bank or bond market funding.
15
For a more detailed exploration of the risks arising from the increased participation of global asset
management companies in emerging markets,
see Miyajima and Shim (2014). Kamada and
Miura (2014) provide a model and empirical evidence of herding by bond market investors in Japan
due to some of the same factors.
BIS Quarterly Review, September 2014
47
References
Avdjiev, S and E Takáts (2014): “International bank lending during the taper tantrum:
the role of emerging market fundamentals”, BIS Quarterly Review, September,
pp 49–60.
Bank for International Settlements (2014): 84th Annual Report, “Time to step out of
the shadow of the crisis”, Basel, June.
Bank of America Merrill Lynch (2014): “Facts, fiction and FX vulnerabilities”, Global
Emerging Markets Credit Research, 25 February.
Bank of Korea (2014): Financial Stability Report, April 2014.
Chung, K, J-E Lee, E Loukoianova, H Park and H S Shin (2014): “Global liquidity
through the lens of monetary aggregates”, IMF Working Papers, no 14/9.
Committee on the Global Financial System (2014): “EME banking systems and
regional financial integration”, CGFS Papers, no 51, March.
Financial Times (2014): “Fall in renminbi sends out carry trade warning”, 23 February.
Goldman Sachs (2013): “Copper curve ball – Chinese financing deals likely to end”,
Goldman Sachs Commodities Research, 22 May.
Gruić, B, M Hattori and H S Shin (2014): “Recent changes in global credit
intermediation and potential risks”, BIS Quarterly Review, September, pp 17–18.
International Monetary Fund (2014): “Making the transition from liquidity- to
growth-driven markets”, Global Financial Stability Report, Chapter 1, April.
Kamada, K and K Miura (2014): “Confidence erosion and herding behaviour in bond
markets: an essay on central bank communication strategy”, Bank of Japan Working
Papers, no 14-E-6, April.
Lee, Y (2009): “Korean corporations court bankruptcy with suicidal KIKO options”,
Bloomberg, 24 March.
Miyajima, K and I Shim (2014): “Asset managers in EM asset markets”, BIS Quarterly
Review, September, pp 19–34.
Morgan Stanley (2013): “EM corporates: rising leverage, rising risk“, Morgan Stanley
Research EM Profile, November.
Powell, A (2014): ”Global recovery and monetary normalisation: escaping a chronicle
foretold?”, Inter-American Development Bank, Chapter 4.
Rush, A, D Sadeghian and M Wright (2013): “Foreign currency exposure and
hedging in Australia”, Reserve Bank of Australia Bulletin, December.
Shin, H S (2013): “The second phase of global liquidity and its impact on emerging
economies”, remarks at the 2013 Federal Reserve Bank of San Francisco Asia
Economic Policy Conference.
Sidaoui, J, M Ramos-Francia and M Cuadra (2010): “The global financial crisis and
policy response in Mexico”, BIS Papers, no 54, December.
Turner, P (2014): “The global long-term interest rate, financial risks and policy
choices in EMEs”, BIS Working Papers, no 441, February.
World Gold Council (2014): China’s gold market: progress and prospects.
BIS Quarterly Review, December 2014
67
Stefan Avdjie
v
Michael Chui
michael.chui@bis.org
Hyun Song Shin
Non-financial corporations from emerging market
economies and capital flows
1
Non-financial corporations from emerging market economies (EMEs) have increased their
external borrowing significantly through the offshore issuance of debt securities. Having
obtained funds abroad, the foreign affiliate of a non-financial corporation could transfer funds
to its home country via three channels: it could lend directly to its headquarters (within-
company flows), extend credit to unrelated companies (between-company flows) or make a
cross-border deposit in a bank (corporate deposit flows). Cross-border capital flows to EMEs
associated with all three of the above channels have grown considerably over the past few
years, as balance of payments data reveal. To the extent that these flows are driven by financial
operations rather than real activities, they could give rise to financial stability concerns.
JEL classification: D21, F31, G32.
The pattern of cross-border financial intermediation has undergone far-reaching
changes in recent years, from one that relied overwhelmingly on bank-
intermediated finance to one that places a greater weight on direct financing
through the bond market. In the process, non-financial firms have taken on a
prominent role in cross-border financial flows. They have increased their external
borrowing significantly through the issuance of debt securities, with a significant
part of the issuance taking place offshore. Between 2009 and 2013, emerging
market non-bank private corporations issued $554 billion of international debt
securities. Nearly half of that amount ($252 billion) was issued by their offshore
affiliates (Chui et al (2014)).
2
An important question is whether this increased
corporate external borrowing can be a source of wider financial instability for
emerging market economies and, if so, which channels of financing flows give rise
to concerns.
3
The large increase in issuance by their overseas affiliates shows that EME firms’
financing activities straddle national borders. Hence, measurement of external debts
1
The authors would like to thank Claudio Borio, Dietrich Domanski, Branimir Gruić, Pablo García-
Luna, Robert McCauley, Patrick McGuire, Christian Upper and Philip Wooldridge for their
discussions. Deimantė Kupčiūnienė provided excellent research assistance. The views expressed are
those of the authors and do not necessarily reflect those of the BIS.
2
For further evidence of increased offshore bond issuance by EME non-financial corporations, see
Gruić et al (2014b).
3
Chui et al (2014) outline the potential risks related to EME corporate balance sheets, focusing on
the role of leverage and currency mismatch.
PLEN/2015/47 ANNEX E.3
68 BIS Quarterly Review, December 2014
based on the residence principle can be problematic.
4
In particular, external debt
based on the residence principle may understate the true economic exposures of a
firm that has borrowed through its affiliates abroad. If the firm’s headquarters has
guaranteed the debt taken on by its affiliate, then the affiliate’s debt should rightly
be seen as part of the firm’s overall debt exposure. Even in the absence of an
explicit guarantee, the firm’s consolidated balance sheet will be of relevance in
understanding the firm’s actions. While this point has been well recognised in the
realm of international banking (Cecchetti et al (2010)), it had not received much
attention in the context of non-financial corporates until recently (Gruić et
al (2014a)).
The practice of using overseas affiliates as financing vehicles has a long history.
Borio et al (2014) describe how in the 1920s German industrial companies used their
Swiss and Dutch subsidiaries as financing arms of the firm to borrow in local
markets and then repatriate the funds to Germany.
5
As old as such practices are,
they have become the centre of attention again in recent years due to the
increasingly common practice of EME non-financial corporates borrowing abroad
through debt securities issued by their affiliates abroad. If the proceeds of the bond
issuance are used for acquiring foreign assets, the money stays outside and there
are no cross-border capital movements. However, we will be focusing on the case
where the firm transfers the proceeds of the bond issuance back to its home
country, either to finance a local (headquarters) project, or to be held as a financial
claim on an unrelated home resident – say, by being deposited in a bank or by
being lent to another non-bank entity. If the overseas bond proceeds are
repatriated onshore to invest in domestic projects with little foreign currency
revenue, the firm will face currency risk. If the proceeds are first swapped into local
currency, then the firm’s activities are likely to have an impact on financial
conditions (Box 1). In either case, the economic risks may be underestimated if
external exposures are measured according to the conventional residence basis.
Having obtained funds abroad (by issuing bonds offshore), the foreign affiliate
of a non-financial corporation could act as a surrogate intermediary by repatriating
funds (Chung et al (2014), Shin and Zhao (2013)). It can do that via thee main
channels (Graph 1). First, it could lend directly to its headquarters (within-company
flows). Second, it could extend credit to unrelated companies (between-company
flows). Finally, it could make a cross-border deposit in a bank (corporate deposit
flows).
A practical question is how best to monitor these non-bank capital flows under
the existing measurement framework organised according to the residence principle.
The balance of payments (BoP) accounting framework lists broad categories such as
foreign direct investment (FDI) and portfolio flows, but it does not separate out the
4
In international finance, the statistical convention is to identify the border as the boundary of the
national income area, so that what is “external” or “internal” is defined by reference to that
boundary. This statistical convention gives rise to the residence principle. A firm is resident in a
particular national income area (or “economic territory”) if it conducts its business activities mostly
within the boundaries of that economic territory.
5
Even to this day, Germany is one of the few developed countries where non-financial firms are still
generating large within-company capital flows across borders. During the past five years, gross
direct investment flows to Germany totalled $185 billion, $73 billion of which were for equity
acquisitions and the rest were debt transfers between a firm’s headquarters and its affiliates.

BIS Quarterly Review, December 2014
69
Box 1
International bond issuance, cross-currency swaps and capital flows
When an EME company issues a US dollar-denominated bond in overseas capital markets and then repatriates the
proceeds, one would expect that to show up as capital inflows in US dollars. However, this need not always be the
case. The company or its overseas subsidiary can issue the bond and swap the proceeds into domestic currency
before transferring the funds back to the headquarters. Obviously, there will be a similar increase in the
headquarters’ liabilities, but only the company’s consolidated balance sheet would show an increase in foreign
currency liabilities.
For instance, Chinese firms have primarily issued US dollar-denominated bonds abroad, whereas non-Chinese
companies account for a sizeable proportion of offshore renminbi bond (CNH) issuance (Graph A). Very often, these
non-Chinese entities will swap their CNH proceeds into US dollars. In doing so, they are taking advantage of the
cross-currency swap markets to obtain US dollar funding at lower costs than by issuing US dollar bonds (HKMA
(2014)). Similarly, cross-currency swaps offer Chinese firms a channel to get around the tight liquidity conditions in
China by swapping their US dollar proceeds from bond issuance into renminbi and remitting to their headquarters.
International debt securities issuance
In billions of US dollars Graph A
Net renminbi-denominated bond issues Net issues of international debt by Chinese nationals
Source: BIS international securities statistics.
flows associated with corporate activity from those of the financial sector.
6
However,
a little detective work can reveal a wealth of information. This article explores how
the BoP data and some key items buried deep within the broad categories of direct
investment and other investment can be used to shed light on cross-border capital
flows through non-financial corporate activities (Table 1).
In the rest of this article, we present evidence that capital flows to EMEs
associated with non-financial corporations have indeed increased markedly over the
6
Reporting of sectoral data, however, is included in the sixth edition of the IMF’s Balance of
Payments and International Investment Position Manual (BPM6) published in 2009 and last updated
in November 2013. The IMF will only accept data submitted under this new template from January
2015 (Box 2). However, only a small number of EMEs are expected to submit granular sectoral data
in the near term.
–5
0
5
1
0
1
5
2007 2008 2009 2010 2011 2012 2013 2014
Rest of the world
Chinese nationals
–20
0
20
40
2007 2008 2009 2010 2011 2012 2013 2014
Renminbi
US dollar
HK dollar
Other currencies

70 BIS Quarterly Review, December 2014
past few years through three different channels. First, we demonstrate that transfers
between firms’ headquarters and their offshore affiliates have surged. Next, we
show that “non-bank” trade credit flows to EMEs have increased significantly.
Finally, we demonstrate that the amount of external loan and deposit financing to
EMEs provided by non-banks has grown considerably.
Within-company credit
An accounting convention in the balance of payments deems borrowing and
lending between affiliated entities of the same non-financial corporate to be “direct
investment”. Specifically, such transactions are classified under the “debt
instruments” sub-item of direct investment. In contrast, borrowing and lending
between unrelated parties are classified as either a portfolio investment or under
the “other” category.
7
The rationale behind treating within-firm transactions as
direct investment is that the overall profitability of a multinational corporation
depends on advantages gained by deploying available resources efficiently to each
unit in the group. For example, tax considerations could drive the choice between
equity and within-company debt, and behaviourally such debt can be, and often is,
written down in adverse circumstances.
Classifying the transfer onshore of funds obtained offshore as FDI raises
questions about the traditional view that FDI is a stable or “good” form of capital
flow (CGFS (2009)). This may be true for FDI in the form of large equity stakes
associated with greenfield investment or foreign acquisitions. But within-company
loans, especially if invested in the domestic financial sector, could turn out to be
“hot money”, which can be withdrawn at short notice. Thus, to the extent that
7
Lending and borrowing between affiliated deposit-taking corporations (ie intrabank flows) are an
exception to the above rule. They are classified not as FDI (debt), but as “other investment” (loans
and deposits, respectively).
Non-financial corporations and capital flows
Graph 1
Source: BIS.

BIS Quarterly Review, December 2014
71
within-company loans are financed through the offshore issuance of debt securities,
they could be viewed as portfolio flows masked as FDI.
Quantitatively, for most EMEs, within-company lending has been modest when
compared with purchases of stakes in other companies (Graph 2, left-hand panel).
However, there have been sizeable increases in within-company flows in Brazil,
China and Russia, amounting to more than $20 billion per quarter for these three
countries combined (Graph 2, right-hand panel), which was broadly similar to the
size of total portfolio inflows to the three countries during this period.
Between-company trade credit
The second mode of capital flow generated by non-financial firms’ activities is
through trade credit. The term “trade credit” has a narrower meaning in the balance
of payments than in everyday use. Instead of encompassing trade financing more
broadly such as guarantees through banks and letters of credit, the trade credit
category under the BoP accounts refers only to claims or liabilities arising from the
direct extension of credit by suppliers for transactions in goods and services, under
a residual item known as “other investment”. Bank-provided trade financing, such as
letters of credit, is recorded separately under “loans”.
8
Typically, trade credit flows between companies are small and account for a
small proportion of total other investment flows in most instances. Direct credit
extension between exporters and importers could be seen as much riskier than
arranging trade financing through banks. However, trade credit flows to EMEs have
increased since the global financial crisis (Graph 3, left-hand panel), and the increase
8
Other firm-to-firm cross-border transactions such as account payables/receivables are simply
recorded under “other” in “other investment”.
Balance of payments financial accounts
1
Table 1
Gross inflows
Direct investment
Equity
Debt instruments (within-company credit)
Portfolio investment
Equity
Debt
Financial derivatives
Other investments
Currency and deposits (corporate deposits)
Loans (between-company credit)
Trade credit (between-company credit)
Other payables (between-company credit)
1
Possible modes of capital flow generated by non-financial companies are in bold.
Source: IMF, Balance of Payments Manual.

72 BIS Quarterly Review, December 2014
was driven, to a certain extent, by China (Graph 3, right-hand panel). In fact, the
share of trade credit inflows in total other investment in China in recent years has
been much larger than that in other EMEs. While these trade credit flows to China
may reflect Chinese companies’ growing importance and credibility in world trade,
trade credit could be another route through which the proceeds of offshore funding
can be transferred to headquarters and/or unrelated companies onshore.
Between-company loans and corporate deposits
Despite the limitations of the existing data frameworks discussed above, it is
possible to combine BoP statistics with the BIS international banking statistics (IBS)
to shed some light on the growing importance of non-bank corporates in providing
cross-border loans and deposits to EMEs.
From the lender perspective, the IBS capture the cross-border positions of
internationally active banks. As a consequence, the IBS could be used to measure
the amount of cross-border loans that banks provide to residents (both banks and
non-banks) of a given country.
From the borrower perspective, a couple of (liability) categories in the BoP data
provide information on the amount of cross-border financing that the residents of a
given country obtain in the form of deposits and loans. More specifically, “deposit
liabilities” capture the standard contract liabilities of all deposit-taking institutions in
a given reporting jurisdiction to both banks (interbank positions) and non-banks
(transferable accounts and deposits). Meanwhile, “loan liabilities” cover liabilities
that are created when a creditor lends funds directly to a debtor, and are
documented by claims that are not negotiable.
FDI: equity and debt flows to major EMEs
In billions of US dollars Graph 2
Gross FDI flows to major EMEs
1
Gross within-company flows to selected EMEs
1
Brazil, Chile, the Czech Republic, Hungary, India, Indonesia, Korea, Mexico, the Philippines, Poland, Russia, South Africa, Thailand and
Venezuela.
2
Data for China start from 2010.
Source: IMF.
0
2
0
4
0
6
0
8
0
10
0
2005 2006 2007 2008 2009 2010 2011 2012 2013
Equity shares Debt instruments
–10
0
10
20
30
2005 2006 2007 2008 2009 2010 2011 2012 2013
Brazil Russia China
2
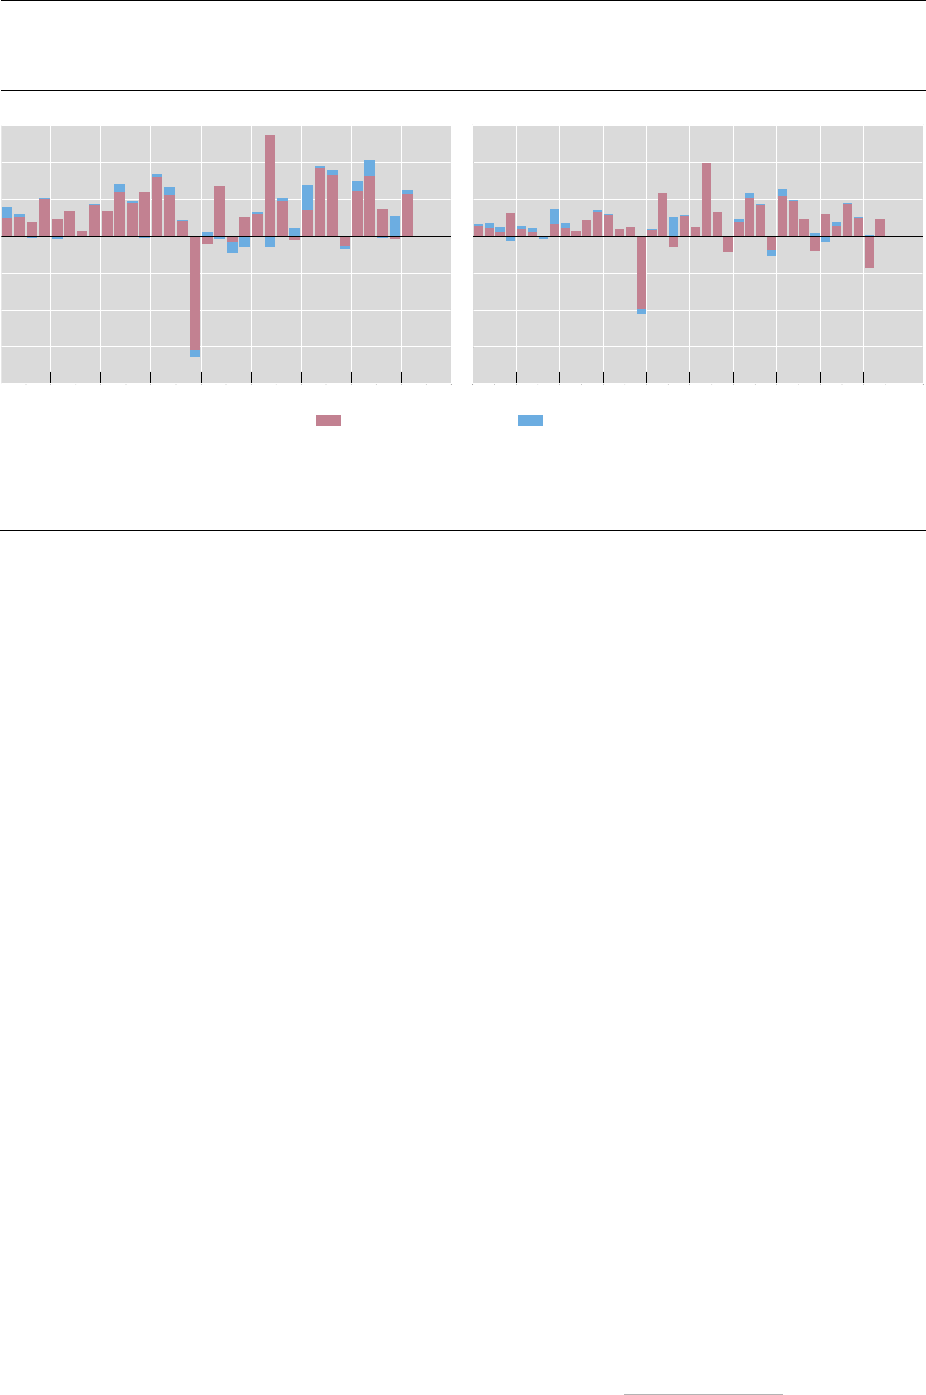
BIS Quarterly Review, December 2014
73
Table 2 illustrates how BoP and IBS can be brought together to estimate the
amount of non-bank finance to EME residents.
9
The two BoP categories discussed
above capture the cross-border liabilities of (bank and non-bank) residents of a
given country to all (bank and non-bank) creditors (represented by cells A, B, C and
D).
10
By contrast, the IBS capture solely the cross-border liabilities to offshore banks
(cells A and B).
11
Thus, in principle, the difference between the two series could be
used as a rough proxy for the amount of non-bank external financing to the
residents of a country (cells C and D).
12
This difference used to be small but has been increasing rapidly in recent years
(Graph 4, left-hand panel).
13
Up until 2007, the two series moved fairly in sync,
suggesting that BoP deposits and loan flows were dominated by banks. However,
the gap between the two series has been steadily growing and currently stands at
approximately $270 billion (which amounts to 17% of cumulative BoP flows since
Q1 2005). The growing gap between the BoP and IBS series could be interpreted as
evidence of the increasing weight of non-banks in providing external loan and
deposit financing to residents of emerging market economies.
9
Using a slightly different approach, Domanski et al (2011) decompose total (domestic and cross-
border) credit to a number of advanced economies by creditor sector (bank and non-bank).
10
In the context of our discussion, the category “non-banks” includes both non-financial firms and
non-bank financial firms. That said, in the case of EMEs, a large part of the latter group is accounted
for by the non-bank financial vehicles of non-financial corporates.
11
Note that intrabank flows are included in both the IBS series on cross-border bank lending and the
BoP series on external deposit liabilities (see footnote 7 for additional details).
12
In theory, the variation between the BIS and the BoP data could also be due to residents’ cross-
border liabilities to banks located in countries which do not report data for the IBS. In practice,
given the fairly comprehensive coverage of the IBS (which captures approximately $30 trillion worth
of cross-border claims that belong to banks located in 44 jurisdictions), it is reasonable to assume
that the above accounts for a negligible part of the overall wedge between the two series.
13
The data used to construct the IBS series are available in BIS Statistical Table 7A.
Between-company flows to EMEs
Inflows of trade credit and other account payables, in billions of US dollars Graph 3
Flows to all major EMEs
1
Flows to China
1
Includes Argentina, Brazil, Chile, China, Colombia, the Czech Republic, Hungary, India, Indonesia, Korea, Peru, the Philippines, Poland,
Russia, South Africa, Thailand, Turkey and Venezuela; Malaysia and Mexico are excluded due to data availability.
Sources: IMF; State Administration of Foreign Exchange, China.
–80
–60
–40
–20
0
2
0
4
0
2005 2006 2007 2008 2009 2010 2011 2012 2013
Trade credit
–80
–60
–40
–20
0
20
40
2005 2006 2007 2008 2009 2010 2011 2012 2013 2014
Other

74 BIS Quarterly Review, December 2014
A more detailed examination of the data suggests that the role of non-banks
might be even greater than the above estimates imply. Assuming positive gross
inflows from non-banks, the BoP external loan and deposit estimates should exceed
the respective IBS estimates for each country in our sample (since, as discussed
above, the former include external lending by non-banks, whereas the latter do
not). However, we find that the exact opposite is true for several EMEs, such as
Brazil, China, Indonesia, the Philippines and Thailand (Graph 4, centre panel).
14
In
theory, this finding could be explained by negative cumulative non-bank flows to
each of those countries. In practice, it is highly unlikely that this was the case during
Cumulative cross-border deposit and loan gross flows to major EMEs
1
By creditor sector, in billions of US dollars Graph 4
Full sample
2
Subsample A
3
Subsample B
4
1
Cumulative flows starting from Q1 2005. Data for China start from Q1 2010.
2
Full sample = subsample A + subsample B.
3
Brazil,
China, Indonesia, the Philippines and Thailand.
4
Chile, the Czech Republic, Hungary, India, Korea, Mexico, Poland, Russia, South Africa
and Turkey.
5
Sum of “BoP other liabilities: currency and deposits” and “BoP other liabilities: loans” for each listed country.
6
Cross-
border claims of BIS reporting banks on each listed country.
Sources: IMF; BIS locational banking statistics by residence (Table 7A).
14
McCauley and Seth (1992) and Borio et al (2013) find that, for the United States, figures from the
IBS data on external bank loans considerably exceed those based on the respective flow of funds
data.
0
35
0
70
0
1,05
0
1,40
0
05 06 07 08 09 10 11 12 13
All external creditors
5
0
200
400
600
800
05 06 07 08 09 10 11 12 13
Banks located abroad
6
0
250
500
750
1,000
05 06 07 08 09 10 11 12 13
Coverage of external loans and deposits in the BoP and IBS data
Table 2
Borrowing country
Banks Non-banks
Lending country
Banks
A B
Non-banks C D
Captured by both BoP and IBS data. Captured solely by BoP data.
Sources: IMF, Balance of Payments Manual; BIS, Guidelines for reporting the BIS international banking statistics.

BIS Quarterly Review, December 2014
75
Box 2
Interpreting FDI flows under the new balance of payments template
The rapid pace of financial globalisation over the past few decades has changed many aspects of international
capital flows. To improve the understanding of these capital movements, in 2009 the IMF and its members agreed
on a new template for collecting international financial transactions data: the sixth edition of the IMF’s Balance of
Payments and International Investment Position Manual (BPM6). From January 2015, the IMF will only accept data
submissions under BPM6. In the transition period, some countries will still be publishing their BoP data under the
previous template (BPM5, introduced in 1993) and the IMF will simply convert those “old” data to the new standard.
Using Brazil as an example, this box illustrates how the conversion between BPM5 and BPM6 affects the
interpretation of FDI flows.
Data published under the two formats reflect somewhat different treatments of within-company loans,
resulting in differences in reported gross FDI inflows and outflows (Graph B, left-hand and centre panels), even
though net FDI flows remain unchanged. This is because, under BPM5, FDI transactions between affiliates are
recorded on a residence versus non-residence basis, whereas BPM6 differentiates between the net acquisition of
assets and the net incurrence of liabilities. Simply put, under BPM5, both headquarter lending to affiliates (which
increases claims) and borrowing from affiliates (which increases liabilities) are counted as gross outflows, albeit with
opposite signs. Under BPM6, by contrast, the two activities will fall into different categories. While headquarter
lending to affiliates will continue to count as capital outflow, borrowing from affiliates will be counted as net
incurrence of liabilities (capital inflow). Using the notation in Graph B (right-hand panel), net acquisition of debt
claims under BPM6 (item 6.1.2) will be the sum of items 5.1.2 and 5.2.2 under BPM5.
Brazilian FDI flows
Graph B
Gross FDI inflows Gross FDI outflows Direct investment flows
In billions of US dollars
In billions of US dollars
BPM 5 BPM 6
Gross outflows
5.1 Direct investment
abroad
6.1 Net acquisition of
assets
5.1.1 Equity 6.1.1 Equity claims
5.1.2 Claims on affiliates 6.1.2 Debt claims
5.1.3 Liabilities to affiliates
Gross inflows
5.2 Direct investment
in reporting country
6.2 Net incurrence of
liabilities
5.2.1 Equity 6.2.1 Equity liabilities
5.2.2 Claims on direct
investors
6.2.2 Debt liabilities
5.2.3 Liabilities to direct
investors
Sources: Central Bank of Brazil; IMF; BIS calculations.
the time period we examine. A much more plausible explanation could be related to
inconsistencies in the reporting of external liabilities.
15
While the above finding is intriguing in its own right, it also has important
implications for the main question that we examine in this article. Namely, it
suggests that, for the remaining EMEs in our sample, the aggregate size of the gap
between the BoP and IBS series is considerably larger than the one implied by the
15
Potential data reporting-related sources of discrepancy include the coverage of the reporting
population, the treatment of bank-supported trade credit and the exchange rate valuation
adjustment methodology.
0
5
1
0
1
5
2
0
2
5
3
0
08 09 10 11 12 13 14
BPM5
–15
–10
–5
0
5
10
08 09 10 11 12 13 14
BPM6
76 BIS Quarterly Review, December 2014
estimates for the full sample. Indeed, as the right-hand panel of Graph 4 illustrates,
the wedge between the BoP and IBS series is considerably larger for the latter set of
EMEs (ie Chile, the Czech Republic, Hungary, India, Korea, Mexico, Poland, Russia,
South Africa and Turkey). At the end of 2013, the BoP-implied external loan and
deposit series for that group of countries exceeded its IBS counterpart by over
$550 billion (51% of cumulative BoP flows since Q1 2005). This presents further
evidence of the importance of non-banks in providing external loan and deposit
financing to EMEs.
Conclusion
The shift away from bank-intermediated financing to market financing over the past
few years has coincided with a sharp increase in international bond issuance by EME
non-financial corporations. This trend could have important financial stability
implications. Yet, analysis of it is hindered by conceptual difficulties associated with
statistical conventions on the measurement of cross-border flows.
In this article, we utilise several key BoP data items to shed light on cross-
border capital flows through non-financial corporate activities. We find that capital
flows associated with non-financial corporations have indeed increased markedly
over the past few years through three different channels. First, within-firm transfers
have surged. Second, trade credit flows to EMEs have increased significantly. Finally,
the amount of external loan and deposit financing to EMEs provided by non-banks
has grown considerably. We interpret those findings as evidence that the offshore
subsidiaries of EME non-financial corporates are increasingly acting as surrogate
intermediaries, obtaining funds from global investors through bond issuance and
repatriating the proceeds to their home country through the above three channels.
BIS Quarterly Review, December 2014
77
References
Borio, C, H James and H S Shin (2014): “The international monetary and financial
system: a capital account historical perspective”, BIS Working Papers, no 457,
September.
Borio, C, R McCauley and P McGuire (2013): “Global liquidity and credit booms”, in
B Winkler, A van Riet and P Bull (eds), A flow of funds perspective on the financial
crisis, Palgrave Macmillan, November, pp 94–124.
Cecchetti, S, I Fender and P McGuire (2010): “Toward a global risk map”, in Central
bank statistics: what did the financial crisis change?, proceedings from the Fifth ECB
Conference on Statistics.
Chui, M, I Fender and V Sushko (2014): “Risks related to EME corporate balance
sheets: the role of leverage and currency mismatch”, BIS Quarterly Review,
September, pp 35–47.
Chung, K, J Lee, E Loukoianova, H Park and H S Shin (2014): “Global liquidity
through the lens of monetary aggregates”, IMF Working Paper, January.
Committee on the Global Financial System (2009): “Capital flows and emerging
market economies”, CGFS Papers, no 33, January.
Domanski, D, I Fender and P McGuire (2011): “Assessing global liquidity”, BIS
Quarterly Review, December, pp 57–71.
Gruić, B, M Hattori and H S Shin (2014a): “Recent changes in global credit
intermediation and potential risks”, BIS Quarterly Review, September, pp 17–18.
Gruić, B, C Upper and A Villar (2014b): “What does the sectoral classification of
offshore affiliates tell us about risks?”, BIS Quarterly Review, December, pp 20–1.
Hong Kong Monetary Authority (2014): Half-yearly monetary & financial stability
report, March.
McCauley, R and R Seth (1992), ”Foreign bank credit to US corporations: the
implications of offshore loans”, Federal Reserve Bank of New York, Quarterly Review,
vol 17, Spring, pp 52–65.
Shin, H S and L Zhao (2013): “Firms as surrogate intermediaries: evidence from
emerging economies”, working paper, December.
