
TENNESSEE GAS PIPELINE
ANNUAL CUSTOMER MEETING
AUGUST 24, 2023
Newport, RI

DISCLOSURE
General – The information contained in this presentation does not purport to be all-inclusive or to contain all information that prospective investors may require. Prospective investors are encouraged to
conduct their own analysis and review of information contained in this presentation as well as important additional information through the Securities and Exchange Commission’s (“SEC”) EDGAR system at
www.sec.gov and on our website at www.kindermorgan.com.
Policies and Procedures –This presentation includes descriptions of our vision, mission and values and various policies, standards, procedures, processes, systems, programs, initiatives, assessments,
technologies, practices, and similar measures related to our operations and compliance systems (“Policies and Procedures”). References to Policies and Procedures in this presentation do not represent
guarantees or promises about their efficacy, or any assurance that such measures will apply in every case, as there may be exigent circumstances, factors, or considerations that may cause implementation of
other measures or exceptions in specific instances.
Forward-Looking Statements – This presentation includes forward-looking statements within the meaning of the U.S. Private Securities Litigation Reform Act of 1995 and Section 21E of the Securities
Exchange Act of 1934 (“Exchange Act”). Forward-looking statements include any statement that does not relate strictly to historical or current facts and include statements accompanied by or using words
such as “anticipate,” “believe,” “intend,” “plan,” “projection,” “forecast,” “strategy,” “outlook,” “continue,” “estimate,” “expect,” “may,” “will,” “shall,” and “long-term”. In particular, statements, express or implied,
concerning future actions, conditions or events, including our Policies and Procedures and their efficacy, long term demand for our assets and services, energy-transition related opportunities, including
opportunities related to alternative energy sources, future operating results or the ability to generate revenues, income or cash flow or to pay dividends are forward-looking statements. Forward-looking
statements are not guarantees of performance. They involve risks, uncertainties and assumptions. There is no assurance that any of the actions, events or results of the forward-looking statements will occur,
or if any of them do, what impact they will have on our results of operations or financial condition. Because of these uncertainties, you are cautioned not to put undue reliance on any forward-looking
statement. We disclaim any obligation, other than as required by applicable law, to publicly update or revise any of our forward-looking statements to reflect future events or developments.
Future actions, conditions or events and future results of operations may differ materially from those expressed in these forward-looking statements. Many of the factors that will determine these results are
beyond our ability to control or predict. These statements are necessarily based upon various assumptions involving judgments with respect to the future, including, among others; commodity prices, including
prices for Renewable Identification Numbers under the U.S. Environmental Protection Agency’s Renewable Fuel Standard Program; the timing and extent of changes in the supply of and demand for the
products we transport and handle; national, international, regional and local economic, competitive, political and regulatory conditions and developments; the timing and success of business development
efforts; the timing, cost, and success of expansion projects; technological developments; the condition of capital and credit markets; inflation rates; interest rates; the political and economic stability of oil-
producing nations; energy markets; federal, state or local income tax legislation; weather conditions; environmental conditions; business, regulatory and legal decisions; terrorism; cyber-attacks; and other
uncertainties. Important factors that could cause actual results to differ materially from those expressed in or implied by forward-looking statements include risks and uncertainties described in this presentation
and in our Annual Report on Form 10-K for the year ended December 31, 2021 and our subsequent reports filed with the SEC (under the headings “Risk Factors,” “Information Regarding Forward-Looking
Statements” and elsewhere). These reports are available through the SEC’s EDGAR system at www.sec.gov and on our website at www.kindermorgan.com.
GAAP – Unless otherwise stated, all historical and estimated future financial and other information included in this presentation have been prepared in accordance with generally accepted accounting
principles in the United States ("GAAP").
Non-GAAP – In addition to using financial measures prescribed by GAAP, we use non-generally accepted accounting principles (“non-GAAP”) financial measures in this presentation. Descriptions of our non-
GAAP financial measures, as well as reconciliations of historical non-GAAP financial measures to their most directly comparable GAAP measures, can be found in this presentation under “Non-GAAP
Financial Measures and Reconciliations”. These non-GAAP financial measures do not have any standardized meaning under GAAP and may not be comparable to similarly titled measures presented by other
issuers. As such, they should not be considered as alternatives to GAAP financial measures.
Industry and Market Data – Certain data included in this presentation has been derived from a variety of sources, including independent industry publications, government publications and other published
independent sources. Although we believe that such third-party sources are reliable, we have not independently verified, and take no responsibility for, the accuracy or completeness of such data.
Forward-looking statements / non-GAAP financial measures / industry & market data

BUSINESS UPDATE
Sital Mody
President – Gas Pipeline Group

Leader in North American Energy Infrastructure
4
Note: Volumes per 2023 budget. Business mix based on 2023 budgeted Adjusted Segment EBDA. See Non-GAAP Financial Measures & Reconciliations.
a) Annual capacity at KM share.
Energy infrastructure, especially natural gas pipelines & storage, has a decades-long time horizon moving and storing
the energy of today and tomorrow
Business Mix
62% 15% 12% 11%
Natural gas Products Terminals CO2
CO
2
source fields
Oil fields
RNG plants
RNG plants under development
Landfill gas-to-electricity facilities
CO
2
TERMINALS
Terminals
16 Jones Act tanker
Terminals
PRODUCTS
NATURAL GAS
Storage
Processing
LNG facilities
Operational medium BTU plants
LNG production & fueling facilities
Delivering energy to improve lives & create a better world
Largest natural gas transmission network
— ~70,000 miles of natural gas pipelines move ~40% of U.S. natural gas production
— Have interest in 700 bcf of working storage capacity, ~15% of U.S. natural gas
storage
Largest independent transporter of refined products
— Transport ~1.7 mmbbld
(a)
of refined products to West and East Coast demand
markets
— ~10,000 miles of refined products and crude pipelines
Largest independent terminal operator
— 140 terminals & 16 Jones Act vessels
— Significant provider of refined products storage along the Houston Ship Channel,
near the world’s most complex refining center
Largest CO
2
transport capacity of ~1.5 bcfd
— ~1,500 miles of CO
2
pipelines
— Produce CO
2
and transport to the Permian where it is used for enhanced oil
recovery
Growing Energy Transition Portfolio
— Up to 6.4 bcf
(a)
of RNG production capacity by mid-2024

FUNDAMENTALS UPDATE
Mark Wilson
Director – Marketing & Asset Optimization

LNG
Export
Canada
Southeast
Mexico
Eagle Ford
Shale
Haynesville
Shale
Utica Shale
Marcellus Shale
❑ Large pipeline system with access to
several supply basins and well
positioned to serve new demand
❑ Flexible - ~122 BCF of storage
❑ Direct connected power ~25,859 MW
❑ >500 firm transportation customers
❑ Supply Push – Permian and
Haynesville
❑ Market Pull - LNG export and Power
Generation
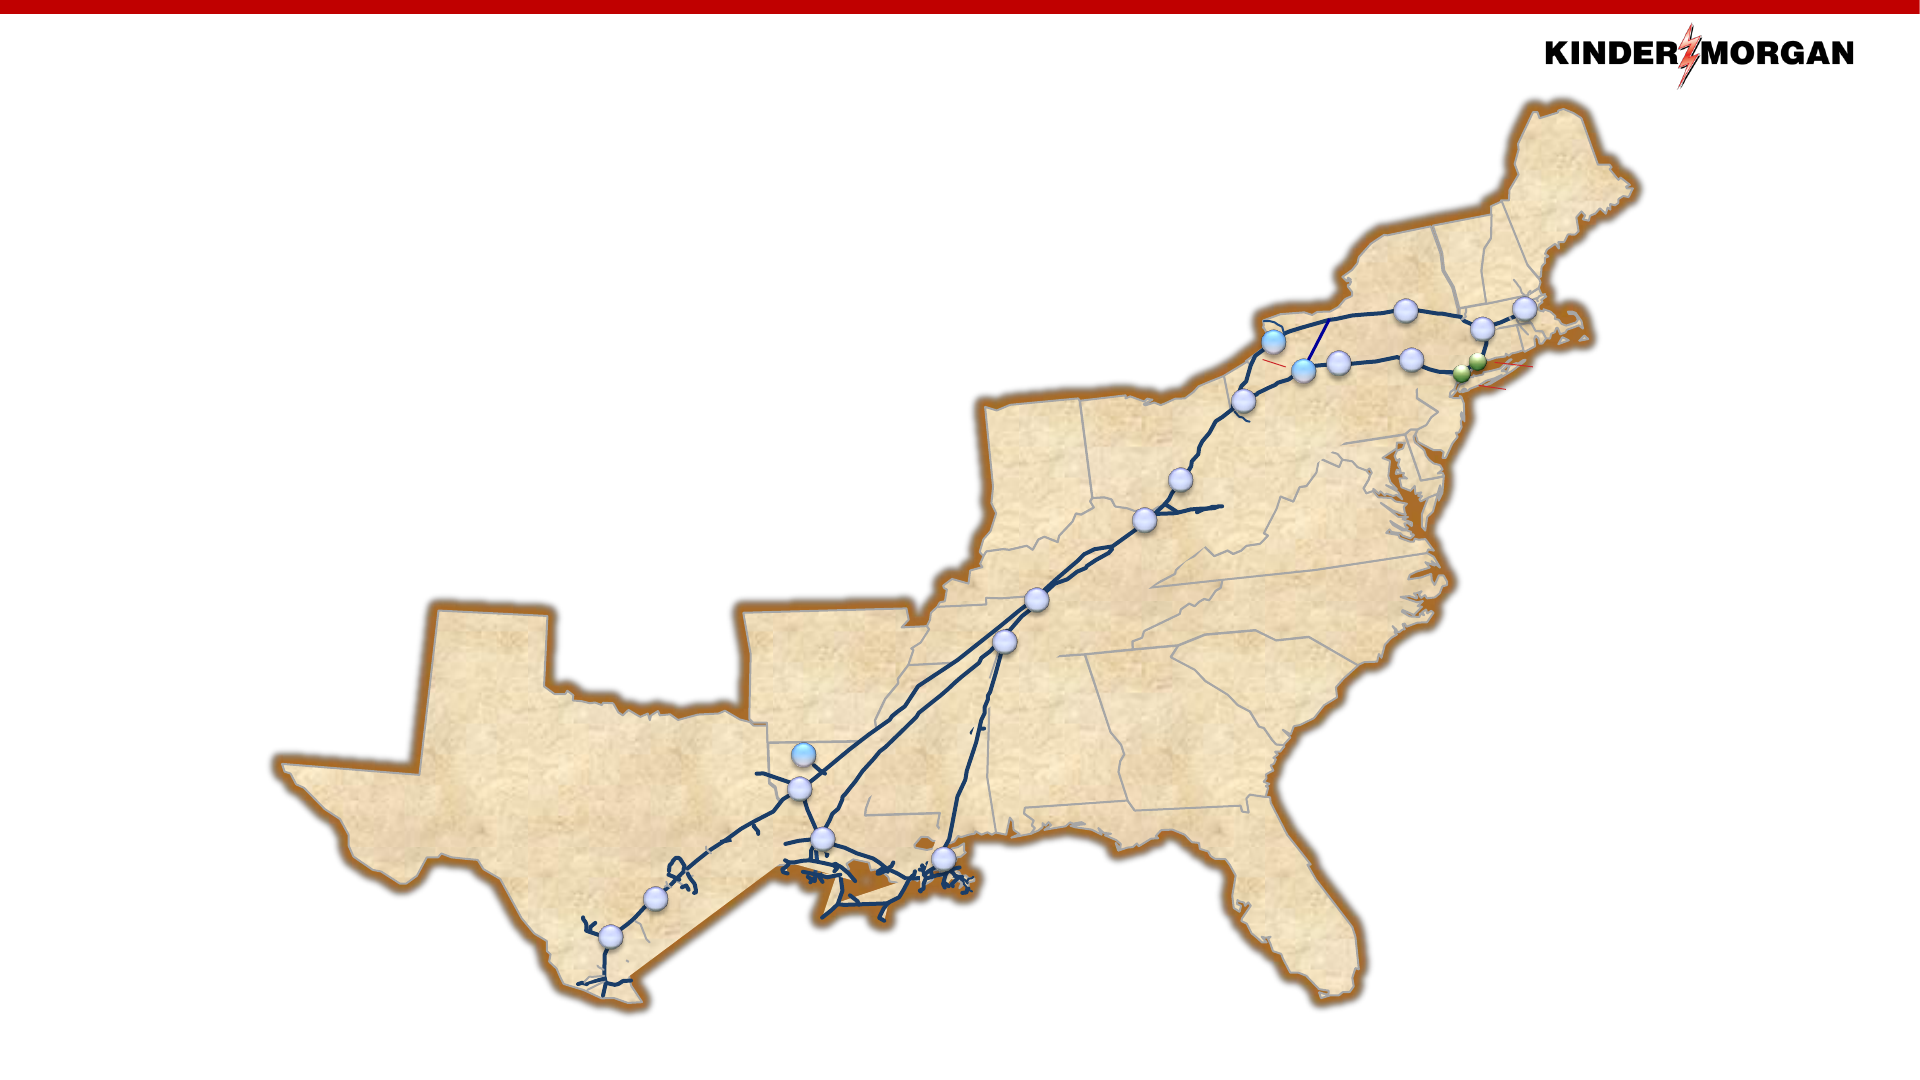
System Overview
Long-term Growth Drivers
New
England
Tennessee Gas Pipeline

Asset Optimization Coverage
Bidroom After Hours Hotline – 713-420-4135
❑ Northern Pipelines
❑ Kinder Morgan Louisiana Pipeline (KMLP)
❑ Stagecoach
❑ Tennessee Gas
❑ Southern Pipelines
❑ Elba Express
❑ Purchase/Sale
❑ Midcontinent Express
❑ Daily IT
❑ Park & Loan
❑ Short Term FT
❑ Southern Natural
❑ Park & Loan
❑ Short Term FT

Looking Back
❑ A year ago:
❑ Prompt NYMEX contract trading around ~$8/MMBtu
❑ Unsure if we could fill storage enough to meet demand for the winter
❑ This year:
❑ Prompt NYMEX contract trading around ~2.60/MMBtu
❑ Storage could be full before the end of September
❑ What happened?

What Changed?
$0.00
$1.00
$2.00
$3.00
$4.00
$5.00
$6.00
$7.00
$8.00
$9.00
$10.00
Prompt NYMEX Henry Hub
88
90
92
94
96
98
100
102
104
Jan 22 July 22 Jan 23 July 23
Bcf/day
L48 Production

Looking Forward – What Will Influence the S/D
Balance?
❑ Macro Constraints
❑ Into Northeast
❑ New England / LNG imports – what becomes of the Everett terminal?
❑ Out of Permian – Intrastate builds; low production cost
❑ Out of Appalachia
❑ MVP and intra-basin coal conversions
❑ Will there be additional expansions out of the basin?
❑ Worldwide LNG market / Crisis in Europe – will winter show up in Europe this
year?
❑ Power generation – Gas powered generation growth is tug-of-war
❑ Supply response – can producers ramp production to meet increased LNG and
Power demand?

LNG Capacity by Facility
Peak Nameplate
Capacity (Bcf/d)
Cove Point
0
5
10
15
20
25
30
Jan-16 Jan-17 Jan-18 Jan-19 Jan-20 Jan-21 Jan-22 Jan-23 Jan-24 Jan-25 Jan-26 Jan-27 Jan-28 Jan-29
Elba Island
Sabine Pass
Corpus Christi
Cameron
Freeport
Calcasieu Pass
Golden Pass
Plaquemines
Corpus Christi Stage III
Port Arthur
Rio Grande
ForecastActual

15.17
16.05
17.05
18.13
19.24
20.29
21.27
13.10
14.73
16.37
17.78
19.07
20.34
21.41
5.06
5.49
5.80
5.95
6.20
6.53
6.82
22.21
23.74
21.75
21.20
21.43
22.37
23.11
33.61
34.46
35.24
35.95
37.43
38.92
39.69
94.7
100.1
102.2
105.2
109.8
115.2
119.2
0
20
40
60
80
100
120
140
2022 2023 2024 2025 2026 2027 2028
L48 Production (Bcf/d)
APP NE
Bakken
Other
DJ/Powder
Eagle Ford
Haynesville
Permian
Powder
DJ
Total Production
Production Forecast by Basin

System Flows
❑ Remains the same
❑ High utilization moving gas from
Marcellus/Utica, both South and East
❑ Traditional bottleneck into New
England remains
❑ Steady exports to Canada
❑ Recent Trends
❑ Power growth - PJM in particular
❑ Growing LNG exports
❑ Texas becomes a swing market
common constraint

Looking Forward – What Will Influence the S/D
Balance?
3.9 Bcf/d
4.2 Bcf/d
3.3 Bcf/d
New Cross-TX PL
+4.5 Bcf/d
Haynesville PL
+5.2 Bcf/d
Supply Demand Balance (2023 to 2028)
❑ Supply to E-TX/W-LA (+9.8 Bcf/d)
❑ New Permian to Gulf Pipes will
add 4.5 Bcf/d
❑ Haynesville adds 5.3 Bcf/d
❑ LNG Demand (+11 Bcf/d)
❑ 4.8/d in TX
❑ 2.4/d in W LA
❑ 3.9/d in E LA
❑ New pipe projects will move 5.36
Bcf/d from N LA to W LA
❑ Significant deficit of Gas in Gillis to
Plaquemines coastal corridor
❑ Over 3 Bcf/d more capacity needed
to S LA – especially SE LA
Southeast (‘23-27)
Power: 7.58 Bcf/d (+1.40 Bcf/d)
Res/Comm: 2.22 Bcf/d (+0.2 Bcf/d)
Industrial: 2.78 Bcf/d (+.206 Bcf/d)

Winter Weather Prediction

BUSINESS DEVELOPMENT UPDATE
Preston Troutman
Director – Business Development

Market Opportunities
LNG Export
Power
Northeast
Haynesville
Power
Permian
▪ Continued interest in expansion opportunities
▪ LNG Export
▪ Power Generation
▪ Support for renewables
▪ Coal retirement
▪ Increased utilization of existing assets
▪ Supply push projects

Announced Capital Projects
Successfully Executing on Projects in Key Areas
$1 Billion Backlog – primarily market pull
Northeast
Volume
(MDth/d)
In-
Service
East 300 115 2023
LNG Export
Volume
(MDth/d)
In
-Service
Evangeline Pass 2,000 24/25
Power Generation
Volume
(MDth/d)
In-
Service
Cumberland 245 2025
Sunnyside Supply
30 2024
Mexico
Volume
(MDth/d)
In-
Service
South Texas *345 2023

• Energy Transition
• Supply/Demand dislocation
• Optimization of existing assets
Demand on the Horizon
More Gas-fired generation
0
5
10
15
20
25
30
35
Bcfd
LNG Exports
North America is a net exporter
U.S. +13.9 Bcfd
Can. & Mex. +4.9 Bcfd
0
10
20
30
40
Bcfd
U.S. Power Gen Demand
+4.4 Bcfd
0
10
20
30
40
50
Bcfd
U.S. Res/Ind Demand
Residential & Industrial growth
Res +0.8 Bcfd
Ind +1.3 Bcfd
0
2
4
6
8
10
12
Bcfd
Exports to Mexico
More U.S. Exports to Mexico
Net Demand +2.1 Bcfd
LNG +2.7 Bcfd
Thank You

OPERATIONS UPDATE
Rob Perkins
Vice President – Gas Control

TGP System Update
▪ System wide flows and throughput
▪ Winter Review
▪ Summer Review
▪ Operations expectations
TGP System Overview
100 Line
800 Line
500 Line
200 Line
300 Line
200 Line
87
1
315
245
261
823
527
860
40
204
219
Bear Creek
Colden
Hebron-Ellisburg-Harrison
267
9
110
321
Rivervale
Mahwah
➢ ~11,750 miles of pipe
➢ Active supply/delivery meters ~700
➢ Storage capacity ~117 bcf
➢ Direct connected power ~26,000 MW
➢ LNG deliveries to Cameron, Corpus Christi & Freeport
➢ Mexico exports currently averaging ~0.4 bcf/d

TGP System Overview
Deliveries by Type
Total = 10.71 MMDth/d
Total = 10.44 MMDth/d

TGP System Overview
Deliveries by Zone

TGP System Overview
Receipts by Zone

Winter Review
▪ Overview
▪ Overall mild winter weather with a few periods of extreme weather
▪ System-wide throughput dipped 4% compared to previous winter
▪ Winter Peak was ~12.98 MMDth on February 3, 2023
▪ Power Demand Peak was ~2.77 MMDth/d on December 23, 2022
▪ Supply
▪ Supply in Zone 4 continued to provide 50+% of total system supply this past winter (~5.6
MMDth/d)
▪ Storage withdrawals averaged 0.28 MMDth/d with a peak of 1.56 MMDth
▪ Operational Challenges
▪ h

Winter Review –Weather
*Normal is a 30-year average

Winter Review – Deliveries by Type
2020-2021 2021-2022 2022-2023
YoY Change
LDC
2,079 2,089 1,936 -7%
Power
1,381 1,558 1,626 +4%
Interconnects
5,312 5,593 5,837 +4%
Mexico
802 565 382 -32%
LNG
1,480 1,705 1,218 -29%
Industrial
49 50 63 +25%
TOTAL
11,103 11,559 11,061 -4%

Winter Review – East of Station 261

Winter Review – Storage Withdrawals
~20 Bcf more
storage inventory
withdrawn in
2021/2022 winter
than in 2022/2023

Winter Storm Elliott Summary
▪ Overview
▪ Tennessee system was in good shape heading into the weather event beginning on 12/23/22
▪ Experienced significant supply shortage overnight on 12/23/22 and into 12/24/2022
▪ Scheduling restrictions were responsive and implemented Location Off Rate cuts intraday on
12/24/2023
▪ Linepack dropped close to 2 bcf (~15%) in 12 hours due to supply shortages and peaking
demand related to the extreme weather
▪ Resulted in lower than normal operating pressures across much of the pipeline until recovery
began on 12/26/2022 when demand began to wane
▪ Pipeline and storage facilities performed well throughout the event with no significant
weather related outages

Summer Review
▪ Overview
▪ System-wide throughput through July down 2% to previous summer
▪ Maintenance planning and execution continues to be challenging
▪ Demand
▪ Strong demand across the pipeline once again
▪ Similar demand to 2022 in all delivery sectors

Summer Review – April through July
2021 2022 2023 Change
LDC
1,060 1,079 1,059 -2%
Power
1,489 1,820 1,780 -2%
Interconnects
5,141 5,374 5,293 -1%
Mexico
846 550 572 +4%
LNG
1,407 1,422 1,332 -6%
Industrial
47 44 65 +46%
TOTAL
9,990 10,289 10,101 -2%

Summer Review - Weather
▪ Strong 2023 power gen despite normal to
mild summer across much of the system
▪ 2023 average daily summer power generation
deliveries are 2
nd
highest behind only 2022
*Normal is a 10-year average
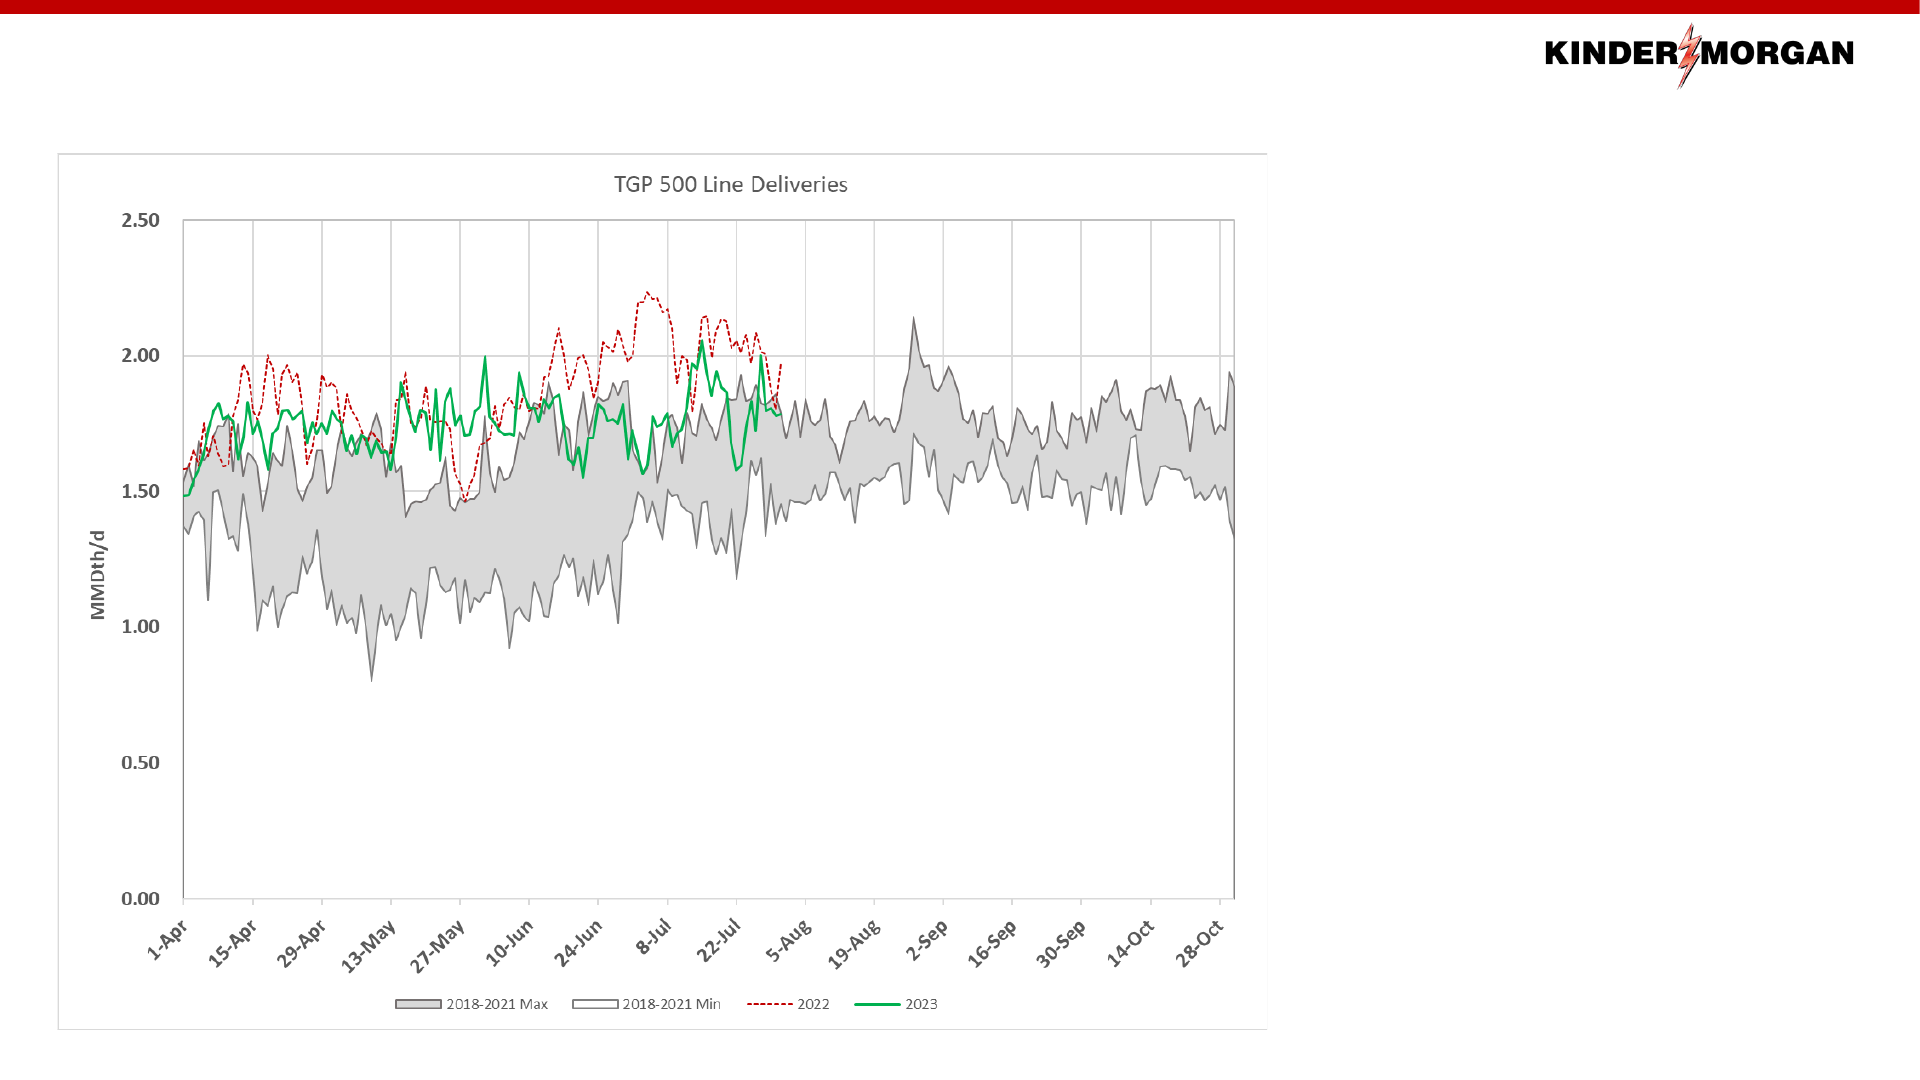
Summer Review
▪ 500 Line summer
deliveries lower than 2022,
however still on the higher
end of historic demand

2023 TGP Maintenance Summary
Zone
L
Zone
0
Zone 2
Zone 3
Zone 4
Zone 5
Zone 6
x
x
x
x
x
x
x
x
▪ High load factor and magnitude of
required maintenance continues to be
challenging
▪ Significant year round effort in
planning and coordinating projects to
minimize impacts as much as possible
Red “X” indicates segment maintenance with a duration
longer than 1 day with a capacity impact greater than 100
mmcf/d

Summer Review – Storage Activity
~7 bcf more storage
inventory injected
through July in 2023
than 2022

Operational Expectations
▪ Continued high utilization system wide
▪ LNG demand is high utilization with no seasonality – increasing load factor in
southern segments
▪ Zone 6 East of Station 261 will continue at capacity during typical winters
▪ Storage injections will be challenging to manage as summer demand wanes
▪ Scheduling maintenance and outages continues to be challenging
▪ Significant coordination effort to minimize customer impact
▪ Multi-year analysis when scheduling known major outages
▪ Continued maintenance and integrity efforts ensure reliability
▪ Routine PHMSA required inspections and maintenance
Kinder Morgan provides energy transportation and storage services
in a safe, efficient and environmentally responsible manner for the
benefit of people, communities and businesses.

TGP Operations Contact List
Gas Control
24 hour and emergency
800-231-2800
Gas Control Manager - Open
Layne Sanders – Director
713-420-5024
Cell – 832-563-5024
Brian Merchant – VP, Gas Control
713-420-5867
Cell – 713-206-0590
Rob Perkins – VP, Pipeline
Management
713-420-5229
Cell – 205-527-0650
Transportation and Storage
24 hour Scheduling Hotline
713-420-4999
Cathy Soape – Manager
713-420-3814
Cell – 713-922-5083
Adam Harris – Manager
713-420-2672
Cell – 281-389-0024
Jennifer Spiller – Manager
713-420-5207
Cell - 832-731-1207
Katie Cornutt – Director
713-420-5648
Cell - 407-902-8027
Gina Mabry – VP
713-420-3685
Cell – 281-744-8666
Commercial/Marketing
Mark Wilson - Director
713-420-7205
Cell – 205-447-2589
Ernesto Ochoa – VP
713-420-1734
Cell – 281-414-3823
Kimberly Watson –
President
713-369-9233
Cell – 713-204-5423
Field Operations
Ron Miller – Director (Northeast)
724-662-6422
Cell – 713-829-2919
Joseph Simonsen – Director (Central)
615-221-1513
Cell – 928-699-0753
Chris Bradberry – Director (Southeast)
205-325-7277
Cell – 205-567-0777
Jess Coleman – Director (South)
701-648-9361
Cell – 701-648-9361
Ron Bessette– VP
713-420-6012
Cell – 413-313-4380
Ken Grubb –COO Gas Pipelines
713-369-8763
Cell – 713-702-1210

REGULATORY UPDATE
Dave Dewey
Vice President – Regulatory Affairs
August 24, 2023

The Federal Energy Regulatory Commission
41
The Commissioners
FERC Developments
◼ Chairman Glick’s term expired in 2022 and he left the Commission
◼ No further developments on nominees for a fifth FERC Commissioner
◼ Commissioner Danly’s term expired June 30, 2023 – Potential for a “package deal”
◼ Danly may serve until Congress adjourns at the end of 2023
◼ There are whispers that Commissioner Danly may not be seeking an additional term
◼ One of the best four-member Commissions in the agency’s history (so far)
FERC Outreach
◼ We invest significant time and effort with our regulators
◼ We focus on being solutions oriented
◼ Good regulatory relationships enable us to provide increased value to our customers
Commissioner
Christie
Commissioner
Danly
Chairman
Phillips
Commissioner
Clements
Possible nominees for fifth
FERC Commissioner
◼ Judy Chang – Former Undersecretary
of Energy & Climate Solutions /
Massachusetts Executive Office of
Energy & Environmental Affairs
◼ Matthew Christiansen – Current FERC
General Counsel
◼ Rick Kessler – Senior Democratic
adviser for the House Energy and
Commerce Committee

Rebalancing the Value Proposition
42
Certificating Transportation Infrastructure
◼ September 1999 – FERC issues certificate policy statement to provide industry certainty
◼ Works flawlessly for almost two decades
◼ February 2018 – FERC decides it wants to revisit its certificate policy statement
◼ February 2022 - Updated Certificate Policy Statement and Interim GHG Policy Statement
◼ New policy statement is essentially a balancing test with a heightened emphasis on (1)
need, (2) analyzing adverse effects, and (3) environmental justice
◼ Project sponsors are responsible for avoiding direct and indirect impacts to the greatest
extent possible
◼ March 2022 – Converted the new policy statements to drafts
Creating Services Customers Need
◼ Renewable Energy = Intermittency
◼ Solutions to Intermittency → Storage, Hourly Services
◼ FERC’s 2nd New England Winter Gas-Electric Forum (June 20, 2023)
◼ Highlighted deep divisions in policymakers’ and stakeholders’ views on energy
Envisioning Services Customers Want
◼ How can we help you to meet your reduced carbon intensity goals & mandates?
◼ Certifying the pipeline
◼ Reducing the carbon intensity of the transportation path
◼ How do we unlock the value proposition?
What problem are we trying to solve?
Canadian
Wildfires
CO
2
Emissions Map

Environmental Justice
43
Roundtable on Environmental Justice and Equity in
Infrastructure Permitting
◼ On March 29, 2023, the FERC held a Commissioner-led roundtable to discuss
environmental justice and equity in its jurisdictional infrastructure permitting
processes
◼ Panel 1: Priorities for Advancing Environmental Justice and Equity in Infrastructure
Permitting
◼ Panel 2: From the Front-Line: Impacted Communities and their Everyday Challenges
◼ Panel 3: Identifying, Avoiding, and Addressing Environmental Justice Impacts
◼ Kinder Morgan participated on Panel 3
◼ Some calls to block pipeline infrastructure solely on the basis of environmental justice
◼ Chairman Phillips encouraged all the feedback but cautioned that FERC has to act
within the law and said a lot what was raised is “nonjurisdictional.”
◼ “We have to approve things that are brought to us and fit within that law” and FERC’s
precedents, he said. “That is a part of the job of FERC whether you like it or not.”
Responsible Infrastructure Development Is Imperative
◼ The industry has always been a good neighbor
◼ There are opportunities for us to be even better
Mountain Valley Pipeline
◼ October 2015 – Certificate application filed
◼ October 2017 – FERC certificate issued
◼ Early-2018 – Construction began (projected
in-service late-2019)
◼ 2018-2023 – Multiple judicial appeals &
stays (primarily 4
th
Circuit Court of Appeals)
◼ July 27, 2023 – U.S. Supreme Court paves
the way for completion of the project
◼ Did the Mountain Valley Pipeline Project
truly affront environmental justice in the
region?

General Legislative/Regulatory Developments
44
Lower Energy Costs Act
◼ On March 30, 2023, the House of Representatives approved by a bipartisan vote H.R. 1,
the Lower Energy Costs Act → First major legislative initiative in the 118
th
Congress
◼ Possesses the ability to improve federal permitting processes for interstate natural gas
pipelines, as well as other energy infrastructure projects.
◼ Clarifies the scope of an agency’s National Environmental Policy Act (NEPA) analyses on
proposed projects and its focus on feasible alternatives
◼ Strengthens the FERC’s primary permitting role on natural gas infrastructure
◼ Recognizes the export of natural gas as being in the public interest
◼ Unlikely to pass in the Senate
Good Neighbor Rule
◼ Environmental Protection Agency (EPA) rule promulgated on March 15, 2023
▪ Aimed at significantly reducing smog-forming nitrogen oxide pollution from power plants
and other industrial facilities in 23 states
▪ Also includes natural gas pipeline compressor stations
▪ The rule as currently written requires compliance by May 1, 2026
◼ Cost of compliance for Kinder Morgan and Tennessee is material
◼ Tennessee has ~200 units impacted by the Rule
◼ Actual compliance timeline projected to extend to more than 6 years
◼ Litigation has been commenced by Kinder Morgan, INGAA, and numerous other parties

What’s on the Horizon?
45
Certainty & Stability
◼ Aiming for a new settlement and moratorium to afford customers, shippers,
and Tennessee a renewed period of regulatory certainty and stability
◼ Certainty and stability provides stakeholders an opportune window of time
to collaborate on future needs
Political Challenges
◼ The climate in Washington, DC is presenting headwinds for the natural gas
and fossil fuels industries
Opportunities
◼ The challenges presented by the winter of 2013-2014 (one of the coldest on record), the Polar Vortex (2019), Winter Storm Uri
(2021), and Winter Storm Elliott (2022) demonstrate the need for natural gas and reliable transportation/storage infrastructure
◼ Americans are embracing renewable energy
◼ 67% of U.S. adults prioritize…
◼ developing alternative energy sources, such as wind and solar, over expanding the production of oil, coal and natural gas
◼ taking steps to become carbon neutral by 2050
◼ At the expense of affordability? Reliability?
◼ The Institute for Energy Research estimates that wind power is about twice as expensive as conventional gas-fired power, and
that solar power is almost three times as expensive
Path toward Solutions
◼ How can we collaborate to shape the views of policymakers (particularly at the state level)?
◼ How can we tailor services to better meet your needs?
