
Congressional Research Service ˜ The Library of Congress
CRS Report for Congress
Received through the CRS Web
Order Code RL32025
Iraq’s Trade with the World:
Data and Analysis
Updated September 23, 2004
Vivian C. Jones
Analyst in International Trade and Finance
Foreign Affairs, Defense, and Trade Division
Iraq’s Trade with the World: Data and Analysis
Summary
In the last 25 years, Iraq’s economic involvement in the world market has
fluctuated dramatically — fluctuations brought about, in part, by damage to its oil
infrastructure during the Iran-Iraq War of the 1980s, followed by a multinational
military response and years of multilateral economic sanctions as a result of its 1990
invasion of Kuwait.
Economic stability in Iraq has depended on exports of crude oil since the end
of World War II. Exports of oil accounted, on average, for 83% of Iraq’s annual
exports from 1980-1990 and virtually all exports since 1996. When international
economic sanctions were imposed in August 1990, Iraq’s oil sales dropped from
$10.2 billion in 1990 to $305 million in 1991. From 1991 to 1995 the regime of
Saddam Hussein declined to accept United Nations (U.N.) proposals seeking to
permit Iraq to sell limited quantities of oil to meet the needs of its people. Without
oil export revenues, living conditions in the country deteriorated sharply.
In 1996, the Iraqi government agreed to the establishment of a United Nations-
administered Oil-For-Food Program (OFFP) that has allowed the Iraqi government
to export limited amounts of oil and import food and humanitarian supplies under
close supervision. On May 22, 2003, the U.N. Security Council adopted Resolution
1483, lifting all civilian trade sanctions on Iraq, providing for the termination of the
OFFP.
Since Iraq’s chief export product is crude oil, the country’s economic future, at
least in the short term, will depend on its ability to tap into its vast oil resources.
According to U.S. Department of Energy statistics, Iraq has 112 billion barrels of
proven oil reserves, and possible reserves of as much as 220 billion barrels. Due to
years of war combined with the excesses of the Hussein regime, its oil potential has
been largely unexplored and only 17 of 80 discovered oil fields have been developed.
Despite concerns over continued insurgent activity and the stability of the
interim government that have scared away much foreign investment by major
corporations, the Bush Administration officials and others report that Iraq’s economy
is booming. The U.S. government is engaged in efforts to attract small and medium
U.S. businesses to work and invest in the country as subcontractors on U.S.
government contracts and in the private sector. The United States has lifted most
international trade sanctions with respect to Iraq in keeping with United Nations
Security Council Resolution 1483, and has designated Iraq as a beneficiary
developing country under the Generalized System of Preferences.
This report provides detailed trade statistics on Iraq’s trade with the world from
1980 to the present, highlighting its major trading partners and regional trade
linkages. Data on U.S. trade with Iraq for 2003 and 2004 to date are also provided.
The report will be updated as events warrant.
Contents
Introduction ......................................................1
Background ......................................................2
Sanctions and the Oil-For-Food Program ...........................3
Iraq’s Exports.....................................................4
Iraq’s Oil Resources............................................6
Condition of Infrastructure...................................7
Post-War Situation.............................................7
Iraq’s Imports.....................................................9
Post-War Situation............................................12
Illicit Trade ......................................................13
Post-War Situation............................................14
Major Trading Partners ............................................14
Pre-War International Interests ..................................15
Russia..................................................15
France..................................................16
United States ............................................17
Asia ...................................................17
Pre-War Regional Trade .......................................18
Jordan..................................................18
Turkey .................................................19
Syria...................................................19
Other Regional Trade......................................19
Post-War Trade and Investment Prospects .........................20
U.S. Economic and Trade Policy.....................................21
Current State of Iraq’s Economy .................................22
Exim Bank and OPIC Facilitation ............................24
Normalizing Trade Relations....................................24
Generalized System of Preferences ...............................26
Conclusion ......................................................27
Appendix: Trade Tables ...........................................28
List of Figures
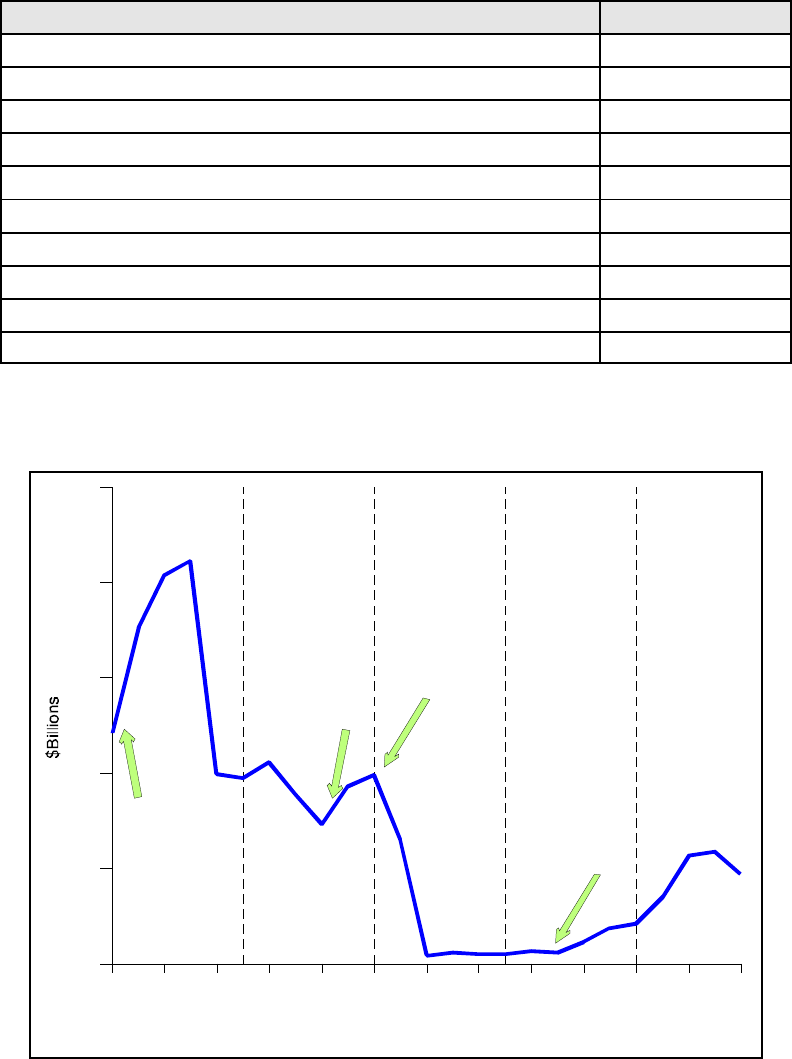
Figure 1. Iraq’s Oil Exports, 1980 to 2003 ..............................5
Figure 2. Iraq’s Exports of Crude Oil, 1996 to 2003 ......................6
Figure 3. Iraq: Monthly Oil Production and Exports, May 2003-July 2004 ....9
Figure 4. Iraq’s Imports, 1980 to 2003 ................................10
List of Tables
Table 1. Iraq’s Top 10 Exports, 1989 ..................................4
Table 2. Iraq’s Top 10 Imports, 1989 .................................10
Table 3. Iraq’s Major Imports, 1979-1983 .............................11
Table 4. Iraq’s Oil-For-Food Imports by Sector, 1997-2002 ...............12
Table 5. Iraq’s Top 10 Export and Import Trading Partners, 2003 ...........15
Table 6. Top U.S. Imports from Iraq, 2003 and January-July 2004 ..........28
Table 7. Top 30 U.S. Exports to Iraq, 2003 and January- July 2004 .........30
Table 8. Iraq: Top 30 World Export Commodities, 1980-1988 ............33
Table 9. Iraq: Top 30 World Import Commodities, 1980-1988 ............35
Table 10. Iraq: Top 30 World Export Commodities, 1990-2003 ...........37
Table 11. Iraq: Top 30 World Import Commodities, 1990-2003 ............40
Table 12. Iraq’s Major Trading Partners, 1982-2003 .....................43
Table 13. Iraq’s Regional Trade: 1982-2003 ...........................46

1
S/RES/661, August 16, 1990.
2
National Commission on Terrorist Attacks Upon the United States, Final Report, July 22,
2004, p. 378-379.
3
Ibid., p. 367.
Iraq’s Trade with the World:
Data and Analysis
Introduction
Iraq’s involvement in world trade has varied dramatically in the last 25 years.
These fluctuations have been caused, in part, by the effects of the Iran-Iraq War
(1980-1988), and the influences of Iraq’s 1990 invasion of Kuwait, including a
multinational military response. International economic sanctions were imposed
following the invasion pursuant to United Nations Security Council Resolution 661.
1
From 1996 until the end of the regime of Saddam Hussein, exports and imports were
closely regulated through a U.N.-authorized Oil-For-Food Program (OFFP) that
permitted the Iraqi government to sell limited quantities of oil in order meet the needs
of its people for food and humanitarian supplies. The OFFP officially terminated its
operations on November 21, 2003, in keeping with U.N. Security Council Resolution
1483.
International trade and economic development are essential to Iraq’s recovery
from war, from decades of repression, and from the adverse effects of international
sanctions. Many in Congress and the Bush Administration believe that
reconstructing Iraq, including assisting in the restoration of its economic systems,
is a compelling U.S. national interest. This was emphasized in the final report of the
National Commission on Terrorist Attacks Upon the United States (informally
known as the 9/11 Commission). The Commission recommended that “a
comprehensive U.S. strategy to counter terrorism should include economic policies
that encourage development, more open societies, and opportunities for people to
improve the lives of their families and to enhance prospects for their children’s
future.”
2
The 9/11 Commission also cautioned that if “Iraq becomes a failed state,
it will go to the top of the list of places that are breeding grounds for terrorism at
home.”
3
Iraq’s economic success, at least in the short term, is dependent on its ability to
export crude oil, which accounted for 83% of all exports from 1980-1989 and
virtually all exports since 1996. However, continuing insurgent attacks against oil
facilities have reduced post-war oil export flows. Extensive investment in the
rehabilitation of Iraq’s oil facilities is also required before pre-sanctions production
levels are realized and new production can be developed.

CRS-2
4
“Middle East Oil and Gas,” Exxon Background Series, December 1984, p. 12.
5
The $17.5 billion figure is based on trade data collected by the United Nations. The $21
billion figure is based on the International Monetary Fund Direction of Trade Statistics
series.
6
Sluglett, Marion F. and Sluglett, Peter, Iraq Since 1958: From Revolution to Dictatorship,
New York: KPI, p. 265.
This report first provides an analysis of Iraq’s trade with the world from the
Saddam Hussein’s assumption of the presidency in 1999 to the present. Iraq’s
exports (especially its oil resources), primary imports, major trading partners, trade
during the U.N. sanctions period, and alleged illicit trade during that period are
discussed. Second, the report discusses the progress of largely U.S.-driven economic
development initiatives in Iraq, and the continued process of normalizing Iraq-United
States trade relations. Third, an appendix provides comprehensive tables on Iraq’s
exports, imports, major trading partners, and regional trade.
Background
Since the beginning of Saddam Hussein’s regime in 1979, distinct patterns can
be seen in Iraq’s international trade relationship with the world that seem to coincide
with its domestic history. The first pattern corresponds to the beginning of the Iran-
Iraq War, beginning in 1980 and ending in 1988. In 1979, just prior to the war, oil
production had reached an all-time high of 3.5 million barrels per day (bpd),
decreased to 2.5 million bpd in 1980, and plummeted to less than 1 million bpd in
1983.
4
Imports during the same time period soared from about $8.5 billion in 1979
to about $17.5 - $21 billion in 1982 and 1983.
5
Some of the increase in that period
may be due to imports of dual-use (items with military and civilian uses)
commodities, but such a marked increase in imports might also have signaled that the
government and Iraqi industries were less able to produce food and goods
domestically in a wartime environment. By 1984, imports decreased dramatically as
the effects of the war caused Iraq’s economy to contract. The cost of living rose
sharply, the dinar was devalued, and the government and other organizations began
to fall behind in payments to foreign contractors.
6
Another period emerged after the end of the war in August 1988, when both
exports and imports increased slightly until international economic sanctions were
imposed directly after Iraq’s invasion of Kuwait in August 1990. Between 1990 and
1997 international trade virtually collapsed as both exports and imports hovered
between $300-$ 600 million per year.
The third pattern in Iraq’s international trade begins after the implementation
of the Oil-for-Food Program. Between December 1996 and 1998, oil exports were
limited to certain levels, and all exports were closely regulated by the United Nations
until the ending of international sanctions in 2003. Similarly, imports during this
time period were limited to food, humanitarian, and medical necessities. Imports
during this period ranged from $2 to $5 billion and exports from $5 to $14 billion.

CRS-3
7
CRS Report RL30472, Iraq: Oil-For-Food Program, International Sanctions, and Illicit
Trade, by Kenneth Katzman.
8
United Nations, Security Council. Letter Dated 20 May 1996 From the Secretary-General
Addressed to the President of the Security Council. Document No. S/1996/356.
9
United Nations. Report of the Secretary-General pursuant to paragraphs 7 and 8 of
Resolution 1409 (September 2002), Document No. S/2002/1239, November 12, 2002.
10
The thirteen phases were as follows: I, December 10, 1996 to June 7, 1997; II, June 8,
1997 to December 4, 1997; III, December 5, 1997 to May 29, 1998; IV; May 30, 1998 to
November 25, 1998; VI, November 26, 1998 to May 24, 1999, extended until December 11,
1999; VII, December 12, 1999 to June 8, 2000; VIII, June 9, 2000 to December 5, 2000; IX,
December 6, 2000 to June 3, 2001, extended until July 30, 2001; X, July 4, 2001 to
November 30, 2001; XI, December 1, 2001 to May 29, 2002; XII May 30, 2002 to
November 25, 2002, extended until December 4, 2002; and XIII, December 5, 2002 to
program suspension on March 17, 2003.
Sanctions and the Oil-For-Food Program
In August 1990, the U.N. Security Council adopted Resolution 661, imposing
comprehensive economic sanctions following Iraq’s invasion of Kuwait. From 1991
to 1995, Iraq declined to accept U.N. proposals to allow Iraq to sell limited quantities
of oil to meet the needs of its people because the Hussein regime believed that these
proposals infringed on Iraq’s sovereignty and were limited in scope. The U.N.
Security Council made repeated efforts during the period to alleviate human suffering
in Iraq while pressing Iraq to comply with all relevant U.N. Security Council
resolutions. Without oil export revenues, Iraq could not import sufficient quantities
of food and medical supplies, and living conditions in the country reportedly
deteriorated sharply.
7
On April 19, 1995, the U.N. Security Council adopted Resolution 986, which
proposed that Iraq be permitted to export $2 billion worth of oil every six months so
that the Iraqi government could use the proceeds of the oil sales to purchase food,
medicines, and other humanitarian supplies to meet the needs of its people. Iraq and
the Security Council signed a memorandum of understanding on the implementation
of the Oil-For-Food Program (OFFP) on May 20, 1996 and the first Iraqi oil exports
began on December 10, 1996.
8
The first shipments of food arrived in Iraq in March
1997, followed by imports of medicines in May 1997. From the program’s inception
until its suspension in March 2003, approximately $26.8 billion worth of food,
humanitarian supplies, and equipment was delivered to Iraq under the program.
Nearly 60 percent of the Iraqi population were, to some extent, dependent on monthly
food baskets received under the OFFP.
9
A complete discussion of the Oil-For-Food
Program is found in CRS Report RL30472, Iraq: Oil-For-Food Program,
International Sanctions, and Illicit Trade, by Kenneth Katzman.
The U.N. Security Council continued the Oil-For-Food Program in 180-day
periods known as “phases.” The first phase ran from December 10, 1996 to June 7,
1997. The last pre-war oil exporting period was phase thirteen, which came into
effect on December 5, 2002 and was scheduled to run through June 3, 2003.
10
Iraq’s
exports of crude oil during this period are shown in Figure 3 (p. 9).

CRS-4
11
Sluglett, M. & Sluglett, P. Iraq Since 1958: From Revolution to Dictatorship. New York:
KAI Limited, 1987, p. 35.
12
Economist Intelligence Unit (EIU) calculations.
On May 22, 2003, the Security Council adopted Resolution 1483, lifting all
economic sanctions on Iraq, with the exception of arms and related military supplies.
The resolution provided for the termination of the OFFP within six months, and the
transfer of all remaining transactions under the program to the Coalition Provisional
Authority (CPA, referred to in the resolution as “the Authority”). In keeping with
Resolution 1483, the OFFP terminated its operations on November 21, 2003.
Iraq’s Exports
Iraq entered the global trade marketplace in the mid-1800s as an exporter of
grains and cereals. As early as the 1930s, however, crude oil became its major export,
and exports of crude accounted for 49.3% of national income by 1953.
11
In the
1980s, crude oil represented 83% annually of all Iraqi exports.
12
Non-petroleum
export products in the 1980s included portland cement, fruit (mainly dates),
fertilizers, and reaction engines. Table 1 illustrates Iraq’s top export products in
1989, the year before the initiation of economic sanctions.
Table 1. Iraq’s Top 10 Exports, 1989
SITC Rev 3 Commodity Million $
3330-Crude oil $11,545.4
3344-Fuel oils, nes $211.3
3343-Gas oils $119.8
3341 — Gasoline and other light oils $78.8
2741- Sulfur of all kinds $39.2
6612-Portland cement $35.7
0579-Fruit, fresh or dried, nes $30.8
5629-Fertilizers, nes $29.6
7144-Reaction engines $29.2
5222-Chemical elements, nes $27.7
Source: United Nations Trade Data
nes=not elsewhere specified.
When economic sanctions were imposed in August 1990, Iraq’s oil sales
dropped from $10.2 billion in 1990 to $305 million in 1991. From 1992 to 1995, oil
exports averaged between $500 and $600 million. Figure 1 illustrates the dollar
value of Iraq’s exports of crude oil from 1980 to 2003 as reflected in U.N. trade data.
In the year 2000, the highest level of exports achieved during the OFFP, the sharp

CRS-5
13
Department of Energy, Iraq Energy Chronology, 1980-February 2004,Energy Information
Administration, [http://www.eia.doe.gov/emeu/cabs/iraqchron.html].
14
CRS Report RL30472, Iraq: Oil-For-Food Program, International Sanctions, and Illicit
Trade, by Kenneth Katzman.
1980 1982 1984 1986 1988 1990 1992 1994 1996 1998 2000 2002
$0
$5
$10
$15
$20
$25
$30
Invasion of Kuwait;
International
Sanctions Imposed
U.N. OFFP
Implemented
Iran-Iraq War
Begins
Iran-Iraq War Ends
Source: U.N. trade data
Figure 1. Iraq’s Oil Exports, 1980 to 2003
rise in export value can also be attributed to a spike in oil prices between
December1999 and September 2000.
13
A closer look at Iraq’s exports between
December 1996 and March 2003 (see Figure 2) shows that despite periodic increases
in the oil export ceiling and the eventual rescission of the export ceiling in December
1999, Iraq’s oil exports often ran significantly below the permitted level of exports.
This was due, in part, to frequent disputes between Iraqi and U.N. officials over U.N.
efforts to end illicit surcharges placed on oil exports. In addition, Iraq sometimes
unilaterally interrupted the sale of oil to protest Security Council policy or to
challenge the United States and its allies. For example, Iraq suspended its oil sales
for the month of April 2002 in protest of Israel’s military incursion in the West
Bank.
14
Figure 2 illustrates Iraq’s semiannual oil exports under the OFFP
(December 1996-March 2003) by dollar value and by volume.

CRS-6
15
U.S. Department of Energy, Iraq Country Analysis Brief, Energy Information
Administration (EIA), p. 1. [http://www.eia.doe.gov/emeu/cabs/iraq.html].
16
United Nations, Security Council, Letter dated 6 June 2001 from the Secretary-General
addressed to the President of the Security Council, S/2001/566.
U.N. Phase Number
I II III IV V VI VII VIII IX X XI XII XIII
0
2
4
6
8
10
0
100
200
300
400
500
Value (Y1) Volume (right scale) (Y2)
Source: U.N. Office of the Iraq Programme
(180-day phases from Dec. 1996 - Mar. 2003)
$2 bill. Export Ceiling
$5.2 bill. Export Ceiling
Export Ceiling Lifted
Figure 2. Iraq’s Exports of Crude Oil, 1996 to 2003
Iraq’s Oil Resources
Since Iraq’s chief export product is crude oil, the country’s economic future, at
least in the short term, depends primarily on its ability to tap into its vast oil
resources. According to U.S. Department of Energy (DOE) analysts, Iraq has 112
billion barrels of proven oil reserves — second only to Saudi Arabia’s 260 billion
barrels of proven reserves — and possible reserves of as much as 220 billion barrels.
Due to years of war, economic sanctions, and mismanagement during the Hussein
regime, Iraq’s oil potential has been largely unexplored. Only 17 of 80 discovered
oilfields have been developed, and few deep wells have been drilled compared to its
neighbors. DOE analysts estimate that only 2,300 oil wells have actually been
drilled, and, of these, only 1,600 are currently producing oil.
15
Iraq’s all-time peak oil production was 3.5 million barrels per day in 1979, just
prior to the war with Iran. Output dropped sharply as the war began, but gradually
recovered to a similar level by 1989-1990. As a result of severe damage to the oil
industry infrastructure during the Gulf War, followed by economic sanctions, crude
oil production was reduced sharply to about 300,000 bpd.
16
From 1990 to the end of
1996, U.N. sanctions prohibited exports of oil, and oil production was limited to the

CRS-7
17
CRS Report RL31944, Iraq’s Economy, Past, Present, and Future, Jonathan E. Sanford,
Coordinator.
18
United Nations. Report of the Group of United Nations Experts Established Pursuant to
Paragraph 30 of the Security Council Resolution 1284 (2000), March 2000, p. 12.
19
U.S. Department of Energy, Iraq Country Analysis Brief, p. 4.
20
Energy Intelligence Group, “Iraq is Primed for Big Oil Opening,” Petroleum Intelligence
Weekly, March 12, 2003
21
United Nations. Report of the Group of United Nations Experts Established Pursuant to
Paragraph 30 of the Security Council Resolution 1284 (2000), March 2000, p. 12.
amount needed to meet internal demand, plus small amounts that may have been
illegally exported.
17
Condition of Infrastructure. Prior to the institution of the Oil-for-Food
Program, the oil infrastructure was partially repaired, but often by cannibalization
and short-term substitution of parts and without access to external equipment or
technology. The Security Council, after determining that the state of Iraq’s oil sector
was “lamentable,” allowed a limited amount of investment in equipment and spare
parts for basic maintenance of the oil infrastructure (a total of $3 billion from June
1998 to June 2001). However, according to the calculations of U.N. oil industry
experts, investment in Iraq’s oil sector from 1990 on was about $0.60 per barrel, in
contrast to the worldwide average of $1.50 per barrel. U.N. experts forecasted
declines in oil production from 5% to 15% per year if the oil infrastructure was not
improved.
18
The position of the United States and its allies during the sanctions
regime, however, was that OFFP funds should be used only for short-term
improvements, and not to make long-term repairs.
19
Oil industry experts assessed Iraq’s pre-war sustainable production capacity at
no higher than 2.8-2.9 million bpd. Conservative estimates for restoring the oil
sector to pre-1990 levels by 2006 range between $5.0-$6.0 billion. Prior to the 2003
war, the regime of Saddam Hussein had a blueprint in place for doubling capacity to
6 million bpd, with foreign oil companies playing a key role.
20
In order to reach this
potential, however, the regime acknowledged that Iraq’s oil sector would require
investment at all levels, including technical services, capital equipment, and
infrastructure.
21
Iraqi authorities estimated that the 6 million bpd target would
require an additional investment of at least $21 billion and would probably take 8 to
10 years to achieve after the lifting of international economic sanctions. Plans to
reach the target included further development of producing oilfields as well as
finding and developing additional fields in the Western Desert.
Post-War Situation
Even though Iraq’s oilfields were captured largely intact, the oil industry has
been hampered by post-war chaos and looting of its oil facilities. Damage and
continued sabotage to infrastructure, refineries, and mainline transport facilities have
slowed efforts to return exports to pre-war levels. Other difficulties in the oil supply
infrastructure, including electrical power and water supply, have further hindered

CRS-8
22
CRS Report RS21626, p. 2.
23
Watkins, E. “U.S. to Deploy Airborne Snipers to Protect Iraqi Pipelines,” Oil and Gas
Journal, October 13, 2003.
24
CRS Report RS21626, Iraq Oil: Reserves, Production, and Potential Revenues, by
Lawrence Kumins. “Sabotage Cuts Flow of Iraqi Crude to Ceyhan; Pipeline in Northern
Network Hit,” Platt’s Oilgram News, August 4, 2004.
25
The Iraq Relief and Reconstruction Fund was established by the FY2003 Emergency
Supplemental (P.L. 108-11). $2.5 billion was appropriated in this law for reconstruction
efforts.
26
“U.S. Army Corps of Engineers Awards Contracts for Repair of Iraq’s Oil Infrastructure,”
U.S. Army Corps of Engineers, News Release No. PA-04-03, January 16, 2004.
27
“Iraq Postpones Negotiating Upstream Deals; Repairs are Priority,” Oil Daily, July 16,
2004.
production.
22
Many observers believe that U.S. and Iraqi protection of oil pipelines
has been improving, and U.S. military commanders recently announced increased
surveillance measures including the deployment of airborne snipers to prevent future
acts of sabotage.
23
Nevertheless, attacks by insurgents on oil pipelines continue,
which has resulted in Iraq’s inability to sustain its prewar production and export
capacity on a regular basis (see Figure 3 on page 9).
Much of Iraq’s current oil production is also needed to meet domestic
consumption requirements, which averaged about 500,000 bpd pre-war, although
current requirements may be at least 100,000 bpd less. Iraqi refineries’ inability to
produce a sufficient supply of needed fuels to meet domestic demand led the CPA
to sponsor imports of gasoline and propane from other countries using U.S. funds.
These imports have continued beyond the transition of power and are paid through
the Development Fund for Iraq, now administered by the transitional Iraqi
government. Iraq is currently importing fuel from Syria, Kuwait, Jordan, Saudi
Arabia, and Iran at a cost of approximately $200 million per month.
24
Initial U.S. post-war reconstruction contracts in Iraq included two contracts for
oilfield repairs funded through the Iraq Relief and Reconstruction Fund.
25
The U.S.
Army Corps of Engineers awarded one contract for work on fields in the southern
area of Iraq to Kellogg, Brown, and Root (minimum value $500,000 - maximum
value $1.2 billion for the life of the contract), and one contract to Parsons Iraqi Joint
Venture (minimum value $500,000 - maximum value $800 million). These contracts
were issued to cover the cost of a range of services including extinguishing oil fires,
environmental assessments and cleanup of oil sites, oil infrastructure condition
assessments, engineering design and construction, oilfield pipeline and refinery
maintenance, procurement and importation of fuel products, distribution of fuel
products within Iraq, and technical assistance.
26
Within the next six months, the
Iraqi transitional government also plans to spend an additional $500 million to
supply its refineries with equipment, spare parts, and chemicals, and about $900
million on projects including oil wells and pipelines.
27
According to DOE statistics, Iraq crude oil production averaged 1.33 million
bpd in 2003, down from 2.04 million bpd in 2002, and 2.45 million bpd in 2001.

CRS-9
28
Wall Street Journal, “Iraq’s Oil Industry is Slowly Rebounding,” November 6, 2003.
29
“Iraqi Oil Exports Stabilized at 1.7 Million b/d,” Oil Daily, July 22, 2004.
30
Cooper, P.J. “Oil and Gas Briefs,” Financial Times, October 30, 2003.
Source: Brookings Institution Iraq Index
May 03
June 03
July 03
Aug. 03
Sept. 03
Oct. 03
Nov. 03
Dec. 03
Jan. 04
Feb. 04
March 04
April 04
May 04
June 04
July 04
0
0.5
1
1.5
2
2.5
Production Exports
Figure 3. Iraq: Monthly Oil Production and Exports,
May 2003-July 2004
According to OPEC statistics, Iraq’s production averaged 1.7 million bpd in June
2004, 1.9 million bpd in May, 2.38 million bpd in April, and 2.34 million bpd in
March. However, as much as 300,000 bpd of that production has reportedly been
reinjected into oil wells, due to lack of transportation routes from the northern fields
and because oil refineries in the region are not operating at capacity.
28
Nevertheless,
current crude loadings at Iraq’s Basra terminal stood at 1.6 million bpd in July
2004.
29
Iraq’s northern export pipeline remains inoperable due to repeated
sabotage.
30
Iraq’s Imports
Prior to the implementation of economic sanctions, Iraq’s primary imports
included food, motor vehicles, spare parts, iron and steel, and medicines. Table 2
provides Iraq’s top ten imports from the world in 1989, the year prior to the
implementation of international sanctions.
CRS-10
1980 1982 1984 1986 1988 1990 1992 1994 1996 1998 2000 2002
$0
$5
$10
$15
$20
$25
Invasion of Kuwait;
International
Sanctions Imposed
U.N. OFFP
Implemented
Source: IMF Direction of Trade Data
Iran-Iraq War
Begins
Iran-Iraq War
Ends
Figure 4. Iraq’s Imports, 1980 to 2003
Table 2. Iraq’s Top 10 Imports, 1989
SITC Rev 3 Commodities Mil. $
0412 — Wheat, nes $617.3
7843 — Parts and accessories of tractors and motor vehicles, nes $170.4
6793 — Iron and steel seamed tubes $160.9
0112 — Meat of bovine animals, frozen $144.6
7812 — Motor vehicles, nes $139.6
6791 — Iron and steel tubes and pipes $137.8
0423 — Rice $132.2
6762 — Alloy steel bars, rods, nes $130.7
5429 — Mendicaments, nes $124.5
6911 — Metal structures of iron or steel,nes $105.4
Source: U.N. Trade Data. Nes= not elsewhere specified.
Figure 4 illustrates the flow of Iraq’s imports from 1980-2003. Imports rose
rapidly in 1980, peaked in 1981, and continued at a high level until 1982. Major
import commodities during that period included large imports of commodities
officially reported as trucks, spare parts, and other machinery. These imports may
have been legitimate purchases of transportation vehicles, oil machinery, and spare
parts for upgrading and repairing Iraq’s oil production facilities; however, it is also

CRS-11
possible that some of these purchases were converted to military use during the Iran-
Iraq War, or that Iraq’s trading partners used these trade classification categories to
hide exports of armaments and military hardware to Iraq. Table 3 provides the top
import commodities for the period from 1979 to 1983.
Beginning in 1996, all approved imports to Iraq were monitored by U.N. staff,
who reviewed all contracts and ensured that imported goods were on a list of
commodities drafted by the U.N. Security Council. Besides food and humanitarian
supplies, the OFFP also allowed Iraq to import some transportation and
communications equipment, spare parts for oil rigs and other infrastructure, and
consumer goods. Table 4 shows Iraq’s cumulative imports by sector from 1997 to
2002 under the Oil-For-Food Program.
Table 3. Iraq’s Major Imports, 1979-1983
SITC Rev 1 Commodities
(millions of U.S. $)
1979 1980 1981 1982 1983
TOTAL — Total All
Commodities
8,628.1 12,073.8 17,495.1 17,386.5 8,601.0
7323 — Lorries, trucks 485.1 862.3 1,404.3 921.4 183.6
7184 — Const. ,mining
machinery
392.1 518.5 798.4 577.8 76.2
6911 — Structures & parts of
iron
325.5 333.9 640.2 792.7 275.3
7321 — Pass. motor veh. exc
buses
171.3 255.9 465.8 365.7 182.9
7328 — Motor vehicle parts 179.4 349.4 462.1 403.2 214.3
7221 — Electric power
machinery
147.0 199.6 399.9 411.3 229.0
7192 — Pumps, centrifuges 149.2 209.4 390.8 380.7 213.1
7125 — Tractors, non-road 95.0 141.4 357.2 139.2 29.9
7191 — Heating, cooling
equipment
143.4 237.9 355.8 342.9 132.7
7193 — Mechanical handling
equip.
159.6 212.6 298.3 236.7 80.9
6612 — Cement 23.4 68.9 296.7 178.9 99.8
7324 — Special motor vehicles 128.4 149.1 293.2 369.0 118.5
7249 — Telecommunications
equip.
175.8 236.9 289.9 616.7 456.9
7325 — Tractors for trailers 44.1 144.2 280.9 220.3 44.7
7231 — Insulated wire, cable 90.6 144.6 277.8 296.8 129.9
Source: United Nations Trade Data. Commodities are sorted in descending dollar value for the year
1981 (see italics), when Iraqi imports were at their highest level during the period.

CRS-12
31
Andrews, E. “After Years of Stagnation, Iraqi Industries are Falling to a Wave of
Imports,” New York Times, June 1, 2003. Sabbah-Gargour, R. “Arthur Daleys Flourish in
(continued...)
Table 4. Iraq’s Oil-For-Food Imports by Sector, 1997-2002
Sector
Value of Approved Sales
(U.S. $)
Food 13,505,896,754
Agriculture 3,733,280,193
Oil Spares 3,636,458,484
Electricity 3,538,554,784
Food Handling 3,312,345,268
Health 3,025,602,846
Housing 2,720,773,354
Communication/Transportation 2,016,400,979
Water and Sanitation 2,000,721,136
Education 1,146,527,169
Special Allocation 293,559,164
Industry 35,502,417
Religious Affairs 10,285,323
Justice 4,899,283
Construction 2,219,572
Source: United Nations. Office of the Iraq Program. Data are for the largest of the three accounts
in the Iraq Program.
Post-War Situation
Since the lifting of economic sanctions, Iraq has been flooded with new
products, including television sets from South Korea, refrigerators from Iran and
China, new and used cars from Japan and South Korea, and toasters from Germany.
Satellite telephones and portable kerosene stoves, needed because of the absence of
normal telephones and the current lack of cooking fuel, are so plentiful that prices
have declined. Satellite dishes, banned under the Saddam Hussein regime, are also
for sale. Consumers with money have a range of new choices, and the recent
appreciation of the Iraqi dinar has provided them with additional buying power.
Iraqi companies that have had almost no competition due to U.N. sanctions,
however, have had to face the full force of globalization and international
competition almost overnight. An unexpected appreciation of the dinar that made
foreign imports more attractive exacerbated the competitive challenges Iraq’s
manufacturers and state-run companies are facing. The free-market economy shocks
are of some concern to U.S. and British officials, who want to get people back to
work.
31
Despite these concerns, the private industry sector is reportedly experiencing

CRS-13
31
(...continued)
Duty-Free Zone, London Times, August 16, 2003.
32
Statements of Michael P. Fleischer, Former Director of the Private Sector Development,
Coalition Provisional Authority at Iraq Private Sector Development Briefing, August 4,
2004.
33
U.S. Department of Commerce, Business Guide For Iraq website, revised June 4, 2004,
[http://www.export.gov/iraq/bus_climate/businessguide_current.html#exporting].
34
General Accounting Office. Weapons of Mass Destruction: U.N. Confronts Significant
Challenges in Implementing Sanctions against Iraq, GAO Report Number GAO-02-625.
a vibrant recovery according to U.S. officials. Domestic company registration (the
equivalent of incorporation) has tripled to about 30 per day, and unofficial estimates
indicate that private sector employment is growing to encompass between 25% and
50% of all jobs.
32
Nevertheless, unemployment remains very high, estimated at 20 -
38%.
On September 19, 2003, the CPA established a reconstruction levy
(CPA/ORD/19 September 2003/38) which, as of January 1, 2004, placed a 5% tariff
on all imported goods except food, medicine and medical equipment, clothing,
books, and goods delivered as humanitarian assistance. U.N. entities, the CPA,
Coalition forces, nonprofit organizations, other international organizations, and
foreign governments will be exempt from the levy. All proceeds are to be used to
support Iraqi reconstruction efforts. According to U.S. Department of Commerce
figures, Iraq collected over $2.7 million in reconstruction levy fees between April
15, 2004, and June 4, 2004, implying that over $54 million in non-exempt imports
entered Iraq during the same time period.
33
Iraq’s transitional government has kept
the reconstruction levy in place.
Illicit Trade
In the period during which economic sanctions were imposed, the regime of
Saddam Hussein reportedly conducted illicit oil deals with its neighbors and other
countries in order to generate funds that it could use without restriction. The regime
also allegedly imposed surcharges on oil buyers and solicited kickbacks from
suppliers of humanitarian and other civilian goods. Although there are no
authoritative figures for the value of Iraq’s illicit trade, a study released in May 2002
by the General Accounting Office (GAO) estimated that Iraq earned $6.6 billion in
illicit revenue from oil smuggling between 1997 and March 2001.
34
The GAO reported that Iraq smuggled oil through neighboring states, including
Syria, Turkey, and Jordan, and imported illicit and unapproved commodities through
numerous exit and entry points along its borders. Major illicit trade routes were said
to include an oil pipeline to Syria, truck routes through entry points on the Jordanian
and Turkish borders, and shipping in the Persian Gulf.
Prior to the war, U.S. officials were primarily concerned that Iraq might be using
these illicit revenues to purchase prohibited military and weapons-of-mass-

CRS-14
35
Ibid., p. 6.
36
Katz, L. M., “Iraq, U.S. Lock Horns Again.” United Press International, February 10,
2000.
37
“Iraq Making the Most of Porous Sanctions,” USA Today, November 7, 2002. Rieff, D.
“Were Sanctions Right?” New York Times Magazine, July 27, 2003.
38
“Iraq Postpones Negotiating Upstream Deals; Repairs are Priority,” Oil Daily, July 16,
2004.
39
Eckholm, Erik, “On Iraq’s Border, Sailors of the Desert Smuggle Subsidized Gasoline,”
New York Times, August 21, 2004, page A7.
40
Ibid.
destruction (WMD) technology. The GAO report also found, however, that the
sanctions may have been partially effective in deterring Iraq from obtaining most
conventional weapons.
35
In February 2000, the Clinton Administration accused the Iraqi government of
using financial resources gained from illicit trade to build nine lavish palaces, valued
at about $2 billion.
36
The second Bush administration concluded that international
sanctions were not effective, and accused Iraq of using illicit revenue to finance
active nuclear, chemical, and biological weapons programs.
37
Post-War Situation
Although illicit government fuel smuggling ended after the war, individuals are
now reportedly smuggling large amounts of fuel, apparently stimulated by lower oil
prices in Iraq relative to world market prices. Some smugglers are reportedly drilling
into pipes between the refinery and shipping terminals, according to Iraqi oil
officials.
38
Others are purchasing fuel in Iraq, filling up larger trucks and cars fitted
with extra fuel tanks, and driving across the border to Jordan where the subsidized
fuel can be resold at more than ten times the cost.
39
In addition, some gas station
owners with the rights to shipments of diesel fuel from Iraqi distribution companies
are reported to be paying drivers to divert the shipments of diesel to sell the
shipments to smugglers at a greater profit than can be received at their filling stations.
Coalition forces and the interim Iraqi government have tried to stamp out the fuel
smuggling, however, officials expect the smuggling to continue as long as the fuel
is subsidized at such a cheap rate relative to fuel prices elsewhere.
40
Major Trading Partners
As is the case with most oil-producing countries, many of Iraq’s leading pre-war
export trading partners were industrialized nations. In the post-war environment,
regional trading relationships, especially with Jordan and Morocco, have gained
importance. Certain trading relationships established during the OFFP period, such
as imports from Vietnam, have also increased. In 2003, Iraq’s top ten export trading
partners were the United States, Canada, Jordan, Italy, Morocco, Brazil, Spain, the
Netherlands, Japan, and Australia. In terms of Iraq’s imports, Jordan was its largest

CRS-15
41
United States Congress, House Committee on International Relations. Testimony on
Russia’s Policy toward Iran and Iraq, by C. Wallander of the Center for Strategic and
International Studies (CSIS), Washington, DC, February 25, 2003.
trading partner in 2003, followed by Vietnam, the United States, Germany, Russia,
the United Kingdom, France, Italy, Australia, and Japan. Table 5 shows Iraq’s top
trading partners in terms of imports and exports for 2003. Table 12 in Appendix B
provides trade statistics for Iraq’s major trading partners from 1982-2003.
Table 5. Iraq’s Top 10 Export and Import Trading Partners, 2003
Exports
(millions of U.S. $)
Imports
(millions of U.S. $)
United States $4,466.5 Jordan $693.1
Canada $797.7 Vietnam $537.8
Jordan $769.3 United States $347.2
Italy $724.5 Germany $253.2
Morocco $481.1 Russia $240.2
Brazil $398.4 United Kingdom $237.7
Spain $302.3 France $190.7
Netherlands $269.8 Italy $186.9
Japan $99.5 Australia $178.8
Australia $27.6 Japan $84.1
Source: International Monetary Fund, Direction of Trade Statistics.
Pre-War International Interests
Despite economic sanctions, several countries regarded Iraq as an important
trading partner and expressed concern before the war that their national interests
might be compromised if a newly-established Iraqi government is primarily
sympathetic to U.S. interests. These countries were concerned about lost trade and
possible loss of investment opportunities in Iraq’s oil sector.
Russia. Russia’s cumulative trade turnover with Iraq from 1997-March 2003
amounted to $7.7 billion. Iraq was an important trading partner to Russia because
certain exports were sold to Iraq that were not otherwise competitive in the global
market, including Volga cars, grain harvesters, and power generation equipment.
Russian analysts estimated that the industrial sector may lose as much as $2.5 billion
if contracts signed with the regime of Saddam Hussein fall through.
41

CRS-16
42
Feifer, G. “Russia: Proposed Economic Agreement with Iraq Raising Questions.” Radio
Free Europe/Radio Liberty, August 19, 2002.
43
Business Middle East, Economist Intelligence Unit (EIU), January 16, 2003.
44
“Focus: Oilfields Could Slip Out of Russia’s Reach,” Petroleum Economist, February 10,
2003.
45
Bostnavaron, F. “France Remains Iraq’s Leading European Trading Partner.” Le Monde,
September 13, 2002.
46
“Over 90 Companies Going to Baghdad Trade Fair — Iraqi Official,”Agence France
Presse, October 29, 2002.
47
Sluglett, M. & Sluglett, P. Iraq Since 1958: From Revolution to Dictatorship. New York:
KAI Limited, 1987, p. 288.
48
Marcel, Valerie, The Future of Oil in Iraq: Scenarios and Implications, The Royal
Institute of International Affairs, Briefing Paper No. 5, October 2002, p. 7
[http://www.riia.org].
In August 2002, Russia and Iraq signed a five-year “economic cooperation” and
trade agreement valued at $40 billion. The trade package called for cooperation in
several industry sectors, including oil, electricity, and railroads.
42
Russia and Iraq have signed numerous oil and gas agreements since 1997.
Russian firms had not started work on these projects, however, even though U.N.
officials had approved some of the contracts. Iraq’s oil ministry officials expressed
frustration with the inaction and, in January 2003, unilaterally terminated a major
contract with Lukoil, saying that the company had failed to fulfill its obligations
under the contract. The company called Iraq’s move “blackmail” and vowed to
contest the decision in court.
43
In spite of this setback, Russia held more oil contracts
in pre-war Iraq than any of its foreign competitors — a strategic advantage Russia
fears it might lose if Iraq’s government is replaced by a regime with greater
allegiance to the United States.
44
Russian oil companies, especially Lukoil, continue
to have an interest in bidding on oil contracts in Iraq, and are maintaining their
contacts with the Iraqi oil ministry to that end.
France. Iraq was an important market for French goods, especially in the
capital goods, automotive, and food processing sectors. Other pre-war French
exports to Iraq included industrial, telecommunications, and electrical equipment.
The regime of Saddam Hussein considered France such an important trading partner
that in March 2002, the Iraqi embassy in Paris opened a new trade section dedicated
to continued improvement of Iraq’s trade relationship with France.
45
Over 90 French
companies attended Baghdad’s annual trade fair held the following November.
46
French oil companies also maintained cordial relations with Iraq’s oil officials.
47
France’s major oil company, Total S A, (formerly TotalFinaElf), had secured a
memorandum of understanding with Iraqi oil officials during the Saddam Hussein
regime for drilling contracts worth a total of $7.4 billion. A successful outcome
would have doubled the group’s reserves with an added 10 billion barrels, and was
forecasted to increase its daily production by 16%.
48

CRS-17
49
“Oil, Business, and the Future of Iraqi Sanctions.” PolicyWatch No. 283, Washington
Institute for Near East Policy, November 24, 1997.
50
“Another Contract in Place to Continue Construction in Iraq,” Coalition Provisional
Authority News Release, April 2, 2004 [http://www.rebuilding-iraq.net].
51
See CRS Report RL32229, Iraq: Frequently Asked Questions About Contracting, by
Valerie Bailey Grasso.
52
“Iraq Creates Supreme Council to Oversee Oil and Gas Industry,” Oil Daily, July 19,
2004.
53
“Vietnam Resumes Rice Exports to Iraq,” Financial Times Information. Vietnam News
(continued...)
United States. The United States continues to be the leading importer of
Iraq’s oil. Some in the international community believed that U.S. needs for
continuous supplies of oil at lower cost and the involvement of U.S. oil interests in
Iraq played a part in leading the United States to wage war against the Hussein
regime. As early as 1997, nine U.S. oil companies, including Mobil, Conoco,
Chevron, Occidental, Arco, Exxon, Texaco, Coastal, and Amoco, reportedly
contacted Iraq to express interest in developing Iraqi oil fields once sanctions were
lifted.
49
Some international observers were also concerned that the initial Iraq
reconstruction contracts favored U.S. companies. Two American companies,
Kellogg Brown and Root (KBR), and Parsons, were the primary companies initially
selected for key reconstruction projects specifically related to oil development.
50
The
selection of these companies and other U.S. contractors for reconstruction contracts
led to questions concerning the degree to which subsequent contracts would be open
to a competitive bidding process.
51
All of Iraq’s oil assets are now controlled by the interim government. Some
analysts still express concern, however, that an Iraqi government sensitive to U.S.
interests may favor American companies when issuing future contracts for oilfield
development. The government’s creation of a supreme council to establish a
comprehensive oil policy, combined with the desire of the oil ministry to “achieve
the highest revenue possible” may indicate that, to the extent the Iraqi government
focused on long-term contracts at this time, it is intent on keeping its options open
with regard to future contract awards.
52
Table 6 in Appendix B illustrates major U.S. imports from Iraq in 2003 (annual)
and 2004 (year-to-date). Table 7 shows the top U.S. exports to Iraq for the same
time periods.
Asia. Several Asian countries also had significant trade and economic ties to
Iraq, and expressed concern that their economies might suffer due to instability
caused by the war. Prior to the war, Iraq was the largest importer of Vietnamese rice,
at a total of 860,040 tons in 2002. Because these imports were conducted under the
Oil-for-Food Program, Vietnam also received a slightly higher than market-rate price
for the rice. Suspension of the OFFP prior to the war was a concern for Vietnamese
officials until U.N. approval to resume shipments was given in early May 2003.
53

CRS-18
53
(...continued)
Briefs. May 5, 2003.
54
“Taiwan Expresses Interest in Securing Iraq Contracts,” Asia Pulse, April 21, 2003.
55
“Iraq-Thailand Trade Looks Promising if U.N. Ends Sanctions,” Emerging Markets
Datafile, Xinhua News Agency, January 12, 2002.
56
“China Adopts Cautious Approach to Iraqi Oil,” Oil Daily, December 17, 2002.
57
Marcel, Valerie, The Future of Oil in Iraq: Scenarios and Implications, The Royal
Institute of International Affairs, Briefing Paper No. 5, October 2002, p. 7
[http://www.riia.org].
58
“Itochu Signs Iraqi Crude Oil Contract,” Japan Economic Newswire, August 15, 2003.
59
“Iraqi Oil is for Iraqis,” Financial Times, November 28, 2003.
60
Middle East Regional Trade Overview, Economist Intelligence Unit, March 19, 2003.
Taiwan’s trade officials had scheduled an ambitious trade agenda for the Middle
East region and are currently seeking a role for its computer firms in the U.S.-led
reconstruction program in Iraq.
54
Thailand signed a bilateral trade and investment
cooperation agreement with Baghdad in January 2002. Thailand’s pre-war exports
to Iraq included rice and consumer products, and Thai officials expressed a desire for
deeper trade ties once U.N. sanctions were lifted.
55
Asian oil companies have also been involved in contract bids in Iraq. The
China National Petroleum Corporation (CNPC) and China North Industries
Corporation (Norinco) signed a 1997 contract with SOMO involving a $1.3 billion
investment to develop the Ahdab field in southern Iraq to a capacity of 90,000 barrels
per day. Only feasibility studies on the project could be conducted prior to the lifting
of sanctions.
56
India’s ONGC and Indonesia’s Pertamina signed agreements in 2000
for oil development in the Western Desert region, and PetroVietnam signed a
preliminary agreement to develop the Amara field.
57
On August 15, 2003, Japan’s
Itochu Corp. announced that it had signed a contract to import an unspecified amount
of Iraqi crude oil from October to December. Mitsubishi Corp., also from Japan,
signed a contract last month with SOMO for 40,000 bpd from August to December
2003.
58
Pre-War Regional Trade
Jordan. After the imposition economic sanctions by the U.N., Jordan and Iraq
began signing trade protocols on an annual basis, renewed each February. Iraq
provided Jordan with oil at highly subsidized rates, and in exchange, Jordan provided
Iraq with needed goods equal to the agreed value of the oil provided. The value of
the trade agreement varied between $200 and $700 million annually, making Iraq the
single largest market for Jordanian goods. The arrangement was reportedly
terminated by Iraqi authorities in early November 2003.
59
During the period when
sanctions were imposed, the United Nations “took note” of the arrangement, deeming
that it was neither permitted by nor expressly violated U.N. sanctions.
60

CRS-19
61
“Trade in Turkey: Bridging Maneuvers,” EIU Business Middle East, Economist
Intelligence Unit May 1, 2002.
62
EIU Business Middle East, Economist Intelligence Unit, February 16, 2000.
63
EIU Business Middle East, Economist Intelligence Unit April 1, 2001.
64
Van Schaik, J. “Syria At Last Admits to Iraqi Oil Imports,” Oil Daily, April 9, 2003.
Turkey. Prior to the implementation of sanctions, Turkey was one of Iraq’s
major trading partners, with total trade between the two countries valued at about $3
billion per year. There was also a brisk transit business, from which Turkey received
approximately $1 billion per year by trucking goods to Iraq from Turkish ports.
Estimates of Turkey’s cumulative losses from the economic sanctions range from $20
to $60 billion. However, sanctions have not been a total loss for Turkey, as Turkish
firms reportedly won export contracts under the OFFP valued at $340 million in
2002, making Turkey Iraq’s seventh-largest supplier under the U.N. program.
61
Illicit trade in diesel fuel reportedly flourished along the Turkish border with
Iraq during the implementation of sanctions, involving as many as 500 trucks per day
at its peak. The smuggling was done using specially modified trucks that would carry
food from Turkey into Iraq, and would pick up deeply discounted fuel products for
the return trip. Turkish authorities made intermittent attempts to crack down on the
illegal smuggling, mainly at times when the black market threatened its own
economic or security interests. However, because the oil sales also provided revenue
to Turkey’s impoverished southeastern region, Turkish officials sometimes ignored
the illegal trade.
62
Syria. From November 2000 to April 2003, Iraq illicitly exported oil to Syria
via a 50 year-old pipeline that had been previously unused for almost 20 years.
63
The
Iraqi flow of oil, purchased at discounts of up to 50% of market value, was a
moneymaker for the Syrian economy. Syria used the illegal Iraqi crude to meet up
to one-half of its own domestic oil needs, and sold more of its own crude oil at
market prices. Iraq exported an estimated 200,000-250,000 barrels per day through
the pipeline and earned about $800 million through the trading arrangement. On
April 8, 2003, Syrian oil officials indirectly confirmed the illicit trade agreement
when the Syrian state oil company, Sytrol, told its clients that, effective immediately,
export volumes for full-year 2003 would be cut by 40%, meaning that exports for the
remaining nine months of the year would be cut by more than half.
64
This signaled
that Iraqi oil probably accounted for that share of Syria’s pre-2003 export volume.
Other Regional Trade. Iraq also entered into trade agreements with other
countries in the region, including a 1997 “Arab Free Trade Area Agreement” signed
with thirteen other Arab countries, including Egypt, Jordan, Syria, United Arab
Emirates, Bahrain, Tunisia, Saudi Arabia, Oman, Qatar, Kuwait, Lebanon, Libya, and
Morocco. The countries agreed to reduce tariffs on goods traded among them by
10% per year, fully eliminating tariffs within ten years. Several of these countries,
including Iraq, subsequently signed bilateral or multilateral agreements with each
other accelerating tariff reductions, or even moving directly to free trade.

CRS-20
65
Embassy of Egypt. Memo to the U.S. State Department, Commercial and Economic
Office, Washington, DC, January 31, 2001.
66
“Iraq: Squaring Up to Old Challenges,” Petroleum Economist, August 6, 2004.
67
“BP Sees No Rush to Join Iraqi Upstream,” Platt’s Oilgram News, June 28, 2004.
68
“BP and Shell Signal First Interest in Iraqi Oil Fields,” The Business, August 22, 2004.
69
“Lukoil Launches Iraqi Training Program, with Eye on West Qurna,” International Oil
Daily, July 28, 2004.
In January 2001, Iraq entered into free trade agreements with Egypt, Syria, and
Tunisia under the 1997 agreement. Egypt, in particular, sought to reassure the United
States that the agreement would not affect the nature of Egypt-Iraq trade, and that
the agreement was consistent with guidelines put forth in the OFFP.
65
Table 13 in Appendix B shows trade statistics for Iraq’s trade with regional
trading partners from 1982 - 2003.
Post-War Trade and Investment Prospects
The current security situation, combined with uncertainties surrounding Iraq’s
stability following the transfer of power to a transitional government, has reportedly
cooled the interest of some major foreign oil companies to tap Iraq’s undeveloped oil
reserves, at least in the short term. According to John Browne, BP’s chief executive,
“Iraq is not on anyone’s radar screens right now.”
66
Although Browne said that BP
would “obviously” be interested in working in Iraq’s upstream eventually, he said
“our own view is that you really do have to have to see a government in power for
some time, who has made up their mind about what they want a state oil company to
do and what, if any, role the foreign oil companies should take.”
67
Despite the CEO’s comments, BP reportedly joined with other major European
oil firms (Royal Dutch/Shell, Eni, and Repsol) and several smaller firms in placing
bids for a small-scale ($10 million) Iraqi government contract to study oil reserves
in the Kirkuk and Rumaila fields and develop a detailed plan on how to best exploit
them. A contract of this size would not normally be attractive to these oil majors, but
in this case, it may be viewed as a way to examine Iraq’s oilfield data and establish
a rapport with members of the country’s oil ministry while incurring minimal risk.
68
The move also suggests that some of the major firms are positioning themselves to
reenter Iraq once a permanent government is established and internal security issues
are resolved.
Some oil companies are also helping with the training of Iraqi oil specialists,
especially Russia’s Lukoil, which hopes to keep its prospects of production-sharing
contracts with the Iraqi oil ministry alive. Although Iraq’s Foreign Minister Hoshyar
Zebari says that the government is keeping Iraq’s options open relative to any
existing or future Lukoil agreements, he has reportedly acknowledged that Russia has
legitimate interests in Iraq, is interested in participating in the country’s rebuilding,
and has good chances for future consideration.
69

CRS-21
70
“Norway’s DNO Signs Pact with Kurds to Explore in Northern Iraq,”International Oil
Daily, June 30, 2004.
71
Petroleum Intelligence Weekly, July 26, 2004.
72
Ibid.
73
“Iraq Postpones Negotiating Upstream Deals; Repairs are Priority,” Oil Daily, July 16,
2004.
74
Ibid., p. 367.
A Norwegian independent oil company, DNO, announced on June 28, 2004 that
it had entered into an agreement with the Kurdistan regional government to explore
for and develop oil and gas in Iraq’s northern region. DNO said that it would be the
operator and sole contractor for the area covered by the agreement. This deal is
controversial because (1) many are skeptical that the Kurds have a strong enough
claim to the region to strike a firm deal, (2) it raises broader issues of Kurdish
nationalism, and (3) it directly challenges the rights of the transitional government
in Baghdad to oversee foreign investment in Iraq.
70
In response to the agreement,
Iraqi interim Prime Minister Iyad Allawi warned that “companies that wish to be
welcomed here in the future should not enter into or try to pursue the implementation
of agreements with persons who are not empowered to represent the sovereign
government of Iraq.”
71
Following the transition of power from the CPA to the interim government in
June 2004, Iraq’s interim government established a Supreme Oil and Gas Council,
headed by Allawi, to draw up comprehensive policies for Iraq’s oil sector. The new
council is made up also of the deputy prime minister, the ministers of oil, finance,
planning and international cooperation, a minister of state, a central bank governor,
and an advisor. The council’s role is to approve medium and long term plans, and
major investments and their financing. In the longer term, its role is to approve
contracts with foreign investors, define an oil marketing policy, determine domestic
pricing for petroleum products, and distribution of the proceeds.
72
Although the
interim government has issued several tenders for repairing its oil infrastructure, it
has decided to postpone negotiating long-term upstream foreign investment deals,
even if the security situation improves. At the moment, its priority is to focus on
raising refinery output so that Iraq can stop importing refined products (especially
gasoline) and rehabilitate existing oil fields.
73
U.S. Economic and Trade Policy
Many in Congress and the Bush Administration believe that one of the
hallmarks of success in post-Saddam Iraq will be the rejuvenation and redevelopment
of Iraq’s economy. In addition, the 9/11 Commission recommended that U.S. efforts
to counter terrorism “should include economic policies that encourage development.”
The Commission mentioned Iraq as a specific example, saying that if “Iraq becomes
a failed state, it will go to the top of the list of places that are breeding grounds for
terrorism at home.”
74
Many agree that rebuilding Iraq’s economy is a compelling
U.S. national interest.

CRS-22
75
“Iraq: Risk Ratings: Economic Forecast Summary” EIU Country Risk Service, Economist
Intelligence Unit, August 1, 2004. EIU bases these figures on a 55% chance that a stable,
sovereign government will be achieved which will, in turn, alleviate some security concerns.
76
Abolfathi, Farid, “Iraq: Current Situation,” Global Insight, August 25, 2004.
77
Web Page of the Iraq Project and Contracting Office, [http://www.rebuilding-iraq.net].
78
Abolfathi, Farid, “Iraq: Current Situation, Global Insight, August 25, 2004.
At this time, the most significant threats to economic redevelopment are
concerns about the internal security environment due to ongoing insurgency and the
viability of Iraq’s interim government and the continuing progress of its transition to
democracy. Some observers are also concerned that a future permanent government
of Iraq may repeal some of the CPA-established laws that favor business
development in Iraq, such as those allowing foreign investment and repatriation of
capital.
The Bush Administration has begun the process of normalizing trade relations
with Iraq and on September 7, 2004, designated Iraq as a beneficiary developing
country under the Generalized System of Preferences.
Current State of Iraq’s Economy
Although many larger U.S. and multinational businesses not working in Iraq on
U.S. government reconstruction contracts are taking a “wait and see” approach
toward investing in the country, the Iraqi economy is reportedly growing at a rapid
pace despite persistent security and stability concerns. The Economist Intelligence
Unit (EIU) estimated that Iraq’s real gross domestic product (GDP) contracted by
21.8% in 2003 due to the war, but forecasts GDP growth of 40.3% in 2004 and
25.0% in 2005.
75
Much of the economic growth is reportedly due to the U.S.-
appropriated funds allocated to reconstruction of Iraq’s infrastructure being pumped
into the economy.
76
The Iraq Project and Contracting Office (PCO, formerly the
Program Management Office under the Coalition Provisional Authority) estimates
that between 250 and 300 Iraqi firms are working on reconstruction contracts and that
87,500 Iraqi employees are affiliated with the PCO.
77
Consumer spending on
imported goods is also boosting economic activity as these goods have become more
available and more affordable since the end of economic sanctions. There has also
reportedly been a boom in real estate.
78
The Bush Administration is currently attempting to attract smaller and medium-
sized U.S. businesses to invest in Iraq despite security and stability concerns.
Although most major business opportunities still involve work on U.S.-funded
reconstruction contracts, efforts are also being made to facilitate U.S. business
contacts with Iraqi government ministries and to assist businesses in exploring
private sector investment and export possibilities.
At a recent event sponsored by the Iraq Investment and Reconstruction Task
Force, Michael P. Fleischer, the former director of private sector development for the

CRS-23
79
Statistics were based on polling and other collection methods by the Iraq Reconstruction
Task Force and not officially released by Iraq’s interim government.
80
Iraq Update, Economist Intelligence Unit, September 2004.
81
Department of Commerce. Iraq Investment and Reconstruction Task Force. Iraqi Private
Sector Development Briefing, August 4, 2004. A webcast of the briefing is available at
[http://www.export.gov/iraq/other/iraqreconstruction080404.wmv].
82
For a comprehensive discussion of security issues in Iraq, see CRS Report RL31339, Iraq:
U.S. Regime Change Efforts and Post-Saddam Governance, by Ken Katzman.
Coalition Provisional Authority provided some basic (unofficial) statistics
79
illustrating the improvements Iraq’s domestic business sector has made since the end
of the war, including the following:
! Unemployment appears to be decreasing. Through polling
conducted in February 2004, Iraq’s unemployment rate was
estimated at 28%. U.S. officials indicated more recent polling
indicates a reduction in unemployment to 20%. The Iraqi
government in late July 2004 estimated the unemployment rate at
38%, however.
80
Although the methodology behind any of these
calculations is unclear, most observers believe the latter figure to be
more realistic.
! The composition of employment is shifting. Recent estimates
indicate that the private sector may employ as much as 50% of the
work force.
! The private sector in Iraq is making significant progress. Since
April 2003, over 5,000 new Iraqi companies have been established.
Businesses are registering (the equivalent of incorporation) at a rate
of almost 30 per day.
! Private sector business development is being funded not only by
resident business capital, but through repatriation of funds from
Iraqis living overseas. Informal estimates indicate that as much as
$2 million per day may be flowing into Iraq to purchase real estate
and fund businesses.
! Deposits held by Iraq’s 19 private sector banks increased by 60%
between September 2003 and February 2004, and lending increased
by 23% in the same time period.
81
Most observers believe these statistics are quite optimistic. The transitional
Iraqi government and U.S. forces continue to face significant security challenges
from the militia of Shia cleric Moqtada al-Sadr and from Sunni insurgents, possibly
aided by elements of al Qaeda.
82
Persistent violence, combined with repeated
kidnappings of foreign contractors and journalists, seems to be keeping a great deal

CRS-24
83
Pickering, Thomas R. and Schlesinger, James R., co-chairs, Iraq: One Year After,
Council on Foreign Relations, March 2004, p. 24.
84
“Election Wobble,” EIU Viewswire, September 15, 2004.
85
“Export-Import Bank Support for U.S. Exports to Iraq,” Export-Import Bank Fact Sheet,
December 2003.
86
U.S. Department of Commerce. “Doing Business in Iraq,” Iraq Investment and
Reconstruction Task Force web page, [http://www.export.gov/iraq/bus_climate/faq.html].
87
Department of Commerce. Iraq Investment and Reconstruction Task Force. Iraqi Private
Sector Development Briefing, August 4, 2004.
of foreign investment away from Iraq. Most analysts believe that improvements in
security are critical to Iraq’s sustained economic growth.
83
Some analysts believe that the continuing security threat may delay elections of
a transitional government scheduled for January 2005 despite any declarations of
interim government leaders to the contrary.
84
Any postponement in the establishment
of an elected sovereign government in Iraq may also delay the infusion of long-term
foreign investment that most observers believe is necessary for full development of
Iraq’s economy.
Exim Bank and OPIC Facilitation. Although the Export-Import Bank
(Exim Bank) of the United States is not currently providing companies interested in
investing in Iraq with its usual trade financing products, the bank’s directors
approved a $500 million short-term insurance facility to support transactions through
a newly-established Trade Bank of Iraq (TBI). The Exim Bank insures letters of
credit issued by TBI and confirmed by a commercial bank against the failure of TBI
to pay the confirming bank under an irrevocable letter of credit. The Exim Bank
further provides comprehensive coverage on short term credits extended to TBI by
an insured bank. U.S. exporters will receive payment under letters of credit issued
by the insured bank. The Exim Bank will also consider applications under all of its
products (e.g., working capital guarantee, loan guarantee, export credit insurance, and
direct loans) to support the sale of goods and services to Iraq, provided there is a
creditworthy source in a third country in the Middle East or elsewhere willing to
provide security for the loans.
85
Political risk insurance is being made available through the Overseas Private
Investment Corporation (OPIC) to cover currency inconvertability, expropriation, and
political violence. Coverage is also offered that is more appropriate to contractors,
exporters, and those providing technical assistance and management services. Stand-
alone terrorism coverage is also being provided.
86
As of July 2004, OPIC has written
$29 million worth of investment insurance for Iraqi projects, and another $100
million is in the pipeline.
87
Normalizing Trade Relations
The Bush Administration, as authorized by Congress, has lifted most U.S.
sanctions on Iraq, beginning with Presidential Determination 2003-18 of March 24,

CRS-25
88
Presidential Determination No. 2003-18 of March 24, 2003 (68 F.R. 16165), as authorized
by sec. 507 of P.L. 108-7, the Foreign Operations, Export Financing, and Related Programs
Appropriations Act, 2003.
89
Presidential Determination No. 2003-23 (68 F.R. 26459), May 7, 2003.
90
Executive Order 12722 of August 2, 1990, “Blocking Government Property and
Prohibiting Transactions with Iraq,” 55 F.R. 31803.
91
Executive Order No. 13350 (69 F.R. 46055), July 29, 2004. The executive order revoked
Executive Order 12722 of August 2, 1990, and modified Executive Orders 13290, 13303,
and 13315.
92
Executive Order No. 13303 (68 F.R. 31931), May 22, 2003.
93
Executive Order No. 13315 (68 F.R. 52315), August 18, 2003.
2003, in which the President determined that “the provision of assistance or other
financing for Iraq important to the national security interests of the United States.”
88
On May 7, 2003, the President suspended the Iraq Sanctions Act of 1990 (P.L.
101-513, implemented U.S. trade embargo and U.S. compliance of U.N. economic
sanctions against Iraq), as authorized by sec.1503 of the Emergency Wartime
Supplemental Act, 2003 (P.L. 108-11).
89
On July 29, 2004, in Executive Order 13350, the President terminated the
emergency with respect to Iraq previously declared in Executive Order 12722,
90
determining that the situation that gave rise to the declaration of a national
emergency under the International Emergency Economic Powers Act (50 U.S.C.
1701 et seq) and the National Emergencies Act (50 U.S.C. 1501 et seq) has been
significantly altered by the removal of the regime of Saddam Hussein.
91
The
termination of the national emergency formally ended the economic sanctions
imposed by the United States on Iraq following the 1990 invasion of Kuwait.
A national emergency still exists with respect to protecting the Development
Fund for Iraq (DFI) and Iraq’s petroleum assets, and blocking property of the former
regime. Executive Order 13303 (May 22, 2003) protects the Development Fund for
Iraq (DFI), Iraqi petroleum and petroleum products from”the threat of attachment or
other judicial process.”
92
The President found that such judicial processes would
constitute an unusual and extraordinary threat to the national security and foreign
policy of the United States.
Executive Order 13315 of August 18, 2003, blocking the property of the former
regime and certain senior officials under the same presidential authority, is also still
in effect. The executive order also authorizes the confiscation and repatriation of
additional property of the former regime, or the property immediate family members
of officials, and controlled entities, and designates that these properties be transferred
to the Development Fund for Iraq.
93
Iraq remains on the U.S. list of state sponsors of terrorism. Countries on this list
are barred from receiving U.S. foreign assistance, votes by U.S. representatives in
favor of international loans, sales of munitions list (arms and related equipment and
services), and stiffer licensing procedures for exports of dual-use items (commodities

CRS-26
94
These sanctions are outlined in sections 620A of the Foreign Assistance Act of 1961 (22
U.S.C. 2371) and 6(j) of the Export Administration Act (50 U.S.C. app. 2405).
95
Section 1608(1)(A) of the Iraq-Iran Non-Proliferation Act (P.L. 102-484) defines these
as long-range precision-guided munitions, fuel air explosives, cruise missiles, low
observability aircraft, military satellites, electromagnetic weapons, and laser weapons as the
President determines destabilize the military balance or enhance defense capabilities in
destabilizing ways.”
96
Pursuant to Sec. 1504 of Public Law 108-11, as amended by sec. 2205 of P.L. 108-106.
The President must notify the applicable Congressional committees that the export of this
equipment is in the national interest within five days prior to export.
97
69 F.R. 46090.
98
Proclamation 7808 of September 7, 2004, 69 F.R. 54739.
99
19 U.S.C. 2462(b)(2) and 2462(c).
that may have military as well as civilian applications). In the case of Iraq, however,
the May 7, 2003 executive order made the terrorism list sanctions inapplicable with
respect to Iraq.
94
Also inapplicable pursuant to the executive order are any other laws
directing the U.S. government to vote against or oppose international lending, or
which required cuts in U.S. contributions to international programs working in
countries designated as state sponsors of terrorism.
Congress did not authorize the lifting of sanctions on sales of “advanced
conventional weapons,” however, it did allow the President to authorize exports of
nonlethal military equipment.
95
However, any nonlethal military equipment, lethal
military equipment specifically designated by the Secretary of State for use by a
reconstituted (or interim) Iraqi military or police force, and small arms designated for
use for private security purposes, are authorized.
96
It is likely that all remaining
sanctions will continue in place until elections scheduled for 2005 are held. New
regulations shifting the remaining restrictions on transactions with Iraq from the
Department of the Treasury to the Department of Commerce were issued on July 30,
2004.
97
Generalized System of Preferences
On September 7, 2004, the President designated Iraq as a beneficiary developing
country for purposes of the generalized system of preferences (GSP), effective
September 22, 2004.
98
U.S. imports GSP beneficiary countries receive preferential
treatment — low or zero duties for designated products.
Eligibility criteria for Presidential designation of GSP status is outlined in
sections 502(b)(2) and 502(c) of the Trade Act of 1974.
99
The President is directed
to take into account the level of economic development of the country, its
commitment to a liberal trade policy, the extent to which it provides adequate
protection of intellectual property rights, and its observance of internationally
recognized workers rights. The law prohibits (with certain exceptions) the President
from extending GSP treatment to other industrial countries, Communist countries,
countries that provide preferential treatment to the products of a developed country,
and countries that nationalize or expropriate the property of U.S. citizens, or

CRS-27
100
CRS Report 97-389, Generalized System of Preferences, by William H. Cooper.
otherwise infringe on the property rights of U.S. citizens. The Trade Act of 1974 also
restricts the President’s discretion in designating eligible products. It lists categories
of import-sensitive products — certain textile and apparel products, watches,
electronic articles, steel products, footwear, glass products, and other items — that
are not eligible for GSP treatment. In addition, the act establishes “competitive need
limits,” which require the President to suspend GSP treatment when U.S. imports of
a product from a single country reach a specified threshold value or when 50% of
total U.S. imports of the product come from a single country.
100
Conclusion
Iraq’s economic involvement in the world market, largely dependent on oil
exports, varied dramatically during the regime of Saddam Hussein. Trading patterns
have seemed to reflect the domestic situation in the country, from the Iran-Iraq war
in the 1980s, to the invasion of Kuwait and the subsequent imposition of
international economic sanctions.
Currently, Iraq’s economic future is dependent on its ability to draw on its vast
oil resources. These efforts are being hindered due to continued sabotage of oil
pipelines and the weakened state of Iraq’s oil infrastructure, which had been allowed
to deteriorate during the Hussein regime. Despite concerns over the continued
insurgent activity and the stability of Iraq’s interim government which have deterred
most long-term foreign investment, Iraq’s domestic economy is reportedly booming.
The economic resurgence is brought about, in part, by U.S. appropriated funds being
spent on reconstruction contracts in the country, and by pent-up demand brought
about during economic sanctions and economic repression during the Hussein
regime.
The United States has lifted most economic sanctions on Iraq, and the President
has designated Iraq as a beneficiary developing country under the Generalized
System of Preferences. Bush Administration officials have stated that Iraq’s stability
is a compelling national interest for the United States, and have expressed
commitment to helping the country develop politically and economically.

CRS-28
Appendix: Trade Tables
Table 6. Top U.S. Imports from Iraq, 2003 and January-July 2004
(General Imports, Customs Value, actual U.S. dollars)
HTS Tariff Code Commodity Description 2003 Jan.-July 2003 Jan.-July 2004
2709 Petroleum oils and oils from bituminous minerals, crude $4,561,534,495 $2,561,785,363 $4,492,362,947
2710 Petroleum oils and oils from bituminous minerals (other than
crude) and products therefrom, nesoi, containing 70% (by
weight) or more of these oils
$11,274,000 $610,128 $9,729,333
9801 Exports of articles imported for repairs etc.; imports of articles
exported and returned, unadvanced; imports of animals exported
and returned
$983,226 $0 $21,434,617
1302 Vegetable saps and extracts; pectic substances, pectinates and
pectates; agar-agar and other mucilages and thickeners, derived
from vegetable products
$30,756 $0 $754,175
5702 Carpets and other textile floor coverings, woven, not tufted or
flocked, including kelem, schumacks, karamanie and similar
hand-woven rugs
$16,350 $0 $2,800
7411 Copper tubes and pipes $2,425 $0 $0
5705 Carpets and other textile floor coverings (whether or not made-
up), nesoi
$450 $0 $0
507 Ivory, tortoise-shell, whalebone and whalebone hair, horns,
hooves, claws etc., unworked or simply prepared, not cut to
shape
$0 $0 $3,000
2711 Petroleum gases and other gaseous hydrocarbons $0 $0 $0
2713 Petroleum coke, petroleum bitumen and residues of petroleum
oils
$0 $0 $0

CRS-29
HTS Tariff Code Commodity Description 2003 Jan.-July 2003 Jan.-July 2004
2715 Bituminous mixtures based on natural asphalt, natural bitumen,
petroleum
$0 $0 $0
2807 Sulfuric acid, oleum $0 $0 $0
2902 Cyclic hydrocarbons $0 $0 $0
8536 Electrical apparatus for switching or protecting electrical circuits $0 $0 $8,000
8471 Automatic data processing machines and units thereof $0 $0 $2,600
8413 Pumps for liquids, with or without a measuring device $0 $0 $7,494
7114 Articles of goldsmiths’ or silversmiths’ wares and parts thereof $0 $0 $5,000
6404 Footwear, with outer soles of rubber, plastics, leather or
composition leather and uppers of textile materials
$0 $0 $350
6211 Track suits, ski-suits and swim wear, not knitted or crocheted $0 $0 $3,000
6201 Men’s or boys’ overcoats, raincoats, cloaks, anoraks (including
ski jackets, and similar articles not knitted or crocheted
$0 $0 $1,600
4907 Unused postage, stamp-impressed paper, check forms, bank
notes, stock, share or bond certificates and similar documents of
title, etc.
$0 $0 $442,907
4103 Raw hides and skins $0 $0 $2,000
9999 Salvage, estimate of low value imports $0 $0 $35,926,027
9706 Antiques of an age exceeding 100 years $0 $0 $4,500
9701 Paintings, drawings and pastels, executed by hand as works of
art; collages and similar decorative plaques
$0 $0 $3,000
Source: International Trade Commission Trade Dataweb, [http://www.usitc.gov].

CRS-30
Table 7. Top 30 U.S. Exports to Iraq, 2003 and January- July 2004
(Total Exports, FAS Value, Actual U.S. dollars)
HTS Tariff Code Commodity description 2003 Jan.-July 2003 Jan.-July 2004
8502 Electric generating sets and rotary converters $96,057,983 $0 $102,980,841
8411 Turbojets, turbopropellers and other gas turbines, and parts
thereof
$82,489,561 $0 $15,302,470
7130 Leguminous vegetables, dried shelled $24,211,137 $15,964,338 $0
1507 Soybean oil and its fractions, whether or not refined, but not
chemically modified
$14,486,561 $10,201,822 $0
4020 Milk and cream, concentrated or containing added
sweetening
$11,627,443 $8,225,393 $0
9802 Exports of articles donated for relief or charity, nesoi;
imports of articles exported and returned, advanced or
improved abroad, except under warranty
$10,443,356 $4,569,013 $2,928,965
1006 Rice $9,950,696 $9,950,696 $0
1001 Wheat and meslin $9,341,992 $9,341,992 $50,763,507
1515 Fixed vegetable fats and oils (including jojoba oil) and their
fractions, whether or not refined, but not chemically modified
$5,596,452 $5,593,477 $0
8803 Parts of balloons, dirigibles, gliders, airplanes, other aircraft,
spacecraft and spacecraft launch vehicles
$5,266,034 $57,680 $10,585,947
1101 Wheat or meslin flour $3,451,870 $3,451,870 $0
8705 Special purpose motor vehicles, nesoi, including wreckers,
mobile cranes, fire fighting vehicles, concrete mixers, mobile
workshops, etc.
$3,375,545 $0 $3,250,200
9406 Prefabricated buildings $3,300,000 $0 $319,151
8471 Automatic data processing machines and units thereof; $2,331,481 $296,135 $30,608,123

CRS-31
HTS Tariff Code Commodity description 2003 Jan.-July 2003 Jan.-July 2004
magnetic or optical readers, machines for transcribing and
processing coded data, nesoi
8703 Motor cars and other motor vehicles designed to transport
people (other than public-transport type), including station
wagons and racing cars
$2,135,976 $129,979 $22,112,740
8525 Transmission apparatus for radiotelephony, radiotelegraphy,
radiobroadcasting or tv; tv cameras; still image video
cameras and recorders
$2,057,530 $111,470 $10,676,756
8527 Reception apparatus for radiotelephony, radiotelegraphy or
radiobroadcasting, whether or not combined with sound
recording or reproducing apparatus
$1,869,021 $3,019 $3,760,954
9017 Drawing, marking-out or mathematical calculating
instruments; hand instruments for measuring length, nesoi;
parts and accessories thereof
$1,465,176 $0 $1,005,931
4901 Printed books, brochures, leaflets and similar printed matter $1,361,249 $0 $157,788
8413 Pumps for liquids, with or without a measuring device; liquid
elevators; parts thereof
$1,323,315 $0 $3,047,244
1901 Malt extract; food preparations of flour, meal etc. containing
under 40% cocoa nesoi; food preparations of milk etc.
containing under 50% cocoa nesoi
$1,319,177 $1,319,177 $4,219
8529 Parts for television, radio and radar apparatus (of headings
8525 to 8528)
$1,303,668 $52,807 $8,991,503
8517 Electrical apparatus for line telephony or line telegraphy,
including such apparatus for carrier-current or digital line
systems; parts thereof
$1,232,366 $166,027 $5,370,015
3701 Photographic plates and film, flat, sensitized, unexposed, not
of paper, paperboard or textiles; instant print film, flat,
$1,165,694 $0 $1,254,371

CRS-32
HTS Tariff Code Commodity description 2003 Jan.-July 2003 Jan.-July 2004
sensitized, unexposed
4202 Travel goods, vanity cases, binocular and camera cases,
handbags, wallets, cutlery cases and similar containers, of
various specified materials
$1,035,882 $0 $243,344
8504 Electrical transformers, static converters or inductors; power
supplies for adp machines or units; parts thereof
$1,017,131 $54,970 $2,813,808
8421 Centrifuges, including centrifugal dryers; filtering or
purifying machinery and apparatus, for liquids or gases; parts
thereof
$838,965 $28,000 $12,336,397
4203 Articles of apparel and clothing accessories, of leather or
composition leather
$795,418 $0 $647,853
9030 Oscilloscopes, spectrum analyzers etc. for measuring etc.
electrical quantities, nesoi; devices for measuring etc.
ionizing radiations; parts etc.
$713,577 $220,894 $2,143,709
2828 Hypochlorites; commercial calcium hypochlorite; chlorites;
hypobromites
$638,082 $638,082 $63,352
Source: International Trade Commission Trade Dataweb, [http://www.usitc.gov].

CRS-33
Table 8. Iraq: Top 30 World Export Commodities, 1980-1988
(SITC Rev 1 Commodities, millions of U.S. dollars)
Code and Description 1980 1981 1982 1983 1984 1985 1986 1987 1988
Total All Commodities $27,848.3 $9,949.8 $9,511.9 $9,012.8 $10,059.4 $11,140.4 $7,951.2 $10,305.0 $10,196.9
3310 — Crude petroleum, etc $26,836.9 $9,619.2 $9,227.2 $8,627.7 $9,324.0 $10,056.1 $7,108.4 $9,047.1 $8,904.1
3324 — Residual fuel oils $17.0 $27.3 $8.1 $144.6 $337.6 $500.9 $256.4 $374.3 $211.5
3323 — Distillate fuels $0.0 $0.1 $0.0 $15.3 $57.7 $127.1 $94.2 $252.7 $135.1
3320 — UN special code $0.0 $0.0 $0.0 $0.0 $0.0 $0.0 $0.0 $0.0 $132.6
3411 — Natural Gas $2.1 $0.1 $0.0 $0.0 $25.6 $28.4 $21.4 $71.4 $103.9
3321 — Mtr. spirits, gasoline $101.5 $11.2 $0.0 $0.0 $30.5 $125.2 $78.7 $72.8 $98.3
2741 — Sulphur $25.3 $1.5 $0.0 $7.2 $19.9 $26.7 $37.3 $29.3 $76.3
7114 — Aircraft engines, inc jet $6.9 $24.7 $11.5 $6.4 $26.8 $28.6 $28.3 $39.4 $56.9
5612 — Chemicals phosphatic
fertilizer
$0.1 $0.0 $0.0 $4.3 $26.1 $15.5 $42.9 $48.0 $36.0
0520 — Dried fruit $25.5 $36.6 $23.7 $33.8 $20.5 $17.7 $24.3 $40.1 $32.6
9310 — Special transactions $2.4 $0.6 $14.5 $6.2 $6.1 $7.6 $6.5 $23.6 $30.2
6612 — Cement $0.2 $0.0 $0.0 $2.7 $4.0 $5.6 $29.0 $17.8 $25.8
5132 — Chemical elements $0.0 $0.1 $0.1 $38.2 $31.7 $4.1 $8.8 $22.6 $23.9
0012 — Sheep, lambs, goats $0.7 $0.2 $0.0 $1.4 $0.8 $0.0 $0.8 $0.0 $18.1
5611 — Chemicals, nitrogenous
fertilizer
$76.2 $0.7 $0.0 $0.4 $0.0 $0.2 $0.3 $0.1 $16.0
7349 — Aircraft parts, etc $0.5 $1.3 $0.8 $2.6 $3.1 $1.4 $5.9 $4.9 $14.7
5999 — Chemical products,
preparations nes
$0.1 $0.0 $0.0 $0.0 $0.0 $0.0 $0.0 $3.1 $12.4

CRS-34
Code and Description 1980 1981 1982 1983 1984 1985 1986 1987 1988
2117 — Sheep skin without wool $5.8 $5.4 $6.2 $4.4 $7.8 $4.6 $7.0 $8.9 $11.4
0430 — Barley unmilled $0.0 $0.0 $0.0 $0.0 $0.0 $2.8 $13.9 $1.9 $11.3
5619 — Fertilizers nes $0.0 $0.0 $0.1 $0.0 $7.0 $2.0 $0.0 $11.0 $9.2
8619 — Measuring ,controlling
instruments
$1.6 $1.2 $0.6 $0.4 $0.6 $1.0 $1.5 $1.3 $7.7
3325 — Lubricating oils, greases $0.0 $0.0 $0.0 $0.0 $0.0 $0.0 $2.2 $2.2 $5.5
2622 — Wool degreased $2.6 $1.2 $0.1 $0.1 $0.4 $0.1 $0.1 $3.8 $4.6
2840 — Non-ferrous metal scrap $0.6 $0.1 $0.0 $2.6 $0.7 $0.8 $0.4 $1.1 $4.6
2621 — Wool greasy, fleece-
washed
$0.7 $1.7 $0.9 $1.1 $1.3 $0.5 $0.6 $2.3 $4.0
5214 — Coal, petroleum
distillates nes
$0.0 $0.0 $0.0 $0.0 $0.0 $0.0 $0.0 $0.0 $3.4
0811 — Hay fodder green, dry $0.0 $0.0 $0.0 $0.0 $0.0 $0.1 $0.4 $1.7 $3.4
2919 — Animal materials, nes $0.9 $0.2 $0.1 $0.2 $0.2 $0.2 $1.1 $1.9 $3.2
3326 — Mineral jelly, wax $2.3 $0.8 $0.9 $1.1 $3.9 $1.6 $2.6 $2.4 $3.0
6576 — Carpets, unknotted $0.0 $0.0 $0.0 $0.9 $0.5 $0.3 $0.3 $0.5 $2.5
Source: United Nations Trade Data, compiled by CRS using the Trade Policy Information System, Department of Commerce.

CRS-35
Table 9. Iraq: Top 30 World Import Commodities, 1980-1988
(SITC Rev 1 Commodities, millions of U.S. dollars)
Description 1980 1981 1982 1983 1984 1985 1986 1987 1988
Total All Commodities $12,114.9 $17,616.2 $17,489.0 $8,622.8 $8,366.2 $8,546.2 $7,456.0 $5,752.2 $7,759.7
0410 — Wheat etc unmilled $314.3 $130.3 $294.4 $335.3 $442.0 $278.9 $242.7 $298.9 $420.1
0111 — Bovine meat fresh, frozen $24.2 $49.6 $169.4 $79.8 $75.7 $162.3 $101.8 $163.8 $304.1
0422 — Rice glazed or polished $159.0 $88.5 $110.7 $111.8 $187.7 $146.1 $103.0 $118.8 $213.9
7151 — Machine tools for metal $42.1 $53.8 $91.7 $79.8 $37.4 $23.4 $14.3 $32.2 $208.8
5417 — Medicaments $114.5 $113.6 $106.1 $71.9 $101.5 $167.1 $179.2 $119.7 $198.5
6291 — Rubber tyres, tubes $155.8 $162.0 $116.2 $34.4 $124.5 $157.4 $144.4 $69.2 $151.0
7222 — Switchgear etc $177.2 $257.4 $343.7 $220.8 $154.2 $122.8 $230.5 $143.8 $145.4
7328 — Motor vehicle parts nes $349.6 $462.5 $404.1 $215.8 $202.1 $272.8 $170.5 $64.7 $129.1
7192 — Pumps, centrifuges $211.3 $392.6 $381.2 $213.2 $141.8 $207.5 $219.0 $124.1 $123.9
7249 — Telecomm equipment nes $237.4 $290.0 $618.2 $456.9 $339.8 $300.4 $288.0 $224.4 $120.5
5812 — Prod of polymerizing etc $139.7 $128.1 $147.1 $66.5 $108.8 $94.8 $62.9 $94.6 $120.1
6732 — Iron, steel bars etc $224.9 $197.5 $127.5 $110.9 $169.6 $235.3 $106.7 $87.3 $115.8
6793 — Iron, stl forgings rough $0.7 $1.2 $1.1 $1.8 $2.7 $0.7 $1.0 $1.4 $114.1
7341 — Aircraft heavier than air $11.8 $15.3 $73.4 $24.4 $3.5 $10.6 $4.6 $29.7 $106.8
7191 — Heating, cooling equipment $239.2 $359.8 $345.3 $132.7 $79.0 $112.3 $115.5 $87.7 $105.1
0819 — Food waste and feed nes $6.5 $21.6 $25.6 $14.2 $91.3 $26.0 $40.2 $59.5 $99.5
7199 — Machine parts, accesr nes $119.1 $208.0 $198.6 $88.0 $73.1 $77.5 $86.5 $68.5 $86.8
7340 — UN special code $35.0 $32.6 $159.3 $12.4 $2.4 $11.7 $78.7 $61.3 $80.2
7193 — Mechanical handling equ $213.8 $302.7 $239.7 $81.4 $53.0 $69.0 $56.0 $29.7 $76.3

CRS-36
Description 1980 1981 1982 1983 1984 1985 1986 1987 1988
0741 — Tea $46.3 $41.7 $54.9 $89.3 $129.0 $69.8 $41.0 $62.7 $76.3
6535 — Woven synthetic fabrics $60.4 $90.8 $53.8 $14.6 $68.0 $62.4 $52.3 $37.6 $75.6
7195 — Powered-tools nes $28.7 $31.8 $41.6 $21.9 $21.0 $15.4 $14.2 $18.4 $74.5
0813 — Vegetable oil residues $5.9 $27.8 $6.0 $15.8 $49.2 $27.6 $28.5 $34.3 $74.1
0440 — Maize unmilled $12.8 $1.0 $9.3 $11.6 $50.2 $34.6 $33.7 $41.0 $71.9
6989 — Other base metal
manufacturs
$60.2 $122.0 $118.2 $62.0 $29.9 $37.2 $27.0 $23.5 $68.5
6952 — Tools nes $52.8 $58.6 $72.2 $40.6 $42.4 $31.8 $33.5 $58.5 $68.5
7231 — Insulated wire, cable $144.6 $278.6 $297.1 $129.9 $56.7 $65.7 $71.1 $57.2 $65.7
0222 — Milk and cream dry $69.0 $91.7 $61.7 $39.1 $71.8 $75.5 $41.0 $28.6 $65.2
6516 — Yarn of synthetic fibres $86.0 $90.4 $106.5 $46.7 $79.5 $52.8 $135.9 $74.7 $65.2
9310 — Special transactions $18.4 $47.7 $33.8 $82.0 $41.9 $28.9 $25.0 $12.1 $64.6
Source: United Nations Trade Data, compiled by CRS using the Trade Policy Information System, Department of Commerce.

CRS-37
Table 10. Iraq: Top 30 World Export Commodities, 1990-2003
(SITC Rev 3 Commodities, millions of U.S. dollars)
Code and Description 1990 1992 1994 1996 1998 2000 2002 2003
TOTAL — Total All Commodities $10,559.4 $488.8 $421.9 $47.6 $5,059.1 $16,286.1 $8,930.1 $7,705.5
3330 — CRUDE OIL FROM PETROLEUM
OR BITUMINOUS MINERALS
$9,875.3 $46.0 $332.6 $31.5 $4,884.1 $16,064.5 $8,720.6 $7,534.6
2882 — NONFERROUS BASE METAL
WASTE & SCRAP NES
$0.5 $0.0 $0.0 $0.0 $3.4 $9.4 $3.8 $25.0
0411 — DURUM WHEAT, UNMILLED $0.0 $0.0 $0.0 $0.0 $0.4 $0.0 $2.6 $9.7
0430 — BARLEY, UNMILLED $0.0 $0.0 $0.0 $0.0 $0.0 $0.0 $23.4 $8.9
2823 — FERROUS WASTE & SCRAP, EXC
CAST IRON & ALLOY STEEL
$0.0 $0.0 $0.0 $0.0 $0.1 $0.2 $0.2 $7.5
2631 — COTTON (OTHER THAN LINTERS),
NOT CARDED OR COMBED
$0.0 $0.0 $0.3 $0.4 $0.0 $0.0 $0.0 $5.8
3431 — NATURAL GAS, LIQUEFIED $0.0 $0.0 $9.2 $0.0 $12.6 $28.9 $22.2 $5.0
0412 — WHEAT (INCLUDING SPELT) AND
MESLIN, UNMILLED, NES
$0.0 $0.0 $0.0 $0.1 $0.1 $0.0 $0.0 $3.3
0449 — MAIZE (NOT INCLUDING SWEET
CORN) UNMILLED, NO SEED
$0.0 $0.0 $0.0 $0.0 $0.0 $0.0 $0.0 $3.1
5621 — MINERAL OR CHEMICAL
FERTILIZERS, NITROGENOUS
$30.3 $0.0 $0.0 $0.0 $0.0 $0.3 $1.3 $2.5
7822 — SPEC PUR MTR VEHICLES, OTHER
THN FOR TRANSPT OF PERS
$0.4 $0.2 $0.1 $0.0 $0.2 $0.0 $0.0 $2.0
0811 — HAY AND FODDER, GREEN OR
DRY
$0.2 $0.0 $0.0 $0.0 $0.0 $0.0 $3.4 $1.1
0542 — LEGUMINOUS VEGETABLES, $0.1 $0.0 $0.0 $0.0 $1.5 $3.0 $0.9 $1.0

CRS-38
Code and Description 1990 1992 1994 1996 1998 2000 2002 2003
DRIED, SHELLED
9310 — SPECIAL TRANSACTIONS &
COMMOD NOT CLASSIF BY KIND
$38.2 $0.2 $0.0 $0.2 $0.1 $0.1 $0.7 $1.0
0579 — FRUIT, FRESH OR DRIED, N.E.S. $28.0 $7.3 $0.2 $0.0 $0.0 $0.3 $2.2 $0.8
6841 — ALUMINUM AND ALUMINUM
ALLOYS, UNWROUGHT
$0.0 $0.0 $0.0 $0.0 $0.3 $0.0 $0.0 $0.5
6821 — COPPER, REFIN OR NOT; COPPER
ANODES; COP ALLOY UNW
$0.4 $0.0 $0.0 $0.0 $0.0 $0.0 $0.0 $0.4
7868 — VEHICLES, NT MECHANICALLY
PROPELLED & PTS, NES
$0.1 $0.0 $0.0 $0.0 $0.0 $0.0 $0.0 $0.4
3354 — PETROLEUM BITUMEN OR COKE,
& BITUMIN MIXTURES NES
$0.0 $0.0 $0.0 $0.0 $0.0 $0.3 $0.4 $0.4
4211 — SOYBEAN OIL AND ITS
FRACTIONS
$0.0 $0.0 $0.0 $0.0 $0.0 $0.0 $0.0 $0.4
3442 — GASEOUS HYDROCARBONS,
LIQUEFIED, N.E.S
$26.3 $4.8 $0.0 $0.0 $0.0 $0.2 $0.0 $0.3
5629 — FERTILIZERS, N.E.S. $14.5 $0.0 $0.0 $0.0 $0.0 $0.0 $0.3 $0.3
8215 — FURNITURE, NES, OF WOOD $0.4 $0.0 $0.0 $0.0 $0.0 $0.0 $0.0 $0.2
2783 — SODIUM CHLORIDE, PURE/COMM
SALT ETC; SEA WATER
$0.0 $0.0 $0.0 $0.0 $0.0 $0.0 $0.2 $0.2
0249 — CHEESE NES; CURD $0.0 $0.0 $0.0 $0.0 $0.0 $0.0 $0.0 $0.2
7812 — MOTOR VEHICLES FOR THE
TRANSPORT OF PERSONS, NES
$0.1 $0.1 $0.5 $0.1 $3.2 $0.2 $0.2 $0.2
0813 — OIL-CAKE ETC FROM FAT/OIL
OILSEEDS/CEREAL GERM ETC
$0.2 $0.0 $0.0 $0.0 $0.0 $0.0 $1.2 $0.2

CRS-39
Code and Description 1990 1992 1994 1996 1998 2000 2002 2003
2112 — HIDES AND SKINS OF BOVINE
ANIMALS, WHOLE, SPEC WTS
$0.0 $0.0 $0.0 $0.0 $0.1 $0.0 $0.0 $0.2
7832 — ROAD TRACTORS FOR SEMI-
TRAILERS
$0.0 $0.0 $0.0 $0.0 $0.0 $0.0 $0.0 $0.2
2789 — MINERALS, CRUDE, N.E.S. $0.0 $0.0 $0.0 $0.0 $0.0 $0.1 $0.9 $0.2
Source: United Nations Trade Data, compiled by CRS using the Trade Policy Information System, Department of Commerce.

CRS-40
Table 11. Iraq: Top 30 World Import Commodities, 1990-2003
(SITC Rev 3 Commodities, millions of U.S. dollars)
Code and Description 1990 1992 1994 1996 1997 1998 2000 2002 2003
Total All Commodities $5,423.1 $620.0 $447.1 $299.5 $909.0 $1,379.5 $2,673.0 $4,906.5 $3,352.4
7165 — ELECTRIC GENERATING SETS $21.0 $0.0 $0.4 $0.1 $0.6 $23.9 $70.8 $59.2 $181.6
8110 — PREFABRICATED BUILDINGS $9.6 $1.6 $0.0 $0.0 $0.0 $0.0 $0.2 $1.8 $118.8
0423 — RICE, MILLED WHETHER
POLISH/GLAZE/PAR BOIL (BROKEN
$114.1 $37.2 $7.3 $3.9 $97.0 $75.4 $108.5 $7.1 $108.1
8722 — INST & APPLS, MEDICAL,
INCLD SIGHT TESTING
$25.7 $2.4 $2.2 $0.9 $4.0 $35.5 $28.1 $54.7 $101.6
0222 — MILK AND CREAM,
CONCENTRATED OR SWEETENED
$93.6 $3.3 $1.7 $1.5 $7.7 $21.3 $133.2 $201.2 $100.9
7812 — MOTOR VEHICLES FOR THE
TRANSPORT OF PERSONS, NES
$218.2 $0.2 $0.2 $0.2 $3.0 $9.7 $12.6 $281.8 $100.6
3442 — GASEOUS HYDROCARBONS,
LIQUEFIED, N.E.S
$0.0 $0.0 $0.0 $0.0 $0.0 $0.0 $0.0 $0.0 $97.1
0542 — LEGUMINOUS VEGETABLES,
DRIED, SHELLED
$41.4 $5.9 $4.0 $6.0 $46.3 $31.6 $16.8 $12.0 $87.3
7149 — PARTS OF TURBOJET
ENGINES & GAS TURBINES N.E.S.
$11.8 $0.0 $0.0 $0.1 $0.0 $10.6 $30.6 $17.0 $74.9
5429 — MEDICAMENTS, N.E.S. $97.0 $51.3 $56.9 $8.8 $35.9 $115.8 $42.9 $93.6 $71.1
0612 — CANE/BEET SUGAR NES,
CHEM PURE SUCROSE, SOLID FORM
$93.4 $55.6 $51.5 $0.3 $87.6 $83.5 $65.0 $91.3 $68.7
7148 — GAS TURBINES, N.E.S. $1.5 $0.0 $0.0 $0.0 $0.0 $0.0 $33.7 $7.3 $65.9
4312 — ANIMAL OR VEG FATS, OILS,
FRACTIONS HYDRGENATD ETC
$0.5 $0.1 $89.9 $6.9 $123.7 $81.5 $19.9 $99.6 $61.4

CRS-41
Code and Description 1990 1992 1994 1996 1997 1998 2000 2002 2003
6612 — PORTLAND CEMENT
ALUMINOUS, SLAG, SUPERSULPHATE
ETC
$0.1 $0.4 $0.3 $0.8 $0.0 $2.5 $1.2 $2.5 $57.4
0910 — MARGARINE;EDIBLE PREPS &
MIXTURES OF ANIMAL FATS
$0.3 $13.9 $16.2 $18.6 $29.0 $46.8 $50.6 $28.7 $52.9
5542 — ORGANIC SURF-ACT AGENTS
NES, AND PREPARATIONS NES
$9.9 $11.7 $2.3 $4.5 $1.2 $20.6 $13.6 $50.7 $50.3
6911 — METAL STRUCTURES &
PARTS NES, OF IRON OR STEEL
$59.8 $0.1 $0.0 $0.0 $0.0 $0.4 $5.9 $62.7 $47.5
7821 — MOTOR VEHICLES FOR THE
TRANSPORT OF GOODS
$43.2 $0.3 $0.9 $1.4 $5.5 $8.5 $119.1 $343.6 $46.4
7742 — APPARATUS BASED ON USE
OF X-RAYS, ETC
$8.0 $0.0 $0.0 $0.1 $0.2 $8.1 $24.5 $25.5 $44.8
7611 — TELEVISION RECEIVERS,
COLOR
$9.5 $0.0 $0.0 $0.0 $0.1 $0.3 $0.1 $4.9 $43.9
1223 — TOB. MFG (INCL
SMKG/CHEWING) NES;
EXTRACTS/ESSENCE
$2.0 $1.8 $0.0 $0.0 $0.2 $0.0 $0.0 $35.6 $41.8
0989 — FOOD PREPARATIONS, N.E.S. $72.7 $20.6 $0.7 $2.8 $17.7 $54.3 $51.8 $36.2 $40.2
4211 — SOYBEAN OIL AND ITS
FRACTIONS
$0.0 $1.1 $0.5 $0.7 $0.2 $1.2 $0.0 $0.6 $32.4
1110 — NONALCOHOLIC BEVERAGES,
N.E.S.
$6.5 $1.3 $0.2 $1.7 $0.1 $0.3 $1.2 $1.6 $32.4
7163 — EL MOTORS EXCEEDING 37.5
W & GENERATORS, AC
$6.8 $0.0 $0.0 $0.0 $0.8 $4.7 $15.3 $19.9 $30.1
7731 — INSULATED WIRE, CABLE;
OPTICAL FIBER CABLES
$71.5 $0.1 $0.2 $0.0 $0.2 $4.1 $12.3 $34.2 $29.8

CRS-42
Code and Description 1990 1992 1994 1996 1997 1998 2000 2002 2003
0461 — FLOUR OF WHEAT OR OF
MESLIN
$2.0 $54.8 $40.4 $65.8 $6.5 $0.8 $0.1 $0.4 $29.4
7726 — BOARDS, PANELS, CONSOLES,
ETC, EQUIPD WTH ELEC APP
$48.2 $0.1 $0.3 $0.0 $0.8 $2.4 $15.4 $37.6 $28.5
7752 — HOUSEHLD TYPE
REFRIGERATORS & FOOD FREEZERS
$2.3 $0.0 $0.0 $0.0 $0.2 $0.1 $1.6 $1.4 $27.5
5541 — SOAP; SURFACE-ACTIVE
PREPS IN BARS ETC & PAPER ETC
$15.8 $16.7 $4.5 $7.5 $11.0 $15.7 $13.6 $39.0 $27.4
Source: United Nations Trade Data, compiled by CRS using the Trade Policy Information System, Department of Commerce.

CRS-43
Table 12. Iraq’s Major Trading Partners, 1982-2003
(in millions of U.S. dollars)
Trade Flow Partner 1982 1984 1986 1988 1990 1992 1994 1996 1998 2000 2002 2003
Exports WORLD $10,033.3 $9,316.8 $7,464.5 $9,608.9 $10,313.6 $608.9 $383.6 $503.0 $5,096.7 $14,426.1 $9,230.6 $9,838.8
Imports WORLD $21,134.2 $9,755.0 $8,920.4 $9,293.0 $6,525.5 $602.7 $498.7 $568.4 $1,852.8 $3,449.6 $5,869.9 $4,684.1
Trade
Balance
a
WORLD -$11,100.9 -$438.2 -$1,455.9 $315.9 $3,788.1 $6.2 -$115.1 -$65.4 $3,243.9 $10,976.5 $3,360.7 $5,154.6
Total Trade
b
WORLD $31,167.5 $19,071.9 $16,384.9 $18,901.9 $16,839.1 $1,211.6 $882.2 $1,071.4 $6,949.6 $17,875.7 $15,100.4 $14,522.9
Exports United States $37.8 $117.5 $429.8 $1,453.6 $2,952.1 $0.0 $0.0 $0.0 $1,236.9 $5,770.2 $3,452.8 $4,466.5
Imports United States $930.8 $730.5 $580.0 $1,260.1 $703.7 $0.4 $0.9 $3.1 $117.2 $12.0 $34.8 $347.2
Trade Balance United States -$893.0 -$613.0 -$150.2 $193.6 $2,248.4 -$0.4 -$0.9 -$3.1 $1,119.8 $5,758.2 $3,418.1 $4,119.3
Total Trade United States $968.6 $848.1 $1,009.8 $2,713.7 $3,655.8 $0.4 $0.9 $3.1 $1,354.1 $5,782.2 $3,487.6 $4,813.6
Exports Jordan $2.6 $14.2 $211.2 $290.4 $374.1 $395.0 $379.0 $459.6 $302.2 $620.5 $634.6 $769.3
Imports Jordan $208.9 $192.4 $133.6 $190.1 $196.5 $79.0 $165.7 $149.2 $164.7 $219.0 $623.6 $693.1
Trade Balance Jordan -$206.4 -$178.2 $77.5 $100.2 $177.7 $316.0 $213.3 $310.4 $137.5 $401.5 $11.1 $76.3
Total Trade Jordan $211.5 $206.6 $344.8 $480.5 $570.6 $474.1 $544.7 $608.8 $466.9 $839.5 $1,258.2 $1,462.4
Exports Italy $1,421.7 $923.9 $673.0 $912.0 $310.6 $0.7 $0.1 $0.1 $366.1 $1,520.2 $451.7 $724.5
Imports Italy $1,827.2 $691.0 $620.5 $226.3 $293.1 $0.0 $2.4 $1.5 $41.7 $262.0 $354.1 $186.9
Trade Balance Italy -$405.5 $232.9 $52.5 $685.7 $17.5 $0.7 -$2.3 -$1.4 $324.4 $1,258.2 $97.6 $537.6
Total Trade Italy $3,248.9 $1,614.9 $1,293.5 $1,138.3 $603.8 $0.7 $2.5 $1.7 $407.7 $1,782.2 $805.7 $911.3
Exports Canada $0.5 $0.0 $0.5 $6.8 $96.2 $0.0 $0.0 $0.0 $54.5 $459.7 $694.8 $797.7
Imports Canada $172.7 $140.1 $83.7 $171.5 $182.7 $3.7 $0.0 $0.6 $2.8 $56.9 $9.7 $3.7
Trade Balance Canada -$172.2 -$140.1 -$83.2 -$164.7 -$86.5 -$3.7 $0.0 -$0.6 $51.6 $402.8 $685.1 $794.1
Total Trade Canada $173.2 $140.1 $84.3 $178.3 $278.9 $3.8 $0.0 $0.6 $57.3 $516.6 $704.5 $801.4
Exports Vietnam $0.0 $0.0 $0.0 $0.0 $0.0 $0.0 $0.0 $0.0 $0.2 $0.0 $0.2 $0.2
Imports Vietnam $0.0 $0.0 $0.0 $0.0 $4.4 $15.7 $23.4 $72.8 $182.5 $353.7 $483.9 $537.8
Trade Balance Vietnam $0.0 $0.0 $0.0 $0.0 -$4.4 -$15.7 -$23.4 -$72.8 -$182.3 -$353.6 -$483.7 -$537.6
Total Trade Vietnam $0.0 $0.0 $0.0 $0.0 $4.4 $15.7 $23.4 $72.8 $182.7 $353.7 $484.0 $538.0
Exports Morocco $157.4 $289.6 $104.1 $214.0 $173.2 $13.3 $0.0 $0.0 $0.0 $0.0 $396.9 $481.1

CRS-44
Trade Flow Partner 1982 1984 1986 1988 1990 1992 1994 1996 1998 2000 2002 2003
Imports Morocco $16.9 $21.7 $32.8 $10.7 $43.9 $0.0 $2.2 $3.6 $0.0 $0.0 $40.1 $44.5
Trade Balance Morocco $140.6 $267.9 $71.2 $203.3 $129.3 $13.3 -$2.2 -$3.6 $0.0 $0.0 $356.8 $436.6
Total Trade Morocco $174.3 $311.3 $136.9 $224.8 $217.0 $13.3 $2.2 $3.6 $0.0 $0.0 $436.9 $525.6
Exports Brazil $2,513.4 $2,002.4 $1,028.7 $1,235.0 $1,030.0 $0.0 $0.0 $0.0 $0.0 $219.2 $328.6 $398.4
Imports Brazil $349.7 $385.0 $409.2 $327.5 $121.6 $0.0 $0.0 $0.0 $25.1 $19.5 $82.1 $91.3
Trade Balance Brazil $2,163.7 $1,617.4 $619.5 $907.5 $908.4 $0.0 $0.0 $0.0 -$25.1 $199.7 $246.5 $307.1
Total Trade Brazil $2,863.0 $2,387.4 $1,437.9 $1,562.4 $1,151.6 $0.0 $0.0 $0.0 $25.1 $238.6 $410.8 $489.7
Exports France $380.7 $705.6 $555.5 $714.0 $364.3 $0.0 $0.0 $0.0 $670.8 $1,196.7 $692.5 $177.5
Imports France $1,587.5 $752.5 $533.9 $469.7 $572.3 $22.9 $0.3 $0.0 $281.3 $392.5 $487.5 $190.7
Trade Balance France -$1,206.8 -$46.9 $21.6 $244.3 -$207.9 -$22.9 -$0.2 $0.0 $389.4 $804.2 $205.0 -$13.2
Total Trade France $1,968.2 $1,458.1 $1,089.5 $1,183.7 $936.6 $22.9 $0.3 $0.0 $952.1 $1,589.2 $1,180.0 $368.1
Exports Spain $783.7 $585.1 $779.0 $372.4 $479.5 $0.0 $0.1 $0.0 $452.1 $1,078.7 $373.7 $302.3
Imports Spain $299.1 $133.3 $66.2 $170.3 $85.9 $0.0 $0.0 $0.0 $15.6 $63.6 $75.5 $59.5
Trade Balance Spain $484.6 $451.8 $712.8 $202.1 $393.6 $0.0 $0.1 $0.0 $436.5 $1,015.1 $298.2 $242.7
Total Trade Spain $1,082.8 $718.3 $845.3 $542.8 $565.4 $0.0 $0.1 $0.0 $467.7 $1,142.2 $449.2 $361.8
Exports Netherlands $131.1 $208.4 $300.7 $185.0 $756.2 $0.2 $0.0 $0.1 $429.4 $466.0 $540.3 $269.8
Imports Netherlands $322.2 $186.6 $128.0 $107.3 $161.6 $19.0 $3.9 $16.5 $23.5 $36.5 $38.1 $40.9
Trade Balance Netherlands -$191.1 $21.8 $172.7 $77.8 $594.6 -$18.8 -$3.9 -$16.4 $405.9 $429.5 $502.2 $228.9
Total Trade Netherlands $453.3 $394.9 $428.8 $292.3 $917.8 $19.2 $3.9 $16.5 $452.9 $502.5 $578.4 $310.7
Exports Germany $208.5 $433.7 $97.3 $191.8 $51.3 $0.3 $0.1 $0.4 $72.2 $38.7 $4.6 $10.0
Imports Germany $3,451.8 $947.1 $715.3 $972.3 $876.0 $8.0 $13.6 $11.0 $95.8 $139.4 $417.9 $253.2
Trade Balance Germany -$3,243.3 -$513.4 -$618.1 -$780.5 -$824.7 -$7.8 -$13.4 -$10.7 -$23.6 -$100.7 -$413.3 -$243.2
Total Trade Germany $3,660.3 $1,380.8 $812.6 $1,164.1 $927.3 $8.3 $13.7 $11.4 $168.0 $178.1 $422.5 $263.2
Exports Russia $0.0 $0.0 $0.0 $0.0 $0.0 $0.0 $0.0 $0.0 $0.0 $0.0 $0.0 $0.0
Imports Russia $0.0 $0.0 $0.0 $0.0 $0.0 $0.0 $9.8 $0.0 $47.4 $98.9 $403.2 $240.2
Trade Balance Russia $0.0 $0.0 $0.0 $0.0 $0.0 $0.0 -$9.8 $0.0 -$47.4 -$98.9 -$403.2 -$240.2
Total Trade Russia $0.0 $0.0 $0.0 $0.0 $0.0 $0.0 $9.8 $0.0 $47.4 $98.9 $403.2 $240.2
Exports United $124.1 $84.4 $87.1 $70.0 $159.7 $0.5 $0.2 $0.1 $32.1 $0.1 $0.1 $0.2

CRS-45
Trade Flow Partner 1982 1984 1986 1988 1990 1992 1994 1996 1998 2000 2002 2003
Kingdom
Imports United
Kingdom
$1,677.8 $499.8 $720.4 $809.5 $552.8 $67.3 $16.0 $19.3 $46.9 $84.8 $78.2 $237.7
Trade Balance United
Kingdom
-$1,553.7 -$415.5 -$633.3 -$739.5 -$393.1 -$66.8 -$15.8 -$19.2 -$14.8 -$84.7 -$78.1 -$237.5
Total Trade United
Kingdom
$1,801.9 $584.2 $807.5 $879.5 $712.5 $67.8 $16.2 $19.5 $79.0 $84.9 $78.4 $237.9
Exports Australia $3.4 $4.2 $0.1 $0.1 $0.2 $0.0 $0.0 $0.0 $32.6 $74.6 $20.5 $27.6
Imports Australia $220.9 $215.8 $147.7 $191.4 $188.5 $29.0 $57.3 $17.1 $216.0 $375.8 $398.9 $178.8
Trade Balance Australia -$217.5 -$211.5 -$147.6 -$191.2 -$188.4 -$29.0 -$57.3 -$17.1 -$183.4 -$301.2 -$378.4 -$151.2
Total Trade Australia $224.4 $220.0 $147.8 $191.5 $188.7 $29.0 $57.3 $17.1 $248.6 $450.4 $419.4 $206.4
Exports Japan $703.6 $154.8 $882.7 $753.6 $812.0 $1.2 $0.0 $0.0 $80.5 $600.8 $96.3 $99.5
Imports Japan $3,019.4 $883.7 $1,346.2 $446.9 $298.0 $0.5 $1.2 $0.4 $10.9 $46.8 $311.3 $84.1
Trade Balance Japan -$2,315.8 -$728.9 -$463.5 $306.7 $514.0 $0.7 -$1.2 -$0.3 $69.6 $554.0 -$215.0 $15.4
Total Trade Japan $3,723.0 $1,038.6 $2,228.9 $1,200.6 $1,110.1 $1.6 $1.2 $0.4 $91.4 $647.6 $407.6 $183.7
Source: International Monetary Fund Direction of Trade Data, compiled by CRS using the Trade Policy Information System, Department of Commerce.
a. Trade Balance equals Exports minus Imports
b. Total Trade equals Exports plus Imports

CRS-46
Table 13. Iraq’s Regional Trade: 1982-2003
(in thousands of U.S. dollars)
Trade Flow Partner 1982 1984 1986 1988 1990 1992 1994 1996 1998 2000 2002 2003
Exports Jordan $2,555 $14,182 $211,180 $290,373 $374,145 $395,047 $379,036 $459,624 $302,198 $620,511 $634,611 $769,346
Imports Jordan $208,912 $192,379 $133,645 $190,135 $196,468 $79,031 $165,708 $149,189 $164,697 $218,981 $623,555 $693,089
Trade Balance
a
Jordan $-206,358 $-178,197 $77,535 $100,238 $177,677 $316,016 $213,328 $310,435 $137,501 $401,530 $11,056 $76,257
Total Trade
b
Jordan $211,467 $206,561 $344,825 $480,508 $570,613 $474,078 $544,744 $608,813 $466,895 $839,492 $1,258,166 $1,462,435
Exports Morocco $157,436 $289,573 $104,055 $214,034 $173,173 $13,332 $0 $0 $0 $0 $396,851 $481,107
Imports Morocco $16,863 $21,692 $32,835 $10,724 $43,853 $0 $2,205 $3,604 $0 $0 $40,052 $44,519
Trade Balance Morocco $140,573 $267,881 $71,220 $203,310 $129,320 $13,332 $-2,205 $-3,604 $0 $0 $356,799 $436,589
Total Trade Morocco $174,299 $311,265 $136,890 $224,758 $217,026 $13,332 $2,205 $3,604 $0 $0 $436,903 $525,626
Exports Egypt $836 $9,155 $30,196 $16,576 $6,709 $13 $151 $163 $0 $377 $952 $1,154
Imports Egypt $737 $23,771 $17,758 $41,441 $34,461 $23 $1,145 $80 $42,394 $82,355 $103,030 $114,519
Trade Balance Egypt $99 $-14,617 $12,437 $-24,866 $-27,752 $-10 $-994 $84 $-42,394 $-81,978 $-102,078 $-113,365
Total Trade Egypt $1,573 $32,926 $47,954 $58,017 $41,170 $36 $1,296 $243 $42,394 $82,733 $103,982 $115,673
Exports Oman $0 $0 $0 $62 $66 $0 $0 $0 $0 $1 $1 $1
Imports Oman $0 $0 $31,873 $47,402 $113,545 $0 $0 $1,101 $3,366 $40,265 $36,837 $40,987
Trade Balance Oman $0 $0 $-31,873 $-47,340 $-113,479 $0 $0 $-1,101 $-3,366 $-40,264 $-36,836 $-40,986
Total Trade Oman $0 $0 $31,873 $47,463 $113,611 $0 $0 $1,101 $3,366 $40,267 $36,838 $40,988
Exports Lebanon $0 $0 $0 $0 $0 $0 $0 $63 $40 $827 $949 $1,151
Imports Lebanon $0 $0 $0 $0 $0 $0 $0 $1 $8,209 $31,625 $32,574 $36,206
Trade Balance Lebanon $0 $0 $0 $0 $0 $0 $0 $62 $-8,169 $-30,798 $-31,624 $-35,055
Total Trade Lebanon $0 $0 $0 $0 $0 $0 $0 $65 $8,249 $32,452 $33,523 $37,357
Exports Qatar $0$0$0$0$0$0$0$0$0$0$0$0
Imports Qatar $0 $0 $0 $0 $0 $0 $0 $0 $0 $91 $83 $92
Trade Balance Qatar $0 $0 $0 $0 $0 $0 $0 $0 $0 $-91 $-83 $-92
Total Trade Qatar $0 $0 $0 $0 $0 $0 $0 $0 $0 $91 $83 $92
Exports Bahrain $0 $0 $0 $0 $0 $0 $13 $60 $4 $5 $5 $7

CRS-47
Trade Flow Partner 1982 1984 1986 1988 1990 1992 1994 1996 1998 2000 2002 2003
Imports Bahrain $0 $0 $0 $7,482 $0 $0 $0 $48 $59 $71 $73 $82
Trade Balance Bahrain $0 $0 $0 $-7,482 $0 $0 $13 $12 $-55 $-67 $-68 $-75
Total Trade Bahrain $0 $0 $0 $7,482 $0 $0 $13 $107 $62 $76 $79 $88
Exports Saudi
Arabia
$1,546 $23,636 $21,000 $25,825 $18,170 $0 $0 $0 $0 $0 $0 $0
Imports Saudi
Arabia
$58,410 $32,560 $50,270 $41,876 $141,978 $0 $0 $0 $0 $0 $0 $0
Trade Balance Saudi
Arabia
$-56,865 $-8,924 $-29,270 $-16,051 $-123,808 $0 $0 $0 $0 $0 $0 $0
Total Trade Saudi
Arabia
$59,956 $56,196 $71,270 $67,701 $160,148 $0 $0 $0 $0 $0 $0 $0
Imports Kuwait $981,750 $333,410 $238,530 $327,979 $273,589 $0 $0 $0 $0 $0 $0 $0
Exports Kuwait $10,455 $41,364 $40,991 $135,978 $0 $0 $0 $0 $0 $0 $0 $0
Trade Balance Kuwait $-971,296 $-292,046 $-197,539 $-192,001 $-273,589 $0 $0 $0 $0 $0 $0 $0
Total Trade Kuwait $992,205 $374,774 $279,521 $463,957 $273,589 $0 $0 $0 $0 $0 $0 $0
Exports Syria $268,518 $0 $182 $0 $0 $175 $0 $32 $0 $0 $0 $0
Imports Syria $132 $0 $0 $0 $0 $27 $0 $39 $0 $0 $0 $0
Trade Balance Syria $268,386 $0 $182 $0 $0 $147 $0 $-7 $0 $0 $0 $0
Total Trade Syria $268,650 $0 $182 $0 $0 $202 $0 $72 $0 $0 $0 $0
Exports UAE $6,455 $3,909 $10,909 $32,727 $22,727 $0 $0 $909 $0 $0 $0 $0
Imports UAE $79,750 $67,222 $56,539 $77,741 $63,752 $0 $0 $0 $0 $0 $0 $0
Trade Balance UAE $-73,296 $-63,312 $-45,630 $-45,014 $-41,025 $0 $0 $909 $0 $0 $0 $0
Total Trade UAE $86,205 $71,131 $67,448 $110,469 $86,479 $0 $0 $909 $0 $0 $0 $0
Source: International Monetary Fund Direction of Trade Data, compiled by CRS using the Trade Policy Information System, Department of Commerce.
a. Trade Balance equals Exports minus Imports
b. Total Trade equals Exports plus Imports
