
ORPRN-OHSU
Diabetes Metrics Toolkit
June 30, 2021
1
Quality Improvement
Targeting Diabetes Metrics
TOOLKIT
Moving the needle on important diabetes metrics and
improving health for people with diabetes
o
HbA1c Poor Control
o
Oral Evaluation for Adults with Diabetes

ORPRN-OHSU
Diabetes Metrics Toolkit
2
Table of Contents
Summary 3
Jump starting quality improvement
4
Measure: HbA1C Poor Control 5
Measure: Oral Evaluation for Adults with Diabetes
6
Five ways to increase oral evaluation for adults with diabetes
7
Five ways to decrease HbA1c poor control
8
Evidence-based practices
9‒10
Quality improvement tools
Quick guide
11
Work breakdown structure
12‒13
Driver diagram
14
Fishbone diagram
15‒16
Aim statement
17
Workflow mapping
18‒19
Plan do study act (PDSA) cycle
20
Data management
21
Examples: PDSA cycles to improve diabetes metrics
22
‒
32
Mission and Parameters Worksheet
33
Resources and Appendix
34

ORPRN-OHSU
Diabetes Metrics Toolkit
Transformation.C[email protected]te.or.us
3
Summary
Using this toolkit will help your
organization move the needle on
important diabetes metrics and
improve health for people with
diabetes.
The Quality Improvement Targeting Diabetes Metrics
Toolkit is designed for primary care practices and
dental practices to use when working on two incentive
metrics: HbA1c Poor Control and Oral Evaluation for
Adults with Diabetes. The toolkit showcases actionable
improvements including:
•
Evidence-based best practices for diabetes care
•
Key quality improvement tools
•
Real-world improvement projects done by clinics
to drive change
The toolkit is filled with hyperlinks to internal examples
within the toolkit and external resources.
Hover over the word, press control and click.
For questions regarding this toolkit, contact:
For questions on diabetes measures, contact:

ORPRN-OHSU
Diabetes Metrics Toolkit
4
Summary
Jump-starting quality
improvement
Your organization’s successful quality improvement strategy
includes:
✓
Protecting time for improvement work
✓
Valuing QI as a workplace skill: train up staff
✓
Designating a champion and lead organizer
✓
Gathering a team with multiple roles across the
clinic (for example, clinic manager, provider,
medical assistant)
✓
Setting a regular meeting time with defined meeting
objectives
✓
Utilizing quality improvement tools
✓
Defining the aim of the work
✓
Checking for group consensus and buy-in
✓
Deciding: What information or data will drive decisions
and allow you to benchmark progress?
Did you know? Literature shows successful quality improvement (QI)
initiatives feature: committed leadership, organizational culture, data
and information systems, QI experience, dedicated resources,
measurement and feedback, and accountability. For more
information, see the DHHS Health Resources and Services
Administration guide on Quality Improvement.

ORPRN-OHSU
Diabetes Metrics Toolkit
5
Diabetes HbA1c Poor Control eCQM & CCO Incentive
Measure (CMS 122v9)
Percentage of patients 18‒75 years of age with diabetes who had hemoglobin A1c > 9.0% during
the measurement period.
Numerator: Number of patients whose most recent hBA1c (performed in measurement period) is over 9.
Denominator: Patients 18‒75 years of age with diabetes with a visit during the measurement period
Exclusions: patients in hospice care, patients over 66 living long tern in an institution for more than 90 days, or
66 and older with advanced illness. Patients with dx of secondary DM due to another condition.
Telehealth eligible
A lower score is better!
For more information:
CCO Incentive Measure Specification Sheet
https://www.oregon.gov/oha/HPA/ANALYTICS/CCOMetrics /2021-specs-(Diabetes-Poor-Control)-12-18-20.pdf
eCQI Resource Center
https://ecqi.healthit.gov/ecqm/ep/2021/cms122v9

ORPRN-OHSU
Diabetes Metrics Toolkit
6
Oral Evaluation for Adults with Diabetes (CCO Incentive Measure)
Percentage of adults with diabetes who received a comprehensive or periodic oral evaluation or a
comprehensive periodontal evaluation within the reporting year identified by any of the following CDT
codes: D0120, D0150, or D0180
Numerator: Unduplicated number of adults with diabetes who received a comprehensive or periodic oral
evaluation or a comprehensive periodontal evaluation.
Denominator: Unduplicated number of adults with diabetes
Exclusions: patients in hospice, palliative care, patients 66 and older enrolled in an institution, age 66 and older
with advanced illness/frailty
A higher score is better!
For more information:
CCO Incentive Measure Specification Sheet
https://www.oregon.gov/oha/HPA/ANALYTICS/CCOMetrics/2020-2021-Specs-(Oral-
Evaluation-for-Adults-with-Diabetes)-20201222.pdf
DQA Measure Specifications: Administrative Claims-Based Measures
https://www.ada.org/~/media/ADA/DQA/2021_AdultswithDiabetesOralEvaluation.pdf?la
=en

ORPRN-OHSU
Diabetes Metrics Toolkit
7
Five ways to increase
Oral Evaluation for
Adults with Diabetes
1.
Patient Access
: Identify common
barriers to why patients with diabetes
may not be able to access dental care.
2.
Patient Education
:
How
do patients
know if they have coverage for dental
care? And
why
is dental care important?
3.
Close the loop on referrals
: Identify
where referrals get stuck
4.
Utilize common resources for
integration
: Share methods across
teams and organizations: use common
platforms, EHRs, tracking/registries, staff
and patient messaging.
5.
Increase collaboration pathways
:
Build bridges between primary care and
dental clinics.

ORPRN-OHSU
Diabetes Metrics Toolkit
8
Five ways to decrease
HbA1C Poor Control
1.
Get patients in:
Increase the number of
diabetes annual exams
2.
Labs results
: Ensure all results, including
from specialists (ophthalmology,
endocrinology) are recorded consistently.
3.
Standardize
diabetes management visits
and education using a visit checklist and
consistent educational materials.
4.
Meet patient needs, and
barriers
: Connect patients to their
coordinated care organization (CCO), dental
care organization (DCO) and
resources for
diabetes education and management.
5.
Complete behavioral health and social
needs screenings
and refer all newly
diagnosed patients as indicated.

ORPRN-OHSU
Diabetes Metrics Toolkit
9
Evidence-based
Practices
1. Record all test results as structured data.
2. Relay results and other relevant data to patient’s
physician or appropriate health care provider.
3.
Compile resources for patients who do not have a
regular physician or dentist so they may find one.
4.
Use the ADA Components of the comprehensive
diabetes medical evaluation at initial, follow-up,
and annual visits checklist.
5.
Team-based approach: Engage nurses, dietitians,
diabetes educators, traditional health workers and
pharmacists in care management.
6.
Schedule diabetes annual visits in the first 6
months of the year to allow time for
intervention.
7.
Utilize staff members such as medical assistants,
traditional health workers and care managers to
provide active follow-up for treatment evaluation
and missed appointments.
8.
Integrate screening for social or emotional
barriers to diabetes management, which may be
exacerbated by COVID-19, and identify support.
Telehealth
1.
Utilize technology to increase touchpoints
and monitoring. Telehealth, texting, patient portals, etc.
2.
Leverage telehealth to make scheduling
more frequent follow ups easier for
patients.

ORPRN-OHSU
Diabetes Metrics Toolkit
10
5.
Evidence-based Practices
Patient Navigation
1.
Follow-up appointments
Schedule all follow-ups, including next oral
health exam before appointment ends.
Schedule all referrals if possible before
appointments end for a warm “virtual”
handoff.
2.
Use automatic appointment reminders in a
method that works for the patient (call, portal
message, text message, reminder letter).
3.
Follow up directly with patients who miss
appointments, if timing permits change
4.
Utilize self-monitoring
-
Consider automatic reminders for patients
self-monitoring and recording glucose levels
8.
Arrange more frequent follow-up diabetes
appointments based on
A1C
data; E.g., every 6-8
weeks >9%, 2-3 months 7>8.9%, 3-6 months <7%.
Sources: ADA Best Practices Framework, ADA Guide to Point of Care Diabetes Testing and Reporting, ADA Comprehensive Medical Evaluation
and Assessment of Comorbidities: Standards of Medical Care in Diabetes – 2021, ADA Standards of Medical Care in Diabetes – 2020 Abridged for
Primary Care Providers

Improvement Tools Quick Guide
What is it?
Why to use it?
When to use it?
Also known as
Work Breakdown
Chart
A visual deconstruction
of a project. Displays all
elements ideas and can
include deadlines
See the bigger picture of
a project with
deliverables and
deadlines in mind
After aim/outcome
identified when
brainstorming ideas
Work Breakout
Driver Diagrams
A visual display of factors
contributing to an
outcome
Outline what elements
are “driving” a process
Once an outcome is
identified as suboptimal;
when factors have not been
named
Fishbone Diagram
A visual representation of
factors, grouped by
category, which
contribute to a certain
outcome, whether
desired or not
Identify the type(s) of
factors leading to
suboptimal outcomes
(e.g., people, physical
resources, technology)
Once an outcome is
identified as suboptimal;
when factors have not been
named
Ishikawa Diagram,
Cause and Effect
Diagram
Workflow
Mapping
A visual sequence of
actions, decisions, and
processes that deliver an
outcome
Illustrate the order of
operations that generate
a specified outcome
When factors have been
named, to identify
potential spots for
improvement
Flowcharts, flow maps,
flow diagrams, flow
sheets and process
maps
Aim Statement &
Goal Setting
A goal to help guide a
project
Keep projects on task
and solve what needs to
be solved
Once a problem has been
identified to define clear
parameters to measure
progress
SMART or SMARTIE
Goals
Plan Do Study Act
Cycle
Rapid, small-scale cycles
of change to test
interventions
To allow changes to be
implemented and tested
before deciding to adopt,
adapt, or abandon
When an aim has been
created to test small
changes intended to
address the problem
PDSA Cycle
Small Test of Change
11


ORPRN-OHSU
Diabetes Metrics Toolkit
13
Work Breakdown Structure Diagram: Standardizing Chart
Preparation/Scrub for DM Visit

ORPRN-OHSU
Diabetes Metrics Toolkit
14
Driver Diagram: a visual display of factors contributing to an outcome.
1.
Start by defining the outcome
to tease apart: In this example,
why are patients missing their
annual exam appointments?
2.
Next, list primary drivers:
what would cause a patient to
miss any appointment.
3.
For secondary drivers,
consider what factors
contribute to the primary
drivers listed.
ORPRN-OHSU
Diabetes Metrics Toolkit
15
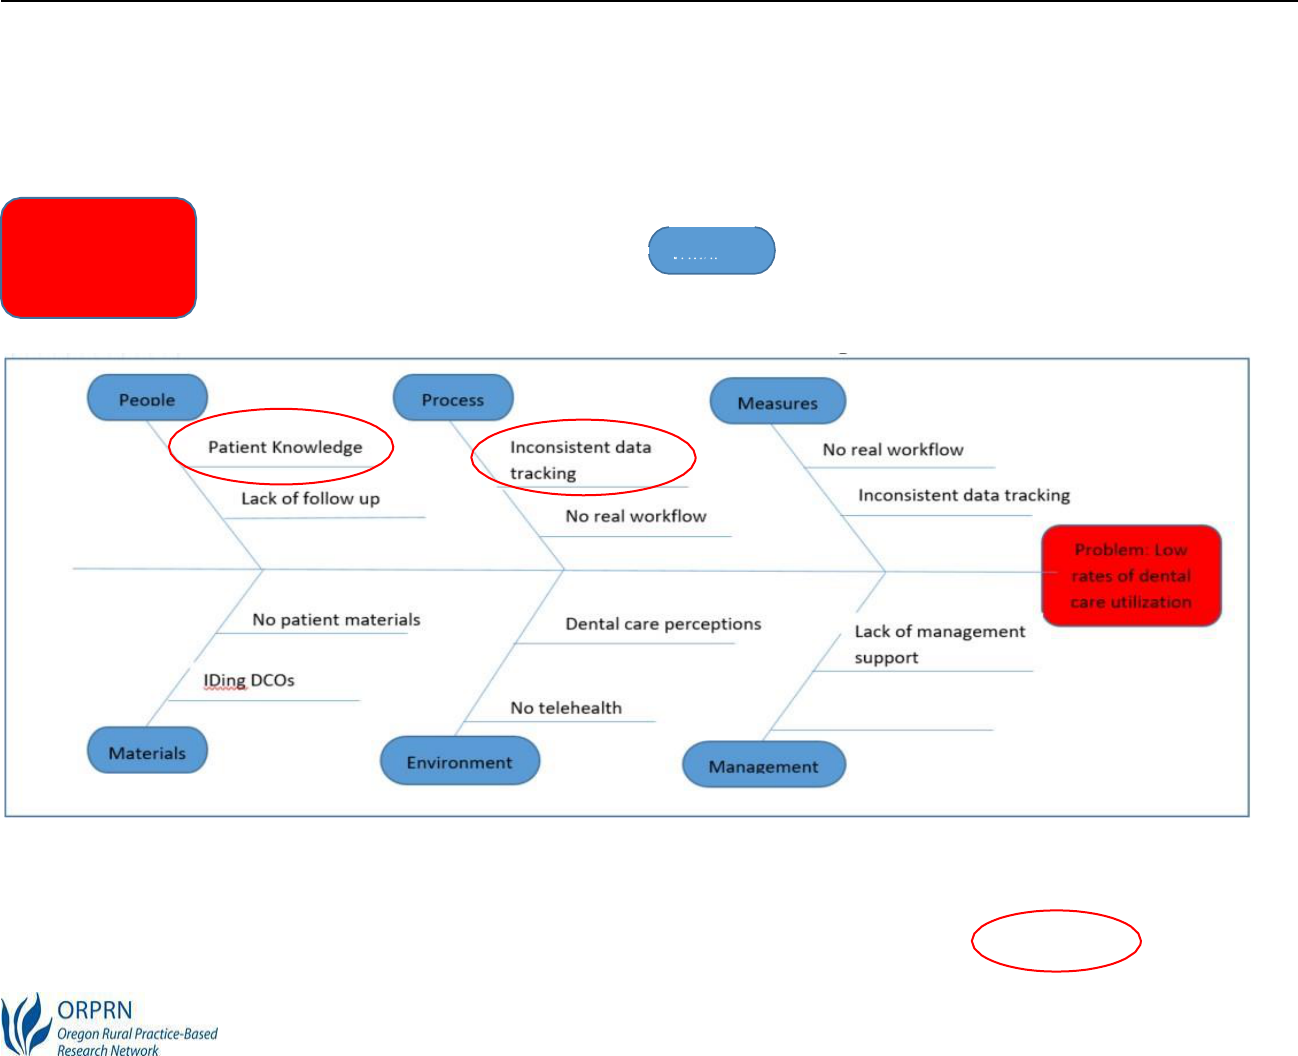
Fishbone diagram: defining cause and effect
Step 1:
define the problem (the head of fish)
(
Low rates of dental care utilization
)
Step 2
: Determine the areas to brainstorm causes (the
ribs of the fish). Standard categories are Materials,
Methods, Equipment, Environment, and People.
Step 3
: Fill in the potential causes. Keep in mind that there may be some overlap in certain sections. Causes that
pop up in more than one section often indicate a higher area of need.
Step 4
: Identify themes across the categories and determine areas for improvement.

ORPRN-OHSU
Diabetes Metrics Toolkit
16
SMARTIE Aim Statements
Aim statements guide the project by keeping it on task and working towards a singular objective
goal. Good aim statements are SMARTIE:
Specific
– Target a single area of improvement
Measurable
– Quantify an indicator of progress
Attainable
– Ensure it is achievable by assigning responsibility for individual tasks
Relevant
– Ensure it will help achieve the vision or address the problem
Timebound
– Specify when the result will be achieved
Inclusive
– Bring marginalized populations into activities and programs
Equitable
– Address systemic injustice, inequity, and oppression
Examples
•
Increase follow-up phone calls to monitor HbA1c levels of Latinx/o/a patients with diabetes from
20-40% by March 31, 2021
•
Decrease number of appointment no-shows by conducting 20 new telehealth visits with
targeted patients by May 31, 2021

ORPRN-OHSU
Diabetes Metrics Toolkit
17
Workflow Mapping
Create a visual representation of a defined process. A workflow includes each step from
beginning to end. Mapping how work gets done allows confirmation of the process and identifies
areas for improvement. Many of these symbols are available in Microsoft Office applications and
internet applications like Lucid Chart or MiroBoard.
Start by deciding what symbols to use:
Start/End
Decision
Operation
Direction
Delay

ORPRN-OHSU
Diabetes Metrics Toolkit
18
Swim Lane
Workflow
Step 1
: Decide what the workflow is showing:
patient experience and handoffs
Step 2
: Identify the roles (swim lanes) involved in the workflow (
patient, staff, and provider
)
Step 3:
List tasks, in order by role
Step 4:
Connect with arrows to show movement and direction
Source: http://www.ihi.org/resources/Pages/Tools/Quality-Improvement-Essentials-Toolkit.aspx

ORPRN-OHSU
Diabetes Metrics Toolkit
19
PDSA Cycles
The Plan, Do, Study, Act (PDSA) cycle is a simple, step-by-step process to test changes and
document outcomes. Use the PDSA cycle once you have an aim statement and ideas of what to
try changing.
Step 1 Plan
: Make a plan for a small test of change.
•
Define a timeline, usually 1-4 weeks depending on
how quickly the plan can be implemented
•
Define the objective of the plan and data/measures
•
Outline questions and predictions about the plan
•
Determine the who, what, when, and where for the
plan
Step 3 Study:
Analyze the results
•
Complete the data analysis
•
Compare the data to predictions
•
Summarize learnings
Step 2 Do
: Conduct the test
•
Carry out the plan
•
Document problems and
unexpected
observations
•
Collect data or supporting measures
Step 4 Act
: Adopt, adapt, or abandon
the
change. Determine changes to
make and decide if you do another
cycle.

ORPRN-OHSU
Diabetes Metrics Toolkit
20
ORPRN-OHSU
Diabetes Metrics Toolkit
21
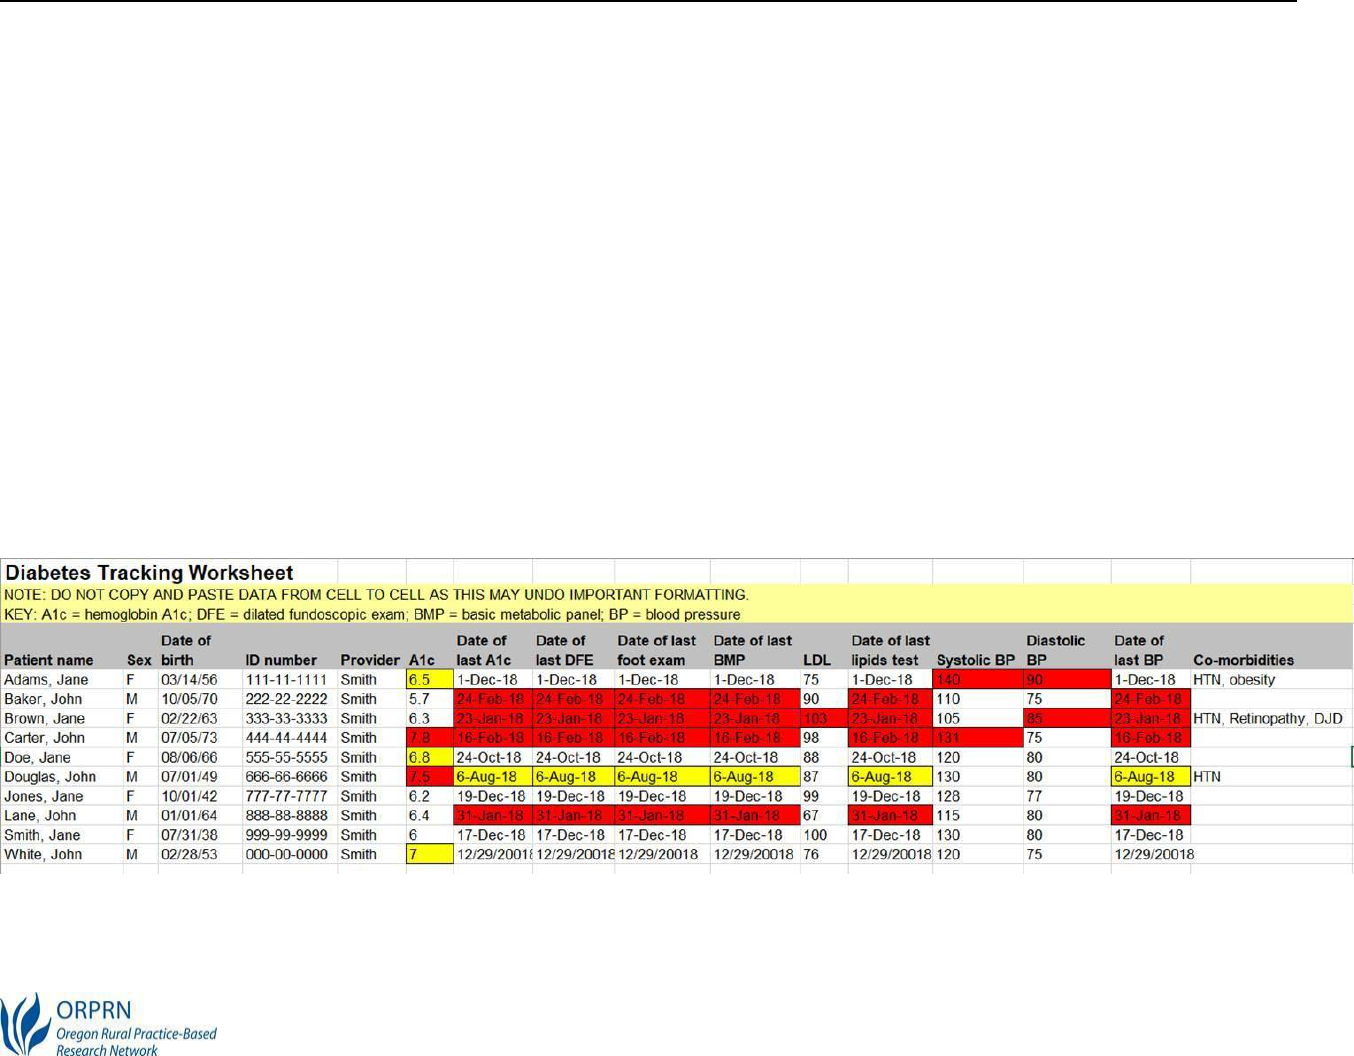
Data
Management
Registries track practice populations across a set of diseases and risk states identifying gaps in
care. They can be simple (for example, an excel spreadsheet) or complex (for example,
automated reports
generated from the EMR).
When designing a registry, consider:
•
What is the purpose?
•
What information will registry hold (for example, name, DOB, most recent A1c, etc.)?
•
What questions will the registry answer (for example, are visit no-shows decreasing?)
•
How will patients be identified? (for example, ICD-10 codes, medication lists)
•
Who maintains the registry? Build in time for a designated registry czar to keep current.
Here is an example of a comprehensive tracker:

ORPRN-OHSU
Diabetes Metrics Toolkit
22
Case Study PDSA
Examples
Examples from technical assistance conducted between November 2020 and May 2021:
•
Get patients in: Increase the number of diabetes annual exams
•
Standardize diabetes visits with a checklist
•
Define diabetes workflows: Prepare charts for annual exams
•
Close external referrals
•
Improve communications with the nearest dental practice
•
Prioritize diabetes patient outreach for scheduling
•
Ensure staff time for quality improvement efforts
•
Educate staff in quality improvement techniques
Plan
Do
Study
Act

ORPRN-OHSU
Diabetes Metrics Toolkit
23
Goal: Increase the Number of Diabetes Annual Exams
Narrative
The number of patients missing
scheduled appointments reached
up to 20% per week. The primary
care clinic wanted to reduce this
to below 10%. The clinic first
created a work break down
structure to identify reasons and
improvement areas for missed
appointments: automated
reminder calls may not
work, staff needed training in
reminder call communication,
convert cancellations
or reschedule requests into same-
day telemedicine appointments.
Strategy
Reduce annual exam no shows by improving
reminder mechanisms and converting cancellation
requests to same day telehealth visits. Step 1 work
break out/process map.
Study
Act
Do

ORPRN-OHSU
Diabetes Metrics Toolkit
24
Goal: Standardize Diabetes Management Visits with a Checklist
Narrative
As a chronic condition, diabetes
management is often addressed at
visits where other health issues
are also broached. While all
health issues are interrelated,
“free styling” diabetes
management introduces the
opportunity for factors to be
missed.
Strategy
Use a diabetes management visit checklist including lab
orders, health assessments, questions during the visit such as
recent diet and physical activity levels, use of insulin, testing
frequency.
Study
Act
Do

ORPRN-OHSU
Diabetes Metrics Toolkit
25
Goal: closing the external referral system loop
Goal: Close External Referrals
Strategy
Design a template that aligns with the new EHR external
referral template and train one provider team to use. Referral
coordinator will track time via excel spreadsheet and connect
with referral partners to close referrals on a weekly basis.
new EHR. They will devote staff
Do
Utilize new
Study
Act

ORPRN-OHSU
Diabetes Metrics Toolkit
26
Goal: Increase Patient Receptivity and Knowledge for Oral Health
Exams
Narrative
A CCO panel manager regularly
calls clients with diabetes to check
in about oral health needs and
encourage them to see a dentist
for their yearly oral health exam.
Many of the patients do not know
that they have dental coverage
through Oregon Health Plan
(OHP) and are not sure who to
call to get a dental appointment
that would be covered by their
dental care organization.
Strategy
Increase messaging to focus on patient education about
coverage; incorporate dental coverage conversation
with all OHP clients during diabetes annual exams.
Study
Act
Gather all DCO contact
Do
Add oral health to DM

ORPRN-OHSU
Diabetes Metrics Toolkit
27
Goal: Increase communication pathways between primary care
and dental clinics in same area.
Narrative
Primary care providers refer
diabetic patients for oral health
exams but don’t track whether
patients complete these visits.
Dental practices aren’t routinely
informed of patients referred to
them, and can’t contact patients
who are not yet established with
their practice.
Strategy
Initiate a monthly check-in to reconcile completed
oral exams so that referrals can be re-issued if
necessary.
Do

ORPRN-OHSU
Diabetes Metrics Toolkit
28
Study
Act

ORPRN-OHSU
Diabetes Metrics Toolkit
29
Goal: closing the external referral system loop
Goal: Prioritize Diabetes Patient Outreach for Scheduling
Strategy
Run a report in the EMR including all patients with a
diagnosis of diabetes and their three most recent A1c
results.
Do
Study
Act

ORPRN-OHSU
Diabetes Metrics Toolkit
30
oses.
Goal: Complete behavioral health and social needs screenings and
refer all new diagnoses as indicated.
Strategy
Identify a BHC in clinic who will meet with all newly
diagnosed patients. Make the Health-Related Social
Needs (HRSN) Screening Tool available in exam
rooms.
Name BHC who will
Do
Study
Act

ORPRN-OHSU
Diabetes Metrics Toolkit
31
Goal: Ensure Staff Time for Quality Improvement Efforts
Narrative
Leadership want and staff voice a
need for quality improvement but
no one has the time or duty built
in to their role. To plan for
success and align office culture
with stated goals, make leading QI
efforts part of someone’s official
duties with dedicated resources
such as weekly protected time to
do the work.
Strategy
Consider which office role is the most natural fit for
QI duties; redistribute .2 FTE non-QI duties to other
staff to truly protect this time.
Study
Act
Do

ORPRN-OHSU
Diabetes Metrics Toolkit
32
Goal: Ensure all lab results, including from specialists (such as
endocrinology) are recorded consistently
Narrative
Lab results aren’t always
recorded in the electronic
medical record (EMR), where
providers can see and use them,
even if patients follow through
and complete requested tests.
Making results available to
providers before/during a
patient visit empowers the
provider to make decisions
based on the best current lab
information.
Strategy
During patient visit reminder call, confirm that
patient completed requested lab tests, and look up
results, copying them into patient visit note.
Study
Act
Do

ORPRN-OHSU
Diabetes Metrics Toolkit
33
Goal: Train Staff in Quality Improvement Skills
Narrative
Current staff lack QI skills and
need an introduction and basic
training.
Strategy
Train one staff member by sending them to an
Institute for Healthcare Improvement (IHI) training,
after which they will “teach back” QI basics to others
in an all-staff meeting.
Plan
Do
Study
Act

ORPRN-OHSU
Diabetes Metrics Toolkit
34
Diabetes Quality Improvement: Mission and Parameters Worksheet
Complete this form when you launch your QI efforts and return to it regularly to
ensure alignment with your clinic’s mission and capacity.
QI Team Members
Who will meet to do this work?
Regular Meeting Time
Pick a standing meeting time to
maintain momentum.
Timeframe
How long will you spend? Can
be open-ended or time-limited.
Topic
Briefly describe the process or
system to be addressed.
Tools
Circle those you plan to use.
Work Breakdown Chart Driver Diagram
PDSA Cycle
Fishbone Workflow Mapping Aim Statement

ORPRN-OHSU
Diabetes Metrics Toolkit
1
Resources and Appendix
Oral Evaluation for Adults with Diabetes - Measure information
https://www.oregon.gov/oha/HPA/ANALYTICS/CCOMetrics/2020-2021-Specs-(Oral-Evaluation-for-Adults-with-Diabetes)-
20201222.pdf
Diabetes: HbA1c Poor Control (CMS122v9)
https://www.oregon.gov/oha/HPA/ANALYTICS/CCOMetrics/2021-specs-(Diabetes-Poor-Control)-12-18-20.pdf
NCQA HEDIS Comprehensive Diabetes Care (CDC)
https://www.ncqa.org/hedis/measures/comprehensive-diabetes-care/
CDC National Diabetes Statistics Report 2020
https://www.cdc.gov/diabetes/data/statistics-
report/index.html?CDC_AA_refVal=https%3A%2F%2Fwww.cdc.gov%2Fdiabetes%2Fdata%2Fstatistics%2Fstatistics-
report.html
Telehealth Guidance for Electronic Clinical Quality Measures (eCQMs) for Eligible Professional/Eligible Clinician
2021 Quality Reporting
https://ecqi.healthit.gov/sites/default/files/2021-eCQM-Telehealth-Guidance-Document-With-QRDA-Update-508.pdf
ADA policy on Tele-dentistry
https://www.ada.org/en/about-the-ada/ada-positions-policies-and-statements/statement-on-teledentistry
Guiding Principles for the Care of People With or at Risk for Diabetes (NIH)
https://www.niddk.nih.gov/health-information/professionals/clinical-tools-patient-management/diabetes/guiding-principles-
care-people-risk-diabetes


Healthy Teeth
Tips to Keep Your Teeth Healthy
■
Get a dental exam once a year or more
often if your dentist says you need it. At
your exam, your dentist or dental
hygienist can:
•
Explain how diabetes affects your teeth
and gums and check for problems, like
cavities or gum disease.
•
Treat any problems you have with your
teeth or gums.
•
Teach you how to check for signs of gum
disease at home (see next pag e).
•
Provide care, like a fluoride treatment, to
keep your mouth healthy.
•
Tell you how to treat problems, such as
dry mouth.
■
Work with your dentist to create a health
plan for your teeth.
•
Ask your dentist how to take care of your
teeth at home and how often to come in
for a dental visit.
•
Ask what to do if you start having
problems with your teeth or gums.
•
Ask your dentist to send your exam results
to your other doctors after every visit.
•
Be sure to keep your next dentist
appointment!
■
Take care of your teeth at home.
•
Brush with a so ft - b rist led toothbrush
two times a day or m o re.
•
Use toothpaste with fluoride and floss
once a d ay.
•
Check your mouth for red or swollen
gums, bleeding gums, loose teeth, a
change in how your bite feels, or bad
breat h.
•
Visit a dentist if you think you have
gum disease.
•
Limit food and drinks that are high
in sug ar.
Centers for Disease
Control and Prevention
National Center for Chronic
Disease Prevention and
Health Promotion
Did you know that diabetes can harm your teeth and gums? The good news is
that you can take steps to help keep your teeth healthy. You've already taken
an
important step by finding this guide!

How Can Diabetes Harm
Your Teeth?
What Are the Signs of
Gum Disease?
■
Diabetes is linked to gum disease, also
■
Red, swollen, or bleeding gums.
known as periodontal disease .
■
Gums pulling away from the teeth
■
Gum disease can lead to tooth loss. or sores on the gums.
■
If people who have uncontrolled diabetes
■
Loose teeth or change in bite or
get treated for gum disease, their blood tooth position.
sugar will go down over time.
■
Bad breath.
Manage
Your
ABCs
A
BC
Ask your health care team to help you
set and reach goals to manage your
blood sugar, blood pressure, and
cholesterol and stop smoking-also
known as the ABCs of diabetes.
■
A1C (a measure of your average
blood sugar over 3 months):
The goal
set for many people is less than 7%
for this blood test, but your doctor
might set a different goal for you.
■
Blood pressure:
High blood pressure
causes heart disease. The goal is less
than 140/90 mmHg for most people,
but check with your doctor to see
what your goal should be.
■
Cholesterol:
LDL or "bad" cholesterol
builds up and clogs your blood
vessels
. HDL or "good" cholesterol
helps
remove the "bad" cholesterol from
your blood vessels. Ask your doctor
what your cholesterol numbers should
be.
■
Smoking:
If you smoke or use other
tobacco products, take steps to quit.
Call 1-800-QUIT-NOW
(1-8 0 0 -78 4 - 8 6 69) for
su p p o rt .
Teach your family about
your diabetes and the
ABCs so they can help you.
Ask your health care provider to refer you to diabetes self-management education
and support (DSMES) services to help you manage your diabetes. Search for
programs recognized by the American Diabetes Association or accredited by the
Association of Diabetes Care
& Education Specialists.
: .
.
.


ORPRN-OHSU
Diabetes Metrics Toolkit
4

ORPRN-OHSU
Diabetes Metrics Toolkit
5
Work breakdown process map example from previous PDSA
workflow example

ORPRN-OHSU
Diabetes Metrics Toolkit
6
This toolkit was created by practice facilitators from the
Oregon Rural Practice-based Research Network and funded
by the Oregon Health Authority Transformation Center.
Contributors include:
Laura Ferrara , Tiff Weekley, Cort Cox, and Steph Hyde
June 30, 2021
Questions? Email ORPRN_TA@ohsu.edu
