
Papers in Language Testing and Assessment Vol. 4, issue 1, 2015 59
Using an English self-assessment tool to validate an
English Placement Test
Zhi Li
12
Iowa State University
This study aimed to develop and use a contextualized self-
assessment of English proficiency as a tool to validate an English
Placement Test (MEPT) at a large Midwestern university in the
U.S. More specifically, the self-assessment tool was expected to
provide evidence for the extrapolation inference within an
argument-based validity framework. 217 English as a second
language (ESL) students participated in this study in the 2014
spring semester and 181 of them provided valid responses to the
self-assessment. The results of a Rasch model-based item analysis
indicated that the self-assessment items exhibited acceptable
reliabilities and good item discrimination. There were no misfitting
items in the self-assessment and the Likert scale used in the self-
assessment functioned well. The results from confirmatory factor
analysis indicated that a hypothesized correlated four-factor model
fitted the self-assessment data. However, the multitrait-
multimethod analyses revealed weak to moderate correlation
coefficients between participants’ self-assessment and their
performances on both the MEPT and the TOEFL iBT. Possible
factors contributing to this relationship were discussed.
Nonetheless, given the acceptable psychometric quality and a clear
factor structure of the self-assessment, this could be a promising
tool in providing evidence for the extrapolation inference of the
placement test score interpretation and use.
Key words: English Placement Test, Self-assessment, Argument-
based validation, Extrapolation inference, Multitrait-multimethod
analysis
1
Zhi Li, Department of English, Iowa State University, 206 Ross Hall, Ames, IA. 50010 USA. E-mail: zhili@iastate.edu

60 Z. Li
Introduction
English placement tests (EPTs) are commonly used as a post-entry language
assessment (PELA) to supplement the use of standardized English proficiency tests
and, more importantly, to address local needs of ESL teaching through re-assessing
and placing ESL students into appropriate ESL classes (Fulcher, 1996). Considering
its impact on students’ English learning as well as the influence of English
proficiency on students’ academic achievement (Graham, 1987; Light, Xu, &
Mossop, 1987; Phakiti, Hirsh, & Woodrow, 2013; Vinke & Jochems, 1992), efforts to
validate the interpretation and use of EPTs scores are needed (Knoch & Elder,
2013).
Research background
An argument-based approach to validation
EPTs can play an important role in facilitating English teaching and learning
through grouping ESL students who share similar needs in English learning into
the same classes. To make a statement about the positive effects of EPTs on both
ESL education and students’ development, we need to validate the interpretation
and use of the scores from these tests. Typically, the scores from an EPT are
claimed, explicitly or implicitly, to be indicative of students’ English proficiency
levels in an academic context and thus can be used to make decisions on academic
ESL course placement. The placement decisions based on the EPT scores also
reflect an underlying belief that adequate English proficiency is necessary for ESL
learners to achieve academic success. However, the intended score interpretation
and impact of the placement decisions of EPTs in general are still a largely under-
researched area (Green & Weir, 2004).
According to Kane (2013), an argument-based approach to validation focuses on
the plausibility of the claims that are made based on the test scores, which entail a
series of inferences from the test responses to test score interpretation and use. In
this sense, validation efforts should be directed to constructing specific arguments
with regard to particular inferences. To this end, an interpretation and use
argument (IUA) for an EPT is needed. Following the structure of the interpretive
argument for the TOEFL iBT proposed by Chapelle, Enright, and Jamieson (2008),
an interpretation and use argument (IUA) for an English Placement Test used at a
large Midwestern university in the U.S. (herein referred to as the MEPT) is
presented to specify the proposed claims about test score interpretation and use.
As shown in Figure1, the circle represents a source of data for analysis and an
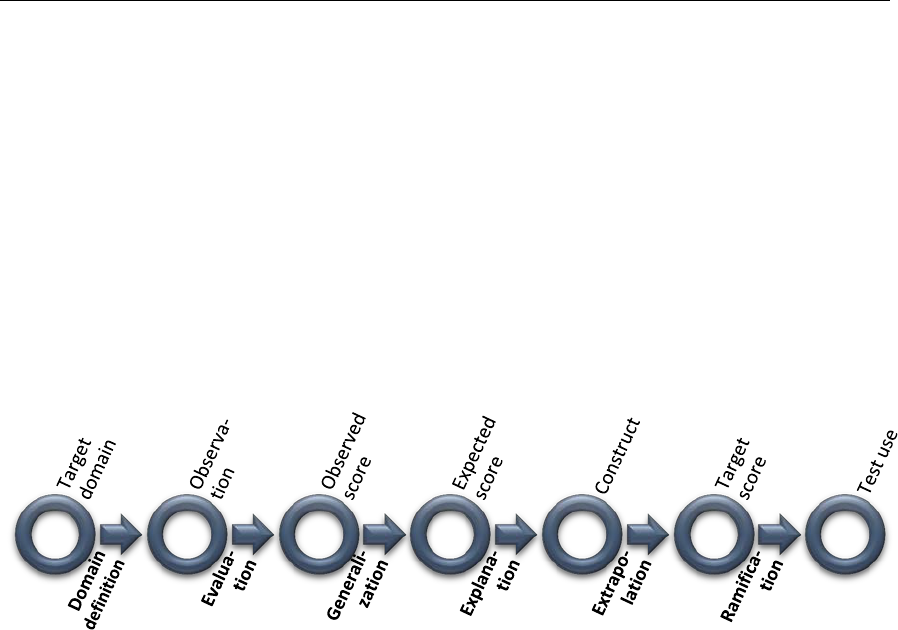
Papers in Language Testing and Assessment Vol. 4, issue 1, 2015 61
outcome data as a result of an adjacent inference, while the arrow embodies an
inference linking two data sources and the label of the inference is shown
underneath the arrow. This series of inferences reflects the process of target
domain identification (Domain definition inference), item scoring (Evaluation
inference), reliability estimation (Generalization inference), theoretical explanation
of scores (Explanation inference), matching scores with actual performance in the
target domain (Extrapolation inference), and establishing the impact of decisions
based on the scores (Ramification inference).
Figure 1. An interpretation and use argument for the MEPT
The interpretation and use argument for the MEPT can help lay out a research plan
and guide the choice of research methods for each inference. This study focused
specifically on the extrapolation inference of the MEPT for two reasons. Firstly, one
of the important sources of validity evidence is from the test-takers’ perspectives
and the extrapolation inference addresses the relationship between test scores and
test-takers’ actual performance in a targeted domain. However, the test-takers’
voice is rarely heard and their real-life performances in educational contexts are
seldom associated with test performances in the literature of EPTs (Bradshaw,
1990). Secondly, in addition to the documentation of the test development and
regular item analysis, there are several validation studies conducted for the MEPT,
but very limited efforts have been devoted to the extrapolation inference. For
example, Le (2010) proposed an interpretive argument for the listening section of
the MEPT and conducted an empirical study on four main inferences, namely,
domain analysis, evaluation, generalization, and explanation. Yang and Li (2013)
examined the explanation inference of the MEPT through an investigation of the
factor structure and the factorial invariance of the MEPT. They found that the
identified factor structure of the listening and reading sections of the MEPT
matched the structure of the constructs described in the test specifications and
factorial invariance of the constructs was further confirmed in a multi-group

62 Z. Li
confirmatory factor analysis. Manganello (2011) conducted a correlational study
comparing the MEPT with the TOEFL iBT and found that the TOEFL iBT scores
had a moderate correlation with the test administered from fall 2009 to spring
2011. However, further evidence was needed regarding the interpretation and use
of the test scores to support the extrapolation inference.
Extrapolation inference and self-assessment
In the interpretation and use argument for the MEPT, the extrapolation inference
links the construct of language proficiency as represented by the scores or levels of
sub-skills (reading, listening, and writing skills) to the target scores, which are the
quality of performance in the real-world domain of interest. The diagram in Figure
2 presents the extrapolation inference with its grounds, claims, and supporting
statement in Toulmin’s notation for argument, in which the claim is established
with a support of the warrants and/or a lack of support of the rebuttals. As shown
in Figure 2, the claim warranted by the extrapolation inference is that the scores on
the MEPT or the expected scores of the MEPT reflect learners’ actual English
proficiency in academic contexts at that university (the target scores). The
assumptions underlying this inference include that the constructs of academic
language proficiency as assessed by the EPT account for the quality of linguistic
performance at that university. Typical backing for the assumptions includes
findings in criterion-related validation studies, in which an external criterion that
represents test-taker’s performance in targeted domain is employed (Riazi, 2013).
Therefore, a key step in establishing the extrapolation inference is to identify an
appropriate external criterion and use it as a reference to compare test-takers’
MEPT performance.

Papers in Language Testing and Assessment Vol. 4, issue 1, 2015 63
Figure 2. Extrapolation inference for the MEPT
Possible external criteria are concurrent measures of English proficiency, such as
standardized English proficiency tests, student self-assessment, and teacher
evaluation. A typical practice of this type of criterion-related validity is to correlate
the scores on the target test with those on a well-established test, such as TOEFL
and IELTS, assuming that both the target test and the reference test measure a set
of similar, if not the same, constructs. Several studies investigated the relationship
between the standardized English proficiency tests and local EPTs and reported
moderate correlation coefficients. For example, In Manganello (2011), the
correlation coefficient (Pearson’s r) for the reading section between the MEPT and
the TOEFL iBT was .363 and the correlation coefficient for the listening section was
.413. The correlation coefficient (Spearman’s rho) for the writing section between
the two tests was .317. Kokhan (2012) studied the possibility of using TOEFL scores
for university ESL course placement decisions at the University of Illinois at
Urbana-Champaign. She found that the correlation coefficients between the TOEFL
scores and the scores on the local EPT varied when the lag between the TOEFL test

64 Z. Li
and the EPT was taken into consideration. Overall, the highest correlation
coefficient was below .400 in the case where TOEFL was taken most recently by the
students. However, with a wider interval gap between the TOEFL and the EPT in
time, the correlation coefficients became even smaller. Considering the potential
impact of misplacement using the TOEFL scores, Kokhan (2013) made an explicit
argument against using standardized test results from SAT, ACT, and the TOEFL
iBT for placement purposes at the University of Illinois at Urbana-Champaign.
Kokhan’s argument is echoed in Fox (2009), a study on the impacts of using TOEFL
and IELTS scores for placement purposes at a Canadian university. Fox reported a
number of misplacement cases resulted from using the standardized tests in that
institute. In view of the existing studies on the relationship between standardized
English proficiency tests and local EPTs, it was hypothesized that a significant but
relatively weak to moderate correlation exists between the standardized English
proficiency tests (TOEFL and IELTS) and the MEPT.
Like standardized tests, self-assessment can be a possible tool to support the
extrapolation inference of the MEPT in a criterion-related validation study.
Previous studies have showed that self-assessment can be a reliable learner-
directed measure of English proficiency that brings test-takers’ voices to the
validation process (LeBlanc & Painchaud, 1985; Ross, 1998). Self-assessment has
also been used as a supplementary tool to existing assessment projects, as the ones
used in DIALANG and the European Language Portfolio (ELP) project (Alderson,
2005; Engelhardt & Pfingsthorn, 2013; Hellekjær, 2009; Lee & Greene, 2007).
Furthermore, self-assessment may be one of the most accessible instruments that
can easily reach out to most of the targeting participants with a uniform set of
items, compared with teacher evaluation.
The utility of self-assessment of English skills has been explored mainly via
correlational analyses with other measures, for example, scores on standardized
tests and teacher ratings. Overall, the findings about the correlation of self-
assessment are promising, although the magnitude of correlation coefficients
varies from study to study depending on the item format and specificity of item
content (Brantmeier, 2006; LeBlanc & Painchaud, 1985; Luoma, 2013; Oscarson,
2013; Ross, 1998). Self-assessment also has its value as an alternative to some
exiting tests or as a tool to validate a test. For example, LeBlanc and Painchaud
(1985) used a planned self-assessment questionnaire as a placement tool which
contained 60 ‘can-do’ statements with reference to specific situations. They found
that the self-assessment tool produced high quality results and placed students in a
similar way as the standardized tests. Malabonga, Kenyon, and Carpenter (2006)

Papers in Language Testing and Assessment Vol. 4, issue 1, 2015 65
investigated the relationship between university students’ performances on a self-
assessment and a computerized oral proficiency test of foreign language. It was
found that 98% of the students in that study could successfully use the self-
assessment to select the test tasks that were appropriate to their foreign language
proficiency levels. Furthermore, the correlation between the self-assessment and
teacher ratings of oral proficiency ranged from .74 to .81.
In a validation study of the TOEFL iBT, a self-assessment, along with academic
placement and instructor’s ratings, was used as a piece of evidence for the
extrapolation inference (Enright, Bridgeman, Eignor, Lee, & Powers, 2008). Using
confirmatory factor analysis, Enright et al. (2008) identified four factors
corresponding to the four sub-skills (reading, listening, speaking, and writing) in
the self-assessment. The four factors in the self-assessment were found to have a
moderate and positive correlation with test-taker’s performance on both TOEFL
PBT and the prototype measures of the TOEFL iBT, with the correlation
coefficients ranging from .30 to .62. Enright et al. (2008) regarded the magnitude of
correlation to be ‘high’ and ‘similar in magnitude to other test-criterion
relationships’ (p. 178).
Based on the studies discussed above, self-assessment has the potential to be used
as one of the external criteria in language testing research. The main goal of the
study was to develop a contextualized self-assessment of English use as a tool to
validate the MEPT. Accordingly, three research questions were raised in this study
pertaining to the self-assessment and the MEPT.
1) How did the self-assessment items function in terms of reliability, item difficulty
and discrimination?
2) To what extent did the factor structure of self-assessment items reflect the
intended constructs?
3) To what extent were students’ MEPT performances related to their self-
assessment of English use and their TOEFL iBT scores?
The first two research questions focused on the quality of the self-assessment tool
and the third research question addressed the extrapolation inference of the MEPT
as shown by the relationship among the three English measures (self-assessment,
the MEPT, and the TOEFL iBT).

66 Z. Li
Methodology
Participants
The participants in this study were the newly admitted ESL students at a large
Midwestern university in the U.S. A total of 217 ESL students participated in this
study; 213 were enrolled in the ESL courses based on their performance on the
MEPT and the remaining four participants either passed the MEPT or were waived
from taking the ESL courses. Unfortunately, this study did not include the students
with a high TOEFL iBT or IELTS score, who were exempted from the MEPT. To
ensure a good quality of the self-assessment data, I manually screened the data to
identify the participants who spent little time on the self-assessment or showed
disingenuous response patterns in the self-assessment. This screening process cut
down the sample size from 217 to 181, but yielded a better quality data set for
analysis. This sample size is adequate for Rasch model analysis and acceptable
confirmatory factor analysis with a participant to item ratio of 8:1 (Worthington &
Whittaker, 2006).
Of the remaining 181 participants, 73 were females, 105 were males, and three
participants did not specify their gender. First languages of the participants
included Chinese (101), Korean (29), Malay (8), Hindi (8), Arabic (7), Indonesian
(1), Turkish (1), Vietnamese (1), Spanish (1), Thai (1), and other unspecified
languages. 123 of the participants were undergraduate students and 58 were
graduate students. 91 participants took the MEPT at the beginning of the spring
semester in 2014. 83 participants took the MEPT in 2013 but were enrolled in some
ESL courses in the 2014 spring semester, which means they have been studying in
the U.S. for at least one semester. Three participants took the EPT in 2012 and four
participants did not provide this information.
Instruments
The English Placement Test
The MEPT is a post-entry English test for new international students whose native
language is not English. There are three sections in the MEPT, namely, reading
comprehension, listening comprehension, and essay writing. Correspondingly, the
MEPT scores represent three skills of ESL learners’ academic English proficiency,
i.e., reading, listening, and writing skills. The scores are used as indicators of
whether the students need further ESL assistance and as a criterion for the
decisions of ESL course placement.

Papers in Language Testing and Assessment Vol. 4, issue 1, 2015 67
The self-assessment of English use
The contextualized self-assessment was developed as a part of a comprehensive
online survey, which consisted of 54 statements on a six-point Likert scale in five
sections: Self-assessment of English use (21 items), Academic self-efficacy (5 items),
Learning motivation (8 items), Self-regulated learning strategies (10 items), and
Anxiety about using English (10 items) (see Appendix for the self-assessment
items). All the items had been piloted with a small number of students from the
target population and reviewed by experts in Applied Linguistics. In this study, I
focused on the quality of the self-assessment items only.
The self-assessment items were developed based on the literature of self-
assessment research and informal interviews with ESL students for their typical
English use at the university. The self-assessment descriptors in European
Language Portfolio (ELP) (B1-C1) and descriptors in ACTFL (Intermediate high to
Advanced-low) were reviewed and some descriptors were modified to
accommodate the language use scenarios in university context. The self-assessment
items were written as ‘can-do’ statements about the four skills (i.e., listening,
reading, speaking, and writing) with reference to students’ activities in content
courses or major courses.
Procedures
To reach a satisfying response rate to the self-assessment, I visited the ESL classes
to recruit participants and I sent an invitation email to the ESL students who
passed the EPT or were waived from taking the ESL courses in weeks six and
seven in the spring semester in 2014. The timing of the self-assessment
administration was decided with a consideration that students could better self-
assess English proficiency in academic contexts when they were familiar with the
English language requirements in their content courses. The self-assessment was
administered and distributed via Qualtrics, a web-based survey service. An
electronic informed consent form was presented on the first page of the online
survey and voluntary participation was stressed in the informed consent form.
The test performance data, including participants’ TOEFL iBT or IELTS scores and
their MEPT scores were obtained from the Registrar’s office and the EPT office
with an approval from the Institutional Review Board (IRB) at the university. All
the test performance data were de-identified for analysis after being matched to
participants’ self-assessment responses.

68 Z. Li
Data analysis
In the study, I took a quantitative approach to investigating the quality of the self-
assessment tool and exploring its relationship with the MEPT and the TOEFL iBT.
SPSS 21 (IBM Corp. 2012), Amos 21, and Winsteps 3.64.0 (Linacre, 2011) were used
for quantitative data analysis.
To examine the quality of the self-assessment items, a Rash model-based item
analysis was conducted to investigate the item reliability, person reliability, item
difficulty, item discrimination, and scale functioning using Winsteps. The
assumption of unidimensionality was checked with both exploratory factor
analysis (maximum likelihood extraction and promax rotation) and Rasch
principal component analysis of residuals. Since the self-assessment items were
constructed based on the same six-point Likert scale, Andrich’s rating scale model
was considered as an appropriate model for the polytomous responses in this
study (Bond & Fox, 2007).
To examine the factor structure of the self-assessment items, I followed the
procedures and suggestions for scale development and validation proposed by
Worthington and Whittaker (2006). The factor structure was investigated using
confirmatory factor analysis with three theoretically plausible models of English
proficiency proposed and tested. Considering the typical non-normal distribution
associated with Likert-scale based items (Leung, 2011), bootstrapping was used in
the confirmatory factor analysis to address the issue of non-normality.
Bootstrapping is a re-sampling technique that treats the sample as a population
from which multiple sub-samples are randomly drawn with replacement. In
confirmatory factor analysis, the random samples generated with bootstrapping
are analyzed separately and the results are averaged across these samples (Brown,
2006).
Multiple model fit indices were employed to help decide which model fitted best.
Chi-square (χ
2
) was reported as the classic goodness-of-fit index in this study. A
non-significant chi-square (p > .05) indicates that we should fail to reject the null
hypothesis that the proposed model generates the same variances and covariances
as those in the sample data. However, chi-square is sensitive to sample size. In this
study, I also reported the ratio of chi-square to degree of freedom (χ
2
/df) with a
value less than 2.0 being regarded as good model fit (Tabachnick & Fidell, 2013). In
addition, comparative fit index (CFI) as a type of relative fit indices compares the
chi-square value to a baseline model. A CFI of .90 or .95 is indicative of good model
fit (Bryne, 2010). Lastly, the root mean square error of approximation (RMSEA) is

Papers in Language Testing and Assessment Vol. 4, issue 1, 2015 69
used as an absolute model fit index, which penalizes poor model parsimony and is
usually accompanied with a 90% confidence interval to gauge the index precision
(Brown, 2006). A RMSEA value less than 0.05 indicates a good model fit and 0.08
indicates an acceptable model fit. The final factor structure was determined based
on the model fit indices and theoretical soundness.
Once the factor structure of the self-assessment was determined, factor scores of
the identified constructs in the self-assessment were calculated for each participant
and used in the subsequent correlational analyses. A multitrait-multimethod
(MTMM) matrix was constructed with the correlation coefficients between the
three measures (i.e., self-assessment, the MEPT, and the TOEFL iBT) of four traits
or subskills (i.e., reading, listening, speaking, and writing). The IELTS scores were
excluded from this MTMM matrix due to a small number of participants who
reported IELTS scores. The MTMM matrix consisted of Pearson’s r and Spearman’s
rho. The latter was for the correlation coefficients involving the MEPT writing
grade, which is on a three-point ordinal scale. Evidence about convergent validity,
discriminant validity, and test methods was collected from an analysis of the
MTMM matrix. Due to a lack of reliability information for some sections of the
measures, the correlation coefficients discussed in this paper are the raw
coefficients without correction for attenuation, unless otherwise specified.
Results and Discussions
The quality of the self-assessment
To evaluate the quality of the self-assessment tool, a Rasch measurement analysis
using the rating scale model was conducted for each of the subscales. The decision
of running separate Rasch analyses for each subscale was made based on the result
of an exploratory factor analysis. This decision was confirmed with the results of
Rasch principal component analysis of residuals (see Table 1). The proportion of
variance explained by the first dimension is substantial (from 71.1% to 78.1%) and
the eigenvalue for the first contrast is less than 2.0 in all four subscales (Linacre,
2011).
Table 1 also shows the reliability information of the four subscales. The person
reliability, an equivalent of Cronbach’s alpha in the Rasch measurement analysis,
ranged from 0.86 to 0.89 and the person separation index ranged from 2.46 to 2.89.
The item reliability in the Rasch measurement analysis refers to the replicability of
the item ordering if the items are administered to a group of subjects with similar
abilities. The item reliability of the subscales ranged from 0.88 to 0.98 and the item

70 Z. Li
separation index ranged from 2.69 to 7.72. Overall, the four subscales of the self-
assessment tool exhibited acceptable reliability.
Table 1. Results of Rasch measurement analysis: reliability and unidimensionality check (N = 181)
Self-assessment
Subscale
Person
Separation
Person
reliability
Item
Separation
Item
reliability
Variance
explained
Eigenvalue for
1st contrast
Reading (k=5)
2.46 .86 7.72 .98 74.4% 1.9
Listening (k=5)
2.75 .88 4.54 .95 78.1% 1.6
Speaking (k=5)
2.89 .89 2.69 .88 74.0% 1.7
Writing (k=6)
2.78 .89 2.81 .89 71.7% 1.5
To examine the item quality, descriptive statistics, Rasch item measures, and
item-level fit statistics were reported for each subscale in Table 2. The descriptive
statistics reveal that the means of the responses were relatively high, ranging from
3.98 to 5.18. The standard deviations were also large, ranging from 0.94 to 1.27.
This suggests that the participants in general evaluated their English subskills in a
positive way and there was some variability in their responses. Some self-
assessment items had high skewness and/or kurtosis, thus calling for a careful look
at the data distribution.
The item measure or endorsability of the self-assessment statement is estimated on
the common scale with logit as the measurement unit. Overall, the self-assessment
items showed a relatively narrow range in item measure (-1.82 to 1.70). In a rating
scale model, an estimation of the threshold value of the Likert scale is more
meaningful as it tests the functionality of the scale, which will be discussed later.

Papers in Language Testing and Assessment Vol. 4, issue 1, 2015 71
Table 2. Results of Rasch measurement analysis: item measure and fit statistics
SA
Section
Items Item
measure
(logit)
S.E. Infit
MNSQ
Outfit
MNSQ
Point-
biserial
coefficient
M SD Skew-
ness
Kur-
tosis
Reading
Rd1 -1.82 0.16 1.13 1.07 .79 5.18 0.97 -1.83 4.46
Rd2 -0.21 0.14 1.03 1.02 .82 4.79 0.97 -0.89 1.19
Rd3 -0.38 0.15 0.68 0.65 .87 4.83 0.98 -1.13 2.14
Rd4 1.70 0.13 1.34 1.34 .79 4.23 1.10 -0.35 -0.03
Rd5 0.71 0.14 0.85 0.89 .85 4.54 0.94 -0.57 0.80
Listening
Lsn1 -1.02 0.13 0.77 0.77 .84 4.67 1.07 -1.20 1.67
Lsn2 0.76 0.12 1.00 1.04 .85 4.04 1.27 -0.31 -0.51
Lsn3 -0.02 0.12 0.84 0.81 .86 4.34 1.08 -0.44 0.14
Lsn4 0.37 0.12 1.27 1.32 .81 4.19 1.23 -0.94 -0.56
Lsn5 -0.09 0.12 0.99 0.96 .83 4.36 1.09 -0.57 0.25
Speaking
Spk1 -0.67 0.14 0.81 0.79 .90 4.32 1.14 -0.44 -0.28
Spk2 0.08 0.14 0.87 0.87 .86 4.08 1.05 0.63 0.29
Spk3 0.47 0.14 0.97 0.99 .85 3.98 1.09 -0.30 -0.16
Spk4 0.32 0.14 1.05 1.03 .84 4.02 1.07 -0.37 -0.27
Spk5 -0.20 0.14 1.26 1.25 .84 4.18 1.14 -0.29 -0.30
Writing
Wrt1 -0.04 0.13 1.05 1.02 .81 4.30 1.01 -0.27 -0.26
Wrt2 -0.30 0.13 1.07 1.00 .81 4.38 1.03 -0.48 0.14
Wrt3 -0.16 0.13 0.80 0.83 .83 4.33 0.99 -0.62 0.76
Wrt4 0.85 0.13 1.10 1.13 .80 3.99 1.05 -0.28 -0.20
Wrt5 -0.01 0.13 0.81 0.83 .84 4.29 0.99 -0.36 0.06
Wrt6 -0.35 0.13 1.12 1.08 .77 4.40 0.98 -0.49 0.10

72 Z. Li
According to Bond and Fox (2007), the infit and outfit mean squares (MNSQ) as
unstandardized fit statistics are used to assess whether an item functions as the
Rasch model expects. Infit is a weighted fit statistic and is less sensitive to outliers,
compared with outfit, an unweighted fit statistic. The expected mean square value
of the infit and outfit statistics is 1.0. The value range from 0.5 to 1.5 is generally
regarded as an acceptable fit to the Rasch model (Green, 2013). As shown in Table
2, all the mean square values of the infit and outfit statistics were within the range
of 0.5 to 1.5, indicating that the self-assessment items were functioning as the Rasch
model predicted. Another relevant item quality index is the point-biserial
correlation coefficient of each item, which is the discrimination index in the
classical test theory (CTT) framework. All the self-assessment items had relatively
high point-biserial correlation coefficients (.77 to .90), which indicates that the self-
assessment items had a good discrimination among the participants.
Similar to the consideration of item fit in Rasch analysis, the categories of
the Likert scale should also exhibit a good model fit. According to Bond and Fox
(2007), the following four characteristics of a rating scale should be checked: the
count frequency, monotonicity of category average measures, threshold or step
calibrations, and category fit. It is recommended that the count for each category
should be no less than 10, the distance between thresholds should be at least 1.4
logits but less than 5 logits, and the infit statistics for each category should be
acceptable. Tables 3 to 6 contain the category functioning information for each
subscale of the self-assessment items.
Table 3 shows that the responses to the reading self-assessment items were highly
skewed with only 11% of the responses falling into the first three categories,
namely ‘Strongly disagree’, ‘Disagree’, and ‘Somewhat disagree’. There were only
three responses in the category of ‘Strongly disagree’. This low frequency suggests
that this category may be redundant. The skewness in the reading subscale may
reflect that the ESL students in general have a relatively high proficiency in
academic reading. Since low category counts may lead to a less reliable estimate of
the threshold value (Bond & Fox, 2007), it is advisable to collapse the adjacent
categories to revise the scale for a correct interpretation of the scale.
Papers in Language Testing and Assessment Vol. 4, issue 1, 2015 73
Table 3. Results of Rasch measurement analysis: Rating scale category statistics for the reading
section
Cate-
gory
Reading with original scale Reading with revised scale
Count
(%)
Obs.
average
Infit
/Outfit
MNSQ
Structure
calibration
Count
(%)
Obs.
average
Infit/
Outfit
MNSQ
Structure
calibration
1
3 (0%) -3.75 2.60/1.66 None
2
25 (3%) -2.60 1.27/1.23 -6.41 18 (2%) -3.13 1.41/1.38 None
3
65 (8%) 0.09 1.12/1.17 -2.09 65 (8%) -1.51 1.12/1.24 -3.77
4
232 (28%) 1.93 0.92/0.90 -0.21 232 (28%) 0.33 0.92/0.90 -1.82
5
366 (44%) 4.02 1.03/0.98 2.53 366 (44%) 2.45 1.04/0.99 0.94
6
139 (17%) 6.52 0.89/0.88 6.19 139 (17%) 4.99 0.90/0.88 4.46
The statistics related with the revised scale are listed on the right side of Table 3.
The observed average ability of the participants increased monotonically in the
revised scale, from -3.13 to 4.99. This indicates that the participants with higher
ability tended to endorse or choose a higher category. Both infit and outfit mean
squares of each category were within the acceptable range (from 0.5 to 1.5). The
distances between thresholds were greater than 1.4 logits but less than 5 logits.
This clear monotonic change pattern in threshold value can be observed in the
category probability curves for the Reading (SA_R1), Listening (SA_L1), Speaking
(SA_S1) and Writing (SA_W1) subscales respectively (Figure 3). Overall, the Likert
scale for the reading items functioned well.

74 Z. Li

Papers in Language Testing and Assessment Vol. 4, issue 1, 2015 75
Figure 3. Category probability curves for the subscales of self-assessment.
The Likert scale for the listening items also exhibited good qualities, as shown in
Table 4. The responses to the listening self-assessment items were less skewed
compared with those to the reading items. The response counts met the minimum
requirement (10) for a functioning scale. As expected, the observed average ability
of the participants increased monotonically along the Likert scale. Both infit and
outfit mean squares of each category were within the acceptable range from 0.5 to
1.5. The distances between thresholds were greater than 1.4 logits but less than 5
logits. This clear monotonic change pattern in threshold can be observed in the
category probability curve in Figure 3.

76 Z. Li
Table 4. Results of Rasch measurement analysis: Rating scale category statistics for the listening
section
Category Listening with original scale
Count (%) Obs. average Infit /Outfit MNSQ Structure
calibration
1
16 (2%) -4.09 1.16/1.12 None
2
54 (6%) -2.41 0.92/0.99 -4.44
3
125 (14%) -0.47 0.89/0.88 -2.19
4
273 (31%) 1.12 0.98/0.98 -0.44
5
302 (35%) 2.90 1.00/0.99 1.84
6
100 (11%) 5.38 1.09/1.05 5.23
The Likert scale for the speaking and writing items functioned well as shown in
Tables 5 and 6. However, the responses to the speaking and writing self-
assessment items were slightly skewed with a majority of the responses falling into
the last three categories, namely ‘Somewhat Agree’, ‘Agree’, and ‘Strongly agree’.
Similar to the response pattern in the reading items, there were low count
frequencies in the category of ‘Strongly disagree’. Therefore, the first two
categories were collapsed into one category for a reasonable interpretation of the
Likert scale.
The statistics related with the revised scale are listed on the right side of Tables 5
and 6. As shown below, the observed average ability of the participants increased
monotonically in the revised scale. Both infit and outfit mean squares were within
the acceptable range from 0.5 to 1.5. The distances between thresholds were greater
than 1.4 logits but less than 5 logits. The monotonic change patterns in threshold
can be observed in the category probability curve in Figure 3.

Papers in Language Testing and Assessment Vol. 4, issue 1, 2015 77
Table 5. Results of Rasch measurement analysis: Rating scale category statistics for the speaking
section
Cate-
gory
Speaking with original scale Speaking with revised scale
Count
(%)
Obs.
average
Infit
/Outfit
MNSQ
Structure
calibration
Count
(%)
Obs.
average
Infit/
Outfit
MNSQ
Structure
calibration
1 7 (1%) -7.15 0.94/1.01 None
2 60 (7%) -2.63 1.15/1.15 -7.23 52 (6%) -3.82 1.14/1.14 None
3 174 (20%) -0.53 1.01/1.02 -2.58 174 (20%) -2.32 1.01/1.03 -4.36
4 304 (34%) 1.69 0.94/0.94 0.02 304 (34%) -0.12 0.93/0.93 -1.78
5 276 (31%) 4.16 1.02/0.99 3.01 276 (31%) 2.34 1.01/0.99 1.20
6 69 (8%) 6.63 0.93/0.90 6.78 69 (8%) 4.79 0.92/0.90 4.94
Table 6. Results of Rasch measurement analysis: Rating scale category statistics for the writing
section
Cate-
gory
Writing with original scale Writing with revised scale
Count
(%)
Obs.
average
Infit
/Outfit
MNSQ
Structure
calibration
Count
(%)
Obs.
average
Infit/
Outfit
MNSQ
Structure
calibration
1 7 (1%) -5.01 1.00/0.97 None
2 45 (4%) -1.77 1.09/1.10 -5.16 52 (5%) -3.42 1.14/1.16 None
3 168 (16%) -0.57 0.88/0.87 -2.48 168 (16%) -1.87 0.84/0.86 -3.77
4 386 (36%) 1.14 0.93/0.92 -0.52 386 (36%) -0.15 0.95/0.94 -1.81
5 374 (35%) 3.39 0.95/0.95 2.21 374 (35%) 2.11 0.94/0.94 0.92
6 88 (8%) 5.51 1.31/1.17 5.95 88 (8%) 4.22 1.31/1.17 4.65

78 Z. Li
Overall, the Rasch analysis results indicate that the self-assessment items have a
good quality in terms of reliability, item discrimination, item fit statistics, and scale
functioning.
The factor structure of the self-assessment tool.
In order to examine the factor structure of the self-assessment tool, confirmatory
factor analysis was used to assess how well the data fit three theoretically plausible
models, namely correlated four-factor model, unitary factor model, and secondary
factor model (see Figure 5). These three models were proposed based on different
views of the constructs of English proficiency (Sawaki, Stricker, & Oranje, 2009;
Song, 2008). In Figure 5, the circles represent the latent variables measured in the
self-assessment and the rectangular boxes represent the specific self-assessment
items as observed variables.

Papers in Language Testing and Assessment Vol. 4, issue 1, 2015 79
Figure 5. Proposed models of English proficiency as measured by the self-assessment.
The specified models were identified using the t-rule and correlated errors rule.
The t-rule is a necessary but not sufficient condition for model identification and it
states that the number of freely estimated parameters should be less than or equal
to the number of known parameters for model identification (Bollen, 1989). The
correlated errors rule is a sufficient but not necessary condition of identification. It
is an expansion of two-indicator rule and three-indicator rule and allows for
limited correlation among the measurement errors.
The assumption of both univariate and multivariate normality of the sample data
was checked. It is found that the data did not follow a normal distribution. The

80 Z. Li
critical ratio for univariate skewness ranges from -9.949 to -1.464 and the critical
ratio for the univariate kurtosis ranges from 0.186 to 11.831. The multivariate
kurtosis is 79.550 with a critical ratio 17.224. The Mahalanobis distance was
checked for potential multivariate outliers. Considering the non-normality of the
data, bootstrapping was used (2000 bootstrap samples) to determine parameter
estimates and the Bollen-Stine corrected p value of the chi-square was reported
(Byrne, 2010).
The model fit indices for the three proposed models are listed in Table 7. The chi-
square values for the three models were statistically significant (p < .001) and the
Bollen-Stine p values for chi-square were also statistically significant, which
suggests a rejection of the null hypothesis that the variances and covariance
generated by the models are the same as the ones in the sample. However, the
other model fit indices, including χ
2
/df, CFI, and RMSEA, all indicated an
acceptable to good model fit of the three models. The values of CFI were over .90
and the values of the RMSEA were less than .08, while only the χ
2
/df of unitary
factor model was over 2.0.
By comparison, the correlated four-factor model showed the best model fit with
smallest χ
2
/df (1.767), highest CFI (.956), and lowest RMSEA (.065). In addition, the
chi-square difference tests between the correlated four-factor model and two other
models suggest that the correlated four factor model fitted the data better (∆χ
2
(7)M1-
M2
= 40.02, p < .001 and ∆χ
2
(2) M1-M3 = - 32.71, p < .001).
Table 7. Model fit indices of the competing models for the self-assessment
Model χ
2
(df) p value χ
2
/df CFI RMSEA
90% C.I.
Bollen-Stine
bootstrap p-value
M1 Correlated
4-factor model
310.94
(176)
.000 1.767 .956 .065
(.053, .077)
.015
M2 Unitary
factor model
350.96
(169)
.000 2.077 .940 .077
(.066, .089)
.005
M3 Secondary
factor model
343.65
(178)
.000 1.931 .946 .072
(.060, .083)
.004
Note: CFI = comparative fit index, RMSEA = the root mean square error of approximation.
Nearly all of the standardized factor loadings in the correlated four-factor model
were over .7, except for two reading items (.670 and .684). The four subskills

Papers in Language Testing and Assessment Vol. 4, issue 1, 2015 81
represented as four latent constructs showed high correlation coefficients among
them. The highest correlation is between speaking and writing (.89), followed by
the correlation between listening and speaking (.85) and between reading and
listening (.84). Reading had a relatively lower correlation with speaking (.68) and
writing (.77).
The results from confirmatory factor analysis indicate that the self-assessment
covered four correlated constructs as measured by the items designed to tap four
subskills.
The relationship among self-assessment, the MEPT, and the TOEFL iBT.
Once the factor structure was determined, a factor score of each subskill was
calculated for each participant and used in the follow-up correlation analysis. In
this study, standardized regression-based factor scores were calculated in Amos
21. The descriptive statistics for the three measures, namely the self-assessment,
the MEPT, and the TOEFL iBT, are listed in Table 8. Most of the scores from the
three measures were not normally distributed, as indicated by a significant
Shapiro-Wilk p value.
The EPT test administered in the spring 2014 semester was a revised version of the
MEPT test used in the fall 2013 semester. The two versions of the MEPT were
mainly different in terms number of items in the reading and listening sections (25
in 2013 vs. 35 in 2014). To examine the relationship among the three measures, the
correlation coefficients among these measures were calculated for the fall 2013 and
spring 2014 semesters separately. The sample sizes in the correlation analyses were
only 56 in 2013 and 62 in 2014 because there were some missing data in the three
measures. The cases with missing data were deleted listwise for correlation
analysis. Spearman’s rho was reported for the correlation that involves the MEPT
writing scores and Pearson’s r was used for other correlations.

82 Z. Li
Table 8. Descriptive statistics for the three measures
Test Section N M S.D Skewness Kurtosis Shapiro-Wilk
p value
MEPT
a
Reading 166 51.30 13.10 0.10 -0.23 .261
Listening 166 51.93 16.32 0.35 -0.35 .104
Writing 178 1.61 0.57 0.28 -0.75 .000
TOEFL
Reading 146 17.97 7.65 -0.35 -1.04 .044
Listening 146 17.10 7.08 -0.44 -1.02 .051
Speaking 146 16.39 6.10 -0.89 -0.63 .000
Writing 146 17.63 7.02 -0.84 -0.74 .001
Total 115 82.28 10.05 0.23 -0.67 .025
SA
b
Reading 181 0 0.62 -0.68 1.57 .000
Listening 181 0 0.82 -0.65 0.79 .001
Speaking 181 0 0.86 -0.54 0.42 .012
Writing 181 0 0.73 -0.44 0.62 .033
Note: a. The scores of reading and listening sections of the MEPT were converted to a 100-point
scale. b. The scores of the self-assessment sections were standardized factor scores.
The multitrait-multimethod matrices with raw correlation coefficients for the fall
2013 semester and the spring 2014 semester are shown in Tables 9 and 10,
respectively, which are color-coded for three types of correlations: heterotrait-
monomethod correlations in yellow, heterotrait-heteromethod correlations in blue,
and monotrait-heteromethod correlations in green. In addition, the reliability
information, if available, is listed on the diagonal line. The correlation coefficients
of interest in this study were the monotrait-heteromethod correlations because
they revealed the relationship among the measures of the same subskills. In other
words, they represent the evidence of convergent validity.
As shown in Table 9, the correlation coefficients between the self-assessment
sections and the MEPT in the spring 2014 semester were relatively low in the

Papers in Language Testing and Assessment Vol. 4, issue 1, 2015 83
monotrait-heteromethod cells, ranging from .150 to .373. Even after taking account
of the low reliability of the MEPT (.62 and .69 for the reading and listening
sections), the disattenuated correlation coefficients in the monotrait-heteromethod
cells were only slightly higher than the raw correlation coefficients (.264 vs. .193 for
reading subskill and .192 vs. .150 for the listening subskills). The highest
correlation coefficient was between the writing subskills measured by the MEPT
and the self-assessment and it is statistically significant (.373). Overall, the
magnitude of these correlation coefficients suggests that the self-assessment
sections had a relatively weak to moderate relationship with the corresponding
MEPT sections and that the self-assessment items may have measured somewhat
different constructs compared with the corresponding MEPT sections. However,
the significant correlation coefficient between the writing subskills measured by
self-assessment and the MEPT indicates that students’ self-assessment had a
relatively stronger relationship with their earlier performances on the MEPT
writing section. This may reflect the characteristics of the participants, the majority
of whom were placed into different levels of academic English writing classes with
only a small number placed in either ESL reading classes or listening classes.
The correlation coefficients in the heterotrait-heteromethod cells between the self-
assessment sections and the MEPT in the spring 2014 semester were relatively
higher, ranging from .168 to .424. The heterotrait-heteromethod correlations are
related with the discriminant validity and they are expected to be relatively lower
than the monotrait-heteromethod correlations. It is noteworthy that the correlation
coefficients (Spearman’s rho) between the writing section of the MEPT and other
sections of the self-assessment were all statistically significant (.350 to .424). This, to
some extent, lends support to the speculation that the self-assessment items at least
reflected participants’ proficiency in English writing. Overall, students’ self-
assessment exhibited some significant correlation with the MEPT, even though the
overall relationship between them was relatively weak.
The monotrait-heteromethod correlations of the same subskills between the self-
assessment sections and the TOEFL iBT sections in the spring 2014 semester
ranged from .120 to .368. The disattenuated correlation coefficients for the reading
and listening subskills are .136 and .272, respectively. This is similar to the
correlation coefficient pattern between the MEPT and the self-assessment.
Nevertheless, a noticeable difference is that the correlations between the TOEFL
iBT speaking and the four subskills in the self-assessment were all statistically
significant, ranging from .314 to .369 while the correlations between the TOEFL iBT
writing and the four subskills in the self-assessment were not (.208 to .216). Among

84 Z. Li
the heterotrait-heteromethod correlation coefficients, the reading self-assessment
had a statistically significant correlation with the TOEFL iBT listening section
(.293). Participants’ self-assessment exhibited some significant correlation with the
TOEFL iBT, even the overall relationship between them was relatively weak.
The heterotrait-monomethod correlations among the self-assessment sections were
very high, ranging from .857 to .956. This test method effect is in line with the
findings in Bachman and Palmer (1981). The heterotrait-monomethod correlations
among the MEPT sections were moderate, ranging from .316 to .504. The
heterotrait-monomethod correlations among the TOEFL iBT sections varied from -
.067 to .631.

Papers in Language Testing and Assessment Vol. 4, issue 1, 2015 85
Table 9. Mutlitrait-multimethod correlation matrix for the spring 2014 data (N=62)
Self-assessment (SA) MEPT TOEFL iBT
Rd
a
Lsn Spk Wrt Rd Lsn Wrt Rd Lsn Spk Wrt
SA
Rd (.87)
Lsn .922**
b
(.88)
c
Spk .857** .923** (.91)
Wrt .890** .884** .956** (.89)
MEPT
Rd .193
a
.250 .283* .248 (.62)
Lsn .168 .150 .171 .168 .504** (.69)
Wrt .350** .397** .424** .373** .325* .316* (n/a)
TOEFL iBT
Rd .120 .014 .040 -.030 -.008 .265* .056 (.90)
Lsn .293* .230 .165 .176 .064 .336* .025 .631** (.81)
Spk .314* .369** .368** .317* .416** .345** .293* -.067 .149 (n/a)
Wrt .216 .208 .209 .215 .275* .467** .302* .189 .103 .369** (n/a)
Total .322* .263* .212 .224 .152 .524** .227 .800** .801** .404** .536**
Note: * p < .05, ** p < .01. a. Factor score for each subscale of the self-assessment was used in the correlation analyses. b. The correlation coefficients
associated with METP writing are Spearman’s rho and the other correlation coefficients are Pearson’s r. All the correlation coefficients are raw
correlation without correction for attenuation. c. The reliability of each test, if available, is listed on the diagonal. The reliability of the TOEFL iBT
subsection is an estimated KR21 reliability using mean and standard deviation assuming the number of item is 30.

86 Z. Li
Table 10. Mutlitrait-multimethod correlation matrix for the fall 2013 data (N=56)
Self-assessment (SA) MEPT TOEFL iBT
Rd
a
Lsn Spk Wrt Rd Lsn Wrt Rd Lsn Spk Wrt
SA
Rd (.87)
Lsn .901**
b
(.88)
c
Spk .658** .944** (.91)
Wrt .802** .857** .899** (.89)
MEPT
Rd .009
a
.033 .102 .052 (.60)
Lsn .172 .142 .078 .127 .446** (.69)
Wrt -.071 -.098 -.035 -.026 .307* .003* (n/a)
TOEFL iBT
Rd .208 .076 -.009 -.120 .378** .127 .378** (.90)
Lsn .183 .197 .136 .115 .552** .356** .228 .633** (.81)
Spk -.067 -.062 .053 -.029 .332* .208 .391** .001 .184 (n/a)
Wrt .163 .132 .144 .171 .146 .147 339* .170 .230 .470** (n/a)
Total .217 .144 .112 .150 .520** .308* .394** .786** .851** .431** .571**
Note: * p < .05, ** p < .01. a. Factor score for each subscale of the self-assessment was used in the correlation analyses. b. The correlation coefficients
associated with METP writing are Spearman’s rho and the other correlation coefficients are Pearson’s r. All the correlation coefficients are raw
correlation without correction for attenuation. c. The reliability of each test, if available, is listed on the diagonal. The reliability of the TOEFL iBT
section is an estimated KR21 reliability using mean and standard deviation assuming the number of item is 30.

Papers in Language Testing and Assessment Vol. 4, issue 1, 2015 87
By comparison, two of the monotrait-heteromethod correlation coefficients
between the MEPT listening and writing sections and the corresponding the
TOEFL iBT sections in the spring 2014 semester were also low in magnitude but
statistically significant (.336 and .302). However, the correlation between the MEPT
reading and the TOEFL iBT reading section in the spring 2014 semester was
extremely low (-.008). It appears that the MEPT also had a relatively weak
relationship with the TOEFL iBT scores at least for this sample student group in
2014.
A closer look at the multitrait-multimethod matrix in Table 10 reveals that the
relationship between the self-assessment and the MEPT in the fall 2013 semester
was even weaker as none of the monotrait-heteromethod correlation coefficients
between them were statistically significant (-.026 to .142). However, this is
understandable given the time which had elapsed between the two measures
(more than one semester). Similarly, the relationship between the self-assessment
and the TOEFL iBT scores was weaker and the monotrait-heteromethod correlation
coefficients between them were slightly higher than those between the self-
assessment and the MEPT in the fall 2013 semester but still not statistically
significant (.053 to .208).
The monotrait-heteromethod correlation coefficients between the MEPT in 2013
and the TOEFL iBT sections were higher than those between the MEPT in 2014 and
the TOEFL iBT sections. Furthermore, the correlation coefficient between the
reading skills measured by the MEPT 2013 and the TOEFL iBT was .378, which is
similar to the correlation coefficients between listening and writing measured with
the MEPT 2013 and the TOEFL iBT. These differences in the correlation coefficients
between the two administrations of the MEPT test and the TOEFL iBT sections
suggest that the MEPT versions used in 2013 and 2014 may have tapped into the
same constructs in different ways.
There are several factors that can affect the relationship among the three measures.
Firstly, the constructs measured with the self-assessment were not necessarily the
same as the ones measured by the MEPT. All the can-do statements in the self-
assessment were phrased with a clear reference to specific academic activities at
the university, such as reading textbook and maintaining discussion with
classmates. Students may have evaluated their English proficiency globally in
these academic activities. On the other hand, the constructs defined in the
specifications of the MEPT and the TOEFL iBT may be different. What’s more, the
MEPT items as well as the TOEFL iBT items may have tested specific linguistic
skills in a more analytic way.

Z. Li
88
Secondly, the sample sizes in the correlation analyses with the MEPT tests in 2014
and 2013 were only 62 and 56, respectively. Therefore, the samples may
underrepresent the population and the resultant English proficiency range was
narrower, which may lead to the low correlation. This is evident when the
monotrait-heteromethod correlations between the MEPT and the TOEFL iBT in
2014 in this study (n= 62) are compared with a larger data set in the same MEPT
administration (n= 129). The correlations in the large data set were .220 for
reading, .453 for listening, and .403 for writing, whereas the correlations in the
smaller sample in this study were -.008 for reading, .336 for listening, and .302 for
writing.
Finally, the time interval between the self-assessment and other two measures is
critical in reflecting students’ English proficiency. The self-assessment was
administered in weeks six and seven of the spring semester in 2014, which means
the participants who took the MEPT in 2014 had spent about one and half months
in various English-medium classrooms at the university. This immersion may have
helped students improve their English at different rates and this improvement may
have affected the correlation between students’ self-assessment and their MEPT
scores and TOEFL iBT scores, which were received much earlier than the self-
assessment.
Considering the confounding factors discussed above, it is less surprising to see
the low correlation coefficients between the self-assessments and the MEPT and
the TOEFL iBT. Overall, the self-assessment had relatively weak to moderate
relationships with the MEPT and the TOEFL iBT in this study. However, the
existence of the significant correlation coefficients between the self-assessment and
other two measures still suggests a limited but promising utility of the self-
assessment as a tool to validate the MEPT.
Conclusions and Implications
The results of Rasch model-based item analysis indicated that the self-assessment
items exhibited acceptable reliabilities and good item discrimination. There were
no misfitting items in the self-assessment and the Likert scale used in the self-
assessment functioned well as the Rasch rating scale model expected. The results
from confirmatory factor analysis indicated that the correlated four-factor model
fitted the data and the proposed four-factor structure of the self-assessment was
supported. The multitrait-multimethod analyses indicated that the self-assessment
had relatively weak to moderate relationships with both the MEPT and the TOEFL

Papers in Language Testing and Assessment Vol. 4, issue 1, 2015 89
iBT, even though there were some significant correlations between the self-
assessment and some sections of the MEPT and the TOEFL iBT in the data of 2014
spring semester.
Admittedly, the results in this study call for a cautious use of the same self-
assessment tool in future validation studies of the MEPT. As shown in the
descriptive statistics of the self-assessment items, the can-do statements seemed to
have low item measure of difficulty. Therefore, some revisions could be made to
cover more challenging academic tasks that require intensive English use. Future
studies need to reconsider the timing of the self-assessment. A shorter time gap
between the self-assessment and the MEPT may mitigate the immersion effect and
yield a more accurate reflection of ESL students’ English proficiency. Other
constructs, such as motivational factors and student academic achievements, could
be included to help interpret the self-assessment results as well as the relationship
among the three measures in a comprehensive way.
Despite the limitations, the self-assessment reported in this study appears to be a
promising tool with its acceptable psychometric quality and clear factor structure,
thus potentially useful in providing evidence for the extrapolation inference of the
MEPT score interpretation and use in future studies.
Acknowledgement
I would like to thank Volker Hegelheimer and Carol Chapelle for their generous
support and guidance in this study. I also thank the anonymous reviewers for their
insightful and constructive comments on an earlier version of this paper. Any
errors that remain are my own.

Z. Li
90
References
Alderson, J. C. (2005). Diagnosing foreign language proficiency: The interface between
learning and assessment. London, England: Continuum.
Bachman, L. F., & Palmer, A. S. (1981). A multitrait-multimethod investigation into
the construct validity of six tests of speaking and reading. In A. S. Palmer, J.
D. Groot, & G. Tropser (Eds.), The construct validation of tests of communicative
competence, TESOL ’79 , February 27- 28, 1979. Boston.
Bollen, K. A. (1989). Structural Equations with Latent Variables. New York: John
Wiley & Sons.
Bond, T. G., & Fox, C. M. (2007). Applying the Rasch model: Fundamental measurement
in the human sciences (2nd ed.). Mahwah, NJ: Lawrence Erlbaum.
Bradshaw, J. (1990). Test-takers’ reactions to a placement test. Language Testing,
7(1), 13–30.
Brantmeier, C. (2006). Advanced L2 learners and reading placement: Self-
assessment, CBT, and subsequent performance. System, 34(1), 15–35.
Brown, T. A. (2006). Confirmatory Factor Analysis for Applied Research. New York and
London: The Guilford Press.
Byrne, B. M. (2010). Structural equation modeling with Amos (2nd ed.). New York:
Routledge.
Chapelle, C., Enright, M. K., & Jamieson, J. (2008). Building a validity argument for
the Test of English as a Foreign Language. New York and London: Routledge.
Engelhardt, M., & Pfingsthorn, J. (2013). Self-assessment and placement tests – a
worthwhile combination? Language Learning in Higher Education, 2(1), 75–89.
Enright, M. K., Bridgeman, B., Eignor, D., Lee, Y.-W., & Powers, D. E. (2008).
Prototyping measures of listening, reading, speaking, and writing. In C. A.
Chapelle, M. K. Enright, & J. Jamieson (Eds.), Building a validity argument for
the Test of English as a Foreign Language (pp. 145–186). New York and
London: Routledge.
Fox, J. D. (2009). Moderating top-down policy impact and supporting EAP
curricular renewal: Exploring the potential of diagnostic assessment. Journal
of English for Academic Purposes, 8(1), 26–42.
Graham, J. G. (1987). English language proficiency and the prediction of academic
success. TESOL Quarterly, 21(3), 505–521.
Green, A. B., & Weir, C. J. (2004). Can placement tests inform instructional
decisions? Language Testing, 21(4), 467–494.

Papers in Language Testing and Assessment Vol. 4, issue 1, 2015 91
Green, R. (2013). Statistical analyses for language testers. New York: Palgrave
Macmillan.
Hellekjær, G. O. (2009). Academic English reading proficiency at the university
level: A Norwegian case study. Reading in a Foreign Language, 21, 198–222.
IBM Corp. (2012). IBM SPSS Statistics for Windows, Version 21.0. Armonk, NY:
IBM Corp.
Kane, M. T. (2013). Validating the interpretations and uses of test scores. Journal of
Educational Measurement, 50(1), 1–73.
Knoch, U., & Elder, C. (2013). A framework for validating post-entry language
assessments (PELAs). Papers in Language Testing and Assessment, 2(1), 48–66.
Kokhan, K. (2012). Investigating the possibility of using TOEFL scores for
university ESL decision-making: Placement trends and effect of time lag.
Language Testing, 29(2), 291–308.
Kokhan, K. (2013). An argument against using standardized test scores for
placement of international undergraduate students in English as a Second
Language (ESL) courses. Language Testing, 30(4), 467–489.
Le, H. T. T. (2010). Developing a validity argument for the English placement Fall 2010
Listening test at Iowa State University. Unpublished MA thesis, Iowa State
University. Ames, Iowa.
LeBlanc, R., & Painchaud, G. (1985). Self-assessment as a second language
placement instrument. TESOL Quarterly, 19(4), 673–687.
Lee, Y.-J., & Greene, J. (2007). The predictive validity of an ESL placement test: A
mixed methods approach. Journal of Mixed Methods Research, 1(4), 366–389.
Leung, S.-O. (2011). A comparison of psychometric properties and normality in 4-,
5-, 6-, and 11-point likert scales. Journal of Social Service Research, 37(4), 412–
421.
Light, R. L., Xu, M., & Mossop, J. (1987). English proficiency and academic
performance of international students. TESOL Quarterly, 21(2), 251–261.
Linacre, J. M. (2011). A User’s Guide to Winstep. Ministep Rasch-Model Computer
Programs. Chicago, IL.
Luoma, S. (2013). Self-assessment. In C. A. Chapelle (Ed.), The Encyclopedia of
Applied Linguistics. Blackwell Publishing Ltd.

Z. Li
92
Malabonga, V., Kenyon, D. M., & Carpenter, H. (2005). Self-assessment,
preparation and response time on a computerized oral proficiency test.
Language Testing, 22(1), 59–92.
Manganello, M. (2011). Correlations in the new TOEFL era: an investigation of the
statistical relationships between iBT scores, placement test performance, and
academic success of international students at Iowa State University. Unpublished
MA thesis, Iowa State University. Ames, Iowa.
Oscarson, M. (2013). Self-assessment in the classroom. In A. Kunnan (Ed.), The
companion to language assessment vol. II: Approaches and development (pp. 712–
729). New York: Wiley-Blackwell.
Phakiti, A., Hirsh, D., & Woodrow, L. (2013). It’s not only English: Effects of other
individual factors on English language learning and academic learning of
ESL international students in Australia. Journal of Research in International
Education, 12(3), 239–258.
Riazi, M. (2013). Concurrent and predictive validity of Pearson Test of English
Academic (PTE Academic). Papers in Language Testing and Assessment, 2(1),
1–27.
Ross, S. (1998). Self-assessment in second language testing: a meta-analysis and
analysis of experiential factors. Language Testing, 15(1), 1–20.
Sawaki, Y., Stricker, L. J., & Oranje, A. (2009). Factor structure of the TOEFL
Internet-based test. Language Testing, 26(1), 5–30.
Song, M. (2008). Do divisible subskills exist in second language (L2)
comprehension? A structural equation modelling approach. Language
Testing, 25(4), 435–464.
Tabachnick, B. G., & Fidell, L. S. (2013). Using multivariate statistics (6th ed.). Boston:
Pearson Education Inc.
Vinke, A. A., & Jochems, W. M. G. (1992). English proficiency and academic
success in international postgraduate education. Higher Education, 26(3),
275–85.
Worthington, R. L., & Whittaker, T. A. (2006). Scale development research: A
content analysis and recommendations for best practices. The Counseling
Psychologist, 34(6), 806–838.
Yang, H., & Li, Z. (2013). Validating an English placement by investigating factor
structure and factorial invariance. Paper presented at the 15th annual
Midwest Association of Language Testers (MwALT) conference. East
Lansing, MI.: Michigan State University.

Papers in Language Testing and Assessment Vol. 4, issue 1, 2015 93
Appendix
Self-assessment of English use in your non-ESL courses or major courses
Instructions: In this section, you are asked to think about your English use in one
required general education or major course you are taking this semesters,
Please therefore think of one course you are currently taking in your major or for
required general education credits (so not an ESL course) and write it here (for
example, Psych 101). Now please respond to the following statements about your
English experience in this course.
Below are some self-assessment statements about your use of English in the above-
listed major course. Please rate the following statements based on your own
experience.

Z. Li
94
Stron
gly
Disag
ree
Disag
ree
Some
what
Disag
ree
Some
what
Agree
Agree Stron
gly
Agree
1. I can read and understand the syllabus,
assignment sheets, equipment/software
instructions and other course materials without
any help.
2. I can find important details in my textbook,
handouts, technical manuals, and other course
materials quickly by skimming and scanning
(reading quickly).
3. I can distinguish main ideas and supporting
examples in my textbooks and other reading
materials in my major course(s).
4. I can successfully guess the meaning of
unfamiliar words or idioms (set phrases) in my
textbooks or other course materials without using
a dictionary.
5. I can identify opinions that are only suggested
or implied, as well as opinions that are clearly
stated in a textbook and/or other course materials.
6. I can understand the main ideas of lectures,
professional presentations and spoken reports in
my major.
7. I can understand lectures even when my teacher
speaks very fast.
8. I can understand the English in non-subtitled
English video tutorials/lessons on topics that are
connected to my major.

Papers in Language Testing and Assessment Vol. 4, issue 1, 2015 95
9. I can easily understand my American
classmates in group discussions or pair work in
my major course(s).
10. I can predict the upcoming content or topic in
a class based on what my teacher has talked about
so far.
11. I can successfully talk on the phone in English
to ask and answer questions about campus life
and events.
12. I can start and maintain a discussion orally
with my classmates in an in-class activity.
13. I can use English to provide a spoken
summary of long and difficult course materials for
my classmates and teacher.
14. I can express complex ideas to my classmates
and my teacher providing strong supporting
evidence as needed.
15. I can make a clearly developed presentation on
a topic in my major using fluent and accurate
English.
16. I can write a report or do a course assignment
using correct grammar and academic style.
17. I can communicate disagreement
appropriately with my teacher in email in a
formal and polite way.
18. I can revise and edit my own writing
(including class assignments and/or papers for
publication) to make it better and more acceptable

Z. Li
96
to my teacher or advisor.
19. I can use different language styles and
vocabulary in writing appropriate for different
readers (for example, friends, classmates, teachers,
etc.).
20. I can use and include external sources (for
example, articles and reports) appropriately in my
own writing through summarizing, quoting, and
paraphrasing them.
21. I can write an essay with a clear paragraph
structure by using topic sentences and supporting
details.
