
IBM Cognos Workspace Advanced
Version 10.2.2
User Guide

Note
Before using this information and the product it supports, read the information in “Notices” on page 245.
Product Information
This document applies to IBM Cognos Business Intelligence Version 10.2.2 and may also apply to subsequent
releases.
Licensed Materials - Property of IBM
© Copyright IBM Corporation 2005, 2014.
US Government Users Restricted Rights – Use, duplication or disclosure restricted by GSA ADP Schedule Contract
with IBM Corp.

Contents
Introduction .................................xiii
Chapter 1. What's new in Cognos Workspace Advanced ...............1
New features in Cognos Workspace Advanced version 10.2.2 ...................1
Dynamically named worksheet tabs in Excel 2007 output ...................1
Custom user interfaces and UI profiles .........................1
Report run format restrictions ............................2
Support for IBM Cognos Theme Designer ........................2
Enhancements to extensible visualizations ........................2
New features in Cognos Workspace Advanced version 10.2.1.1 ..................3
Extensible visualizations ..............................3
New features in Cognos Workspace Advanced version 10.2.1 ...................3
Simplified custom grouping .............................3
Share sets between reports..............................3
Crosstab values as percentages ............................4
Improved text-based relational filters ..........................4
Option to group or ungroup repeating cells in Excel 2007 reports.................4
Search parameter Ends with any of these keywords .....................4
Removed features in Cognos Workspace Advanced version 10.2.1 .................4
IBM Cognos Statistics ...............................5
New features in Cognos Workspace Advanced version 10.2.0 ...................5
Cognos Business Insight and Cognos Business Insight Advanced are renamed ............5
Improved support for bidirectional content ........................5
Copying results to a Microsoft Excel spreadsheet with more fidelity ................6
Pasting a list of values from a spreadsheet into custom filters ..................6
Enhanced crosstab headers .............................6
Inherited table styles in lists and crosstabs ........................6
Additional keyboard shortcuts for accessibility .......................6
New features in Cognos Business Insight version 10.1.1 .....................7
Custom groups .................................7
Creating sections .................................7
Filtering directly from the data tree ...........................7
Names for lists, crosstab, and chart objects ........................7
New startup options................................8
Visual aid to select lists and crosstabs ..........................8
Keyboard shortcuts for accessibility...........................8
Showing content when no data is available ........................8
Larger worksheet sizes for Microsoft Excel 2007 report outputs .................8
Microsoft Excel 2007 supported as an external data source ...................9
New features in Cognos Business Insight Advanced version 10.1.0 .................9
Business Insight Advanced .............................9
Use Your Own External Data ............................11
Charts ....................................12
Mozilla Firefox Support ..............................12
Working with Relational Data Sources .........................12
Working with Dimensional Data Sources ........................13
Report Name Used for the Exported Output File Name ...................14
Accessibility Features ...............................14
Summarizing Data ................................14
Filtering to Limit Data ...............................15
Preview Reports when Opening and Saving .......................15
Lay Out Report Pages ...............................15
Braces and Parentheses are Breakable..........................15
Changed features in Cognos Business Insight Advanced version 10.1.0 ...............16
Line break rules in PDFs have changed .........................16
© Copyright IBM Corp. 2005, 2014 iii
Removed features in Cognos Business Insight Advanced version 10.1.0 ...............16
Analyze with Analysis Studio ............................16
Excel 2000 and Excel 2000 Single Sheet Report Outputs....................16
Chapter 2. Understanding Cognos Workspace Advanced ..............17
Relational and dimensional reporting styles ........................17
Working in Cognos Workspace Advanced .........................20
The user interface ................................20
Work in Preview or Design Mode ...........................22
Basic Report Layout ...............................23
Options ....................................24
Web browser settings ................................27
Chapter 3. Creating Reports ..........................29
Specify the Package ................................29
Refresh the package ...............................30
Choosing a basic report layout .............................30
Inserting a data container from the toolbox tab ......................30
Add Data to a Report ................................31
Data source icons ................................32
Save a Report...................................33
Running a report .................................33
Running a Report Against a Dimensional Data Source ....................35
Producing a Report in CSV Format ..........................35
Producing a Report in Microsoft Excel Format .......................35
Producing a Report in XML Format ..........................39
Set PDF Page Options ...............................39
Naming report objects for workspaces in Cognos Workspace ...................40
Recommendation - Creating Financial Reports ........................40
The IBM Cognos Business Intelligence Software Development Kit .................40
View Lineage Information for a Data Item .........................41
The IBM Cognos Business Intelligence lineage tool .....................42
Chapter 4. Crosstabs .............................43
Working with Crosstab Reports.............................43
Create a Nested Crosstab ..............................44
Create a Single-Edge Crosstab ............................45
Creating headers automatically for sets in crosstabs ......................46
Showing crosstab values as percentages ..........................46
Swap Columns and Rows ..............................47
Change a List into a Crosstab .............................48
Chapter 5. Charts ...............................49
Using Legacy Report Studio Charts ...........................49
Creating Charts ..................................49
Chart objects ..................................50
Chart types and chart configurations ...........................52
Chart Types ...................................52
Column Charts .................................53
Line Charts ..................................53
Pie Charts ...................................54
Bar Charts ...................................55
Area Charts ..................................56
Point Charts ..................................56
Combination Charts ...............................57
Scatter Charts .................................58
Bubble Charts .................................58
Bullet Charts ..................................59
Gauge Charts..................................60
Pareto Charts ..................................60
iv IBM Cognos Workspace Advanced Version 10.2.2: User Guide
Progressive Column Charts .............................61
Quadrant Charts.................................62
Marimekko Charts ................................63
Radar Charts ..................................64
Polar Charts ..................................64
Chart Configurations ................................65
Standard Charts .................................65
Stacked Charts .................................65
100 Percent Stacked Charts .............................66
Three-dimensional Charts .............................67
Convert Charts From One Type to Another .........................68
Customizing charts .................................68
Resizing a chart .................................71
Add Titles to a Chart ...............................71
Customizing the Color Palette of a Chart ........................71
Customizing the Color Palette of a Progressive Chart ....................73
Highlighting data in a chart by creating a conditional palette ..................74
Add Background Effects to a Chart Object ........................75
Add Colored Regions to a Chart ...........................76
Customizing the Axes in a Chart ...........................77
Customize the Legend of a Chart ...........................79
Adding a Note to a Chart .............................80
Adding a Baseline to a Chart ............................81
Display Trendlines in Current Default Charts .......................82
Showing data values in bar, column, line, and area charts ...................83
Showing data values in pie and donut charts .......................84
Showing data values in other charts ..........................84
Customizing Lines and Data Points in a Line Chart .....................85
Create a Matrix of Charts..............................85
Customize a Gauge Chart .............................88
Defining color by value in scatter or bubble charts .....................89
Create a Donut Chart from a Pie Chart .........................90
Pull Out Pie Slices in a Pie Chart ...........................90
Customize a Bullet Chart ..............................91
Chapter 6. Extensible visualizations .......................93
Adding a visualization to a report ............................93
Adding a treemap visualization ...........................94
Adding a heatmap visualization ...........................96
Adding a packed bubble visualization .........................97
Adding a network diagram .............................99
Visualization properties ...............................100
Resizing a visualization ...............................100
Specifying the range values that are displayed .......................100
Updating visualizations ...............................101
Converting visualizations from one type to another .....................101
Chapter 7. Lists ...............................103
Group Data ...................................103
Chapter 8. Exploring Relational Data ......................105
Using Relational Calculations .............................105
Create a Simple Calculation ............................106
Inserting a Query Calculation ............................108
Summarize Relational Data ..............................110
Sorting relational data ...............................111
Sorting multiple rows or columns and grouped columns ...................111
Sorting lists based on a data item not in the report .....................112
Format Relational Data ...............................112
Specifying the Number of Decimals in Numbers......................113
Contents v
Locale-sensitive Properties .............................113
Digit shaping in charts ..............................114
Filtering relational data ...............................115
Creating a custom filter ..............................116
Creating relational custom groups ..........................117
Combining filter conditions.............................118
Filtering based on data items not in the report ......................119
Editing filters .................................120
Removing filters ................................120
Suppress Empty Cells in Relational Reporting .......................120
Limitations When Formatting Empty Cells in SAP BW Data Sources ...............121
Example - Suppress Zeros in Rows and Columns in an Existing Report ..............121
Chapter 9. Exploring Dimensional Data .....................123
Customize the Source Tree ..............................124
Insert a Member .................................125
Search for a Member ................................125
Nest Members ..................................126
Insert a Hierarchy .................................127
Insert a Member Property ..............................127
Create a Set of Members...............................128
Excluding members from a set ............................128
Moving members within a set .............................128
Replace a Member or Set ..............................129
Create Members and Intersections ...........................129
Expand and Collapse a Member ............................130
Sharing sets between reports .............................130
Managing shared set references ...........................131
Join Multiple Sets .................................132
Edit the Operations Performed on a Set .........................132
Create Page Layers ................................133
Sort Dimensional Data ...............................134
Sorting members in a set by their labels ........................134
Sorting sets by value ...............................134
Sorting sets by member properties or tuples .......................135
Format Dimensional Data ..............................136
Specifying the Number of Decimals in Numbers .....................137
Locale-sensitive Properties .............................137
Digit shaping in charts ..............................138
Suppress Empty Cells in Dimensional Reporting ......................139
Limitations When Formatting Empty Cells in SAP BW Data Sources ...............140
Example - Suppress Zeros in Rows and Columns in an Existing Report ..............140
Summarize Dimensional Data .............................140
Creating dimensional custom groups ..........................141
Using Dimensional Calculations ............................143
Create a Simple Member Calculation .........................144
Limitations When Summarizing Measures in DMR Data Sources ................146
Creating a Query Calculation ............................147
Create an Intersection (Tuple) ............................149
Drill on a Member or Set ..............................149
Filtering dimensional data ..............................150
Creating a context filter ..............................151
Limiting data to top or bottom values .........................152
Filtering the members within a set ..........................153
Creating a custom filter ..............................154
Combining filter conditions.............................155
Editing filters .................................156
Removing filters ................................156
Extended Data Items ................................156
Create a Drill-up and Drill-down Report .........................157
vi IBM Cognos Workspace Advanced Version 10.2.2: User Guide
Chapter 10. Formatting Reports ........................159
Add a Header or Footer to a Report...........................159
Add Borders to an Object ..............................159
AddText....................................159
Specify the Font for a Report .............................160
Add Color to an Object ...............................160
Copy Object Formatting ...............................161
Insert an Image in a Report .............................161
Add Background Effects...............................161
Insert Page Numbers in a Report ............................162
Insert Other Objects ................................163
Align an Object..................................165
Lay Out Report Pages ...............................165
Using a table to control where objects appear .......................165
Applying table styles ...............................166
Dividing data into sections ..............................167
Apply Padding to an Object .............................168
Set Object Margins ................................168
Rename a Row or Column ..............................168
Support for bidirectional content ............................169
Specifying text and container direction ..........................171
Specify Line Spacing and Breaking ...........................173
Specify the Height and Width of an Object ........................173
Control How Other Objects Flow Around an Object .....................174
Highlight Data Using a Conditional Style .........................175
Create a New Conditional Style ...........................175
Reuse an Existing Conditional Style ..........................176
Create an Advanced Conditional Style .........................177
Example - Add a Conditional Style to an Existing Report...................177
Specify what appears for data containers that contain no data ..................178
Modifying Report and Object Styles ...........................179
Modify the report properties ............................179
Modify Object Styles ...............................180
(Don't Print) Class................................180
Modifying the Default Layout Style Sheet ........................181
Chapter 11. Managing Existing Reports .....................183
Copying the result of an analysis to a Microsoft Excel spreadsheet ................183
Copy a Report to the Clipboard ............................183
Copy a Report to the Clipboard in Internet Explorer ....................183
Copy a Report to the Clipboard in Firefox........................184
Open a Report from the Clipboard ...........................184
Managing Changes in the Package ...........................184
Chapter 12. Working with your external data ...................185
My Data Sets ..................................185
Manage external data................................186
Preparing to Work with your External Data .......................187
Import Data ..................................189
Map Data ..................................190
Finish Importing Data ..............................191
Publish the Package ...............................192
Edit Your External Data ..............................192
Delete Your External Data .............................193
Running a Report That Contains External Data ......................194
Making your Reports Public ............................194
Chapter 13. Upgrading Reports.........................195
Upgrading Reports from IBM Cognos Business Intelligence Version 8.4 ...............195
Tips for Report Studio Express Authoring Users......................195
Contents vii
Upgrading Report Styles .............................197
Chapter 14. Samples .............................199
The Sample Outdoors Company ............................199
Samples in the GO Data Warehouse (analysis) Package ....................199
Promotion Success................................200
Retailer sales target ...............................200
Samples in the GO Data Warehouse (query) Package .....................200
Employee Expenses by Region ...........................200
Returns by Product Brand .............................200
Appendix A. Accessibility Features .......................201
Accessibility features in IBM Cognos Workspace Advanced ...................201
Keyboard Shortcuts ................................201
Considerations to Improve Report Accessibility .......................202
Enable Accessible Report Outputs ..........................202
Add Alternate Text to Images and Charts ........................203
Add Summary Text to Tables ............................204
Designate Cells Headers in Tables ..........................204
IBM and Accessibility ...............................204
Appendix B. Troubleshooting .........................205
Auto Correct Errors in a Report ............................205
Problems Creating Reports ..............................205
Metadata Change in Oracle Essbase Not Reflected in Reports and in the Studios ...........205
Relationships Not Maintained in a Report With Overlapping Set Levels ..............205
Unexpected Summary Values in Nested Sets .......................206
Limited Support for Relational Functions When Used with OLAP Data Sources ...........207
Columns, Rows, or Data Disappear With SSAS 2005 Cubes ..................207
Report Differences Between TM1 Executive Viewer and IBM Cognos Business Intelligence with TM1 Data
Sources ...................................208
Order of Metadata Tree Differs for TM1 Data Sources ....................208
Problems Calculating Data ..............................209
Incorrect Results with IBM Cognos PowerCubes and Time Measures ...............209
Problems importing external data ...........................209
MSR-PD-0012 error when importing external data .....................209
MSR-PD-0013 error when importing external data .....................209
Problems Running Reports ..............................210
Measure Format Disappears in SSAS 2005 ........................210
Cognos Statistics object is not displayed in a report ....................210
Appendix C. Limitations When Producing Reports in Microsoft Excel Format .....211
Unable to Load Images from the IBM Cognos Business Intelligence Content Store in a Report .......211
Blank Worksheet Appears ..............................211
Warning Message Appears When Excel Opens an IBM Cognos Business Intelligence Report ........211
Spreadsheet Content Not Saved for Reports Saved in XLS Format .................211
Unable to Load Excel Report in Netscape 7.01 .......................212
Unsupported IBM Cognos BI Formatting .........................212
Cells Contain Series of #...............................212
Excel Cannot Render Reports with More Than 256 Columns ..................213
Table and Column Widths ..............................213
Secure Socket Layer (SSL) Is Not Supported in Some Excel Formats and Versions ...........213
Number Formats Become Currency Formats in Japanese Excel ..................213
Reports Show Data in Wrong Columns ..........................213
Unable to Access Reports on Remote Servers ........................214
Unsupported Excel Formatting ............................214
Hyperlink Buttons Are Not Supported in Excel .......................214
Unable to View Reports in Excel Format Sent as Email Attachments ................214
Cell Height and Width Are Incorrect ..........................214
viii IBM Cognos Workspace Advanced Version 10.2.2: User Guide
Appendix D. Using the expression editor ....................215
Operators ...................................215
(......................................215
)......................................215
*......................................215
,......................................215
/.....................................215
+.....................................215
-......................................216
when ....................................216
Constants ...................................216
date ....................................216
date-time ...................................216
interval ...................................216
number ...................................216
string ....................................216
time ....................................216
time with time zone ...............................216
timestamp with time zone .............................216
List Summaries ..................................217
aggregate...................................217
average ...................................217
count ....................................217
maximum ..................................217
median ...................................218
minimum...................................218
standard-deviation ...............................218
total ....................................218
variance ...................................219
Crosstab/Chart Summaries ..............................219
aggregate...................................219
average ...................................219
count ....................................219
maximum ..................................220
median ...................................220
minimum...................................220
standard-deviation ...............................220
total ....................................221
variance ...................................221
Functions....................................221
abs.....................................221
ancestor ...................................221
bottomCount .................................222
bottomPercent .................................222
bottomSum ..................................223
caption ...................................223
cast.....................................223
ceiling ....................................224
children ...................................224
closingPeriod .................................225
completeTuple .................................225
cousin ....................................226
current_date..................................226
currentMember.................................227
current_timestamp................................227
defaultMember .................................227
descendants ..................................227
except ....................................229
extract....................................229
filter ....................................229
firstChild ...................................230
Contents ix
firstSibling ..................................230
floor ....................................230
head ....................................231
hierarchize ..................................231
hierarchy ...................................231
item ....................................232
intersect ...................................232
lag.....................................232
lastChild ...................................233
lastPeriods ..................................233
lastSibling ..................................233
lead ....................................234
lower ....................................234
member ...................................234
members ...................................235
mod....................................235
nextMember..................................235
nullif ....................................235
openingPeriod .................................236
order....................................236
parallelPeriod .................................237
parent....................................238
periodsToDate .................................238
power ....................................238
prevMember .................................238
rootMember ..................................239
rootMembers .................................239
_round ...................................239
set.....................................239
siblings ...................................239
sqrt.....................................240
subset ....................................240
substring ...................................241
tail .....................................241
topCount ...................................241
topPercent ..................................242
topSum ...................................242
trim ....................................242
tuple ....................................243
union ....................................243
unique ...................................243
upper ....................................243
value ....................................244
Notices ...................................245
Glossary ..................................249
A......................................249
B......................................249
C......................................250
D......................................251
E......................................252
F......................................252
G......................................252
H......................................252
I.......................................252
J.......................................252
L......................................253
M......................................253
N......................................254
x IBM Cognos Workspace Advanced Version 10.2.2: User Guide
O......................................254
P......................................254
Q......................................255
R......................................255
S ......................................255
T......................................256
U......................................256
V......................................257
W......................................257
Index ....................................259
Contents xi
xii IBM Cognos Workspace Advanced Version 10.2.2: User Guide

Introduction
This document is intended for use with IBM
®
Cognos
®
Workspace Advanced.
Cognos Workspace Advanced is a web-based tool that is used to author reports
and analyze data. The user interface is designed for business users to get insight
into their business.
Finding information
To find product documentation on the web, including all translated
documentation, access IBM Knowledge Center (http://www.ibm.com/support/
knowledgecenter).
Accessibility features
Accessibility features help users who have a physical disability, such as restricted
mobility or limited vision, to use information technology products. Cognos
Workspace Advanced has accessibility features. For more information, see
Appendix A, “Accessibility Features,” on page 201.
IBM Cognos HTML documentation has accessibility features. PDF documents are
supplemental and, as such, include no added accessibility features.
Forward-looking statements
This documentation describes the current functionality of the product. References
to items that are not currently available may be included. No implication of any
future availability should be inferred. Any such references are not a commitment,
promise, or legal obligation to deliver any material, code, or functionality. The
development, release, and timing of features or functionality remain at the sole
discretion of IBM.
Samples disclaimer
The Sample Outdoors Company, Great Outdoors Company, GO Sales, any
variation of the Sample Outdoors or Great Outdoors names, and Planning Sample
depict fictitious business operations with sample data used to develop sample
applications for IBM and IBM customers. These fictitious records include sample
data for sales transactions, product distribution, finance, and human resources.
Any resemblance to actual names, addresses, contact numbers, or transaction
values is coincidental. Other sample files may contain fictional data manually or
machine generated, factual data compiled from academic or public sources, or data
used with permission of the copyright holder, for use as sample data to develop
sample applications. Product names referenced may be the trademarks of their
respective owners. Unauthorized duplication is prohibited.
© Copyright IBM Corp. 2005, 2014 xiii
xiv IBM Cognos Workspace Advanced Version 10.2.2: User Guide

Chapter 1. What's new in Cognos Workspace Advanced
This section contains a list of new, changed, deprecated, and removed features for
this release.
It will help you plan your upgrade and application deployment strategies and the
training requirements for your users.
For information about upgrading, see the IBM Cognos Business Intelligence
Installation and Configuration Guide for your product.
To review an up-to-date list of the environments that are supported by IBM
Cognos products, including information about operating systems, patches,
browsers, web servers, directory servers, database servers, and application servers,
see Supported Software Environments (http://www.ibm.com/support/
docview.wss?uid=swg27042164).
For an overview of new features for this release, see the IBM Cognos Business
Intelligence New Features Guide.
New features in Cognos Workspace Advanced version 10.2.2
This release contains new features.
Dynamically named worksheet tabs in Excel 2007 output
When you produce reports in Excel 2007 format, you can configure IBM Cognos
Business Intelligence to dynamically name the Excel worksheet tabs, based on the
data items that are used to break pages.
For example, you specify page breaks by Product line. In Excel 2007 output, the
five worksheet tabs that are generated are named Camping Equipment,
Mountaineering Equipment, Personal Accessories, Outdoor Protection, and Golf
Equipment.
Related tasks:
“Create Page Layers” on page 133
When working with dimensional data, you can create page layers in a report to
show values for each member on a separate page. For example, your report
contains payroll information for the entire company. You want to view values for
each department on a separate page.
Custom user interfaces and UI profiles
IBM Cognos Business Intelligence administrators can now create custom user
interface profiles for use in IBM Cognos Workspace Advanced. Custom user
interface profiles are used to control the features and functionality of the user
interface.
Users with different profiles see different interfaces and experience different default
behavior in Cognos Workspace Advanced. For more information, see the IBM
Cognos Business Intelligence Administration and Security Guide.
Related concepts:
© Copyright IBM Corp. 2005, 2014 1
“The user interface” on page 20
IBM Cognos Workspace Advanced has a work area, content and properties panes,
a page layers area, and a context filter area to help you to create reports.
Report run format restrictions
To manage system resources, IBM Cognos Business Intelligence administrators can
now restrict the ability of users to run reports in the CSV, PDF, Microsoft Excel,
and XML report output formats.
If your Cognos BI administrator implements these restrictions, you might not be
able to run reports in all output formats.
Related tasks:
“Running a report” on page 33
Run your report to see how the report will appear to report consumers.
Support for IBM Cognos Theme Designer
IBM Cognos Theme Designer provides a graphical user interface that makes it easy
to tailor IBM Cognos BI applications to your brand requirements. You can replace
images, change colors, or edit html to get the look you want. You can produce
multiple themes for users to choose from or different themes for each tenant or
application in multiple tenant environments.
In addition to existing support for Cognos Theme Designer by IBM Cognos
Connection, IBM Cognos Viewer, and IBM Cognos Workspace, this version adds
support by IBM Cognos Report Studio and IBM Cognos Workspace Advanced.
To download Cognos Theme Designer and its documentation, go to IBM Cognos
Theme Designer Tool (www.ibm.com/support/docview.wss?rs=0
&uid=swg24035533).
Enhancements to extensible visualizations
Enhancements were made to extensible visualizations that simplify the authoring
experience.
The following list describes the enhancements that were made to extensible
visualizations.
v Optional category fields
When you add an extensible visualization to a report, it is no longer necessary
to insert data items in all category drop zones. For example, you can create a
visualization that has only a measure and categories, and no data series.
In previous IBM Cognos BI releases, you cannot run a visualization until all
required data drop zones contain data items.
v Conversion of visualizations from one type to another
You can convert an existing visualization to another visualization type. With this
enhancement, you do not have to re-author the data items in the original
visualization.
v Support for more properties
Visualizations support more properties, giving report authors greater control
over the appearance and behavior of visualizations in reports.
Related concepts:
Chapter 6, “Extensible visualizations,” on page 93
You can use extensible visualizations in IBM Cognos reports to visualize data.
2 IBM Cognos Workspace Advanced Version 10.2.2: User Guide

New features in Cognos Workspace Advanced version 10.2.1.1
This release contains new features.
Extensible visualizations
You can use new and innovative visualizations in Report Studio and IBM Cognos
Workspace Advanced. You can also consume the new visualizations in IBM Cognos
Workspace. This feature makes use of Rapidly Adaptive Visualization Engine
(RAVE) to introduce new visualizations such as treemaps, heatmaps, and network
diagrams.
New visualization types might become available over time on IBM AnalyticsZone
(http://www.analyticszone.com). You can download and use new visualization
types in your environment. You can also engage IBM to produce custom
visualizations that are specific to your business needs.
Related concepts:
Chapter 6, “Extensible visualizations,” on page 93
You can use extensible visualizations in IBM Cognos reports to visualize data.
New features in Cognos Workspace Advanced version 10.2.1
This release contains new features.
Simplified custom grouping
You can now create, edit, combine, and remove custom groups directly by
right-clicking.
In previous releases of IBM Cognos Workspace Advanced, you were required to
create custom groups in the Custom Grouping window. You can now also create,
edit, combine, and remove custom groups directly with the right-click menu.
Related tasks:
“Creating dimensional custom groups” on page 141
Create custom groups to classify existing data items into groups that are
meaningful to you.
Share sets between reports
When you work with dimensional data, you can now share a set. Shared sets
appear in the model tree for inclusion in other reports.
When you include a shared set, you can designate it to be either Run Time or
Design Time. If a set is designated as Run Time, the report always uses whatever
is in the shared set as it is defined. If a set is designated as Design Time, the
report caches the contents of the shared set at the time when it is initially included.
The report uses this definition until you explicitly refresh it.
Related tasks:
“Sharing sets between reports” on page 130
When you are working with dimensional data, you can share a set to make it
available for inclusion in multiple reports.
“Managing shared set references” on page 131
After you share a set to make it available for inclusion in multiple reports, you can
manage references to it. You can also copy it locally.
Chapter 1. What's new in Cognos Workspace Advanced 3

Crosstab values as percentages
In crosstabs, you can now show values as a percentage of a summary instead of
the actual values. For example, you can show the revenue that was generated by
each product line as a percentage of the total revenue.
Related tasks:
“Showing crosstab values as percentages” on page 46
When you work with dimensional data sources, you can show crosstab values as a
percentage of a summary instead of the actual values. When you show values as a
percentage, you can compare the contribution of an item to the whole.
Improved text-based relational filters
You can now define relational filters that are based on a text pattern.
In previous releases, text-based relational filters were defined by selecting actual
values, such as Camping Equipment. Performance is impacted when the number of
strings in a filter condition increases. This feature automatically generates filters
that contain strings or members that match a text pattern. The following text
matching options are available:
v Starts with
v Ends with
v Contains
v Matches SQL pattern
Related tasks:
“Creating a custom filter” on page 154
Create custom filters when the values you want to use in your filter conditions do
not occur in your report.
Option to group or ungroup repeating cells in Excel 2007
reports
When you produce reports in Excel 2007 format, you can choose to group
repeating cells into a single merged cell.
Grouped or ungrouped cells are produced by various report objects, such as
grouped data items, headers and footers, and nested objects. The option to group
or ungroup repeating cells is controlled by the Group repeating cells when
exporting to Excel report property.
Related concepts:
“Option to group repeating cells in reports produced in Excel 2007 format” on
page 36
When you produce reports in Excel 2007 format, you can specify whether
repeating cells are grouped, or merged, into a single cell.
Search parameter Ends with any of these keywords
A search parameter, Ends with any of these keywords, is now available when you
perform searches, such as when you search for members when you create a filter
expression.
Removed features in Cognos Workspace Advanced version 10.2.1
In this release, some features have been removed.
4 IBM Cognos Workspace Advanced Version 10.2.2: User Guide

IBM Cognos Statistics
IBM Cognos Statistics was removed from this version of IBM Cognos Business
Intelligence.
To ensure that reports that were created in previous releases, and that contain
statistical objects, will run in this and future releases, statistical objects are removed
when the reports are upgraded. Each removed statistical object is replaced with the
following image:
Tip: Queries and their data items that are associated to statistical objects are not
removed from upgraded reports.
You can use IBM SPSS
®
Statistics to perform statistical reporting and analysis.
New features in Cognos Workspace Advanced version 10.2.0
This release contains new features.
Cognos Business Insight and Cognos Business Insight
Advanced are renamed
Two product components are renamed in this release to avoid confusion with the
names of other components. IBM Cognos Business Insight is now IBM Cognos
Workspace. IBM Cognos Business Insight Advanced is now IBM Cognos
Workspace Advanced.
Improved support for bidirectional content
IBM Cognos Workspace Advanced offers improved support for bidirectional
content when authoring reports.
The improved support for bidirectional content includes
v Base text direction for text in more report objects, such as charts and prompts
v Control of object direction for charts and prompts
v Digit shaping
In addition, the improved support for bidirectional content includes the PDF and
Microsoft Excel report formats.
Related concepts:
“Support for bidirectional content” on page 169
You can author reports that support bidirectional content. You can specify base text
direction, digit shaping, and container direction.
Figure 1. Image that replaces statistical objects in upgraded reports
Chapter 1. What's new in Cognos Workspace Advanced 5
Copying results to a Microsoft Excel spreadsheet with more
fidelity
You can now copy data from a list or crosstab and paste it into a Microsoft Excel
2007 spreadsheet, while maintaining number formatting. This ability is a
convenient way to quickly export your analysis.
Related tasks:
“Copying the result of an analysis to a Microsoft Excel spreadsheet” on page 183
You can copy the result of an analysis in IBM Cognos Workspace Advanced to a
Microsoft Excel spreadsheet. The data retains its table structure and simple
text-based formatting.
Pasting a list of values from a spreadsheet into custom filters
You can now paste a list of values copied from a spreadsheet such as Microsoft
Excel into custom filters.
Related tasks:
“Creating a custom filter” on page 154
Create custom filters when the values you want to use in your filter conditions do
not occur in your report.
Enhanced crosstab headers
In crosstabs, you can display headers that indicate the parent categories of the data
items in the columns and rows. The headers help users to understand where the
data is located in the hierarchy.
Related tasks:
“Creating headers automatically for sets in crosstabs” on page 46
You can automatically add header labels on columns and rows when working with
sets in a crosstab that uses a dimensional data source. The headers help consumers
of the report to understand where the data is in the hierarchy.
Inherited table styles in lists and crosstabs
When an item is inserted in a list or crosstab, the item inherits the table style of
one of the items in the data container.
By default, items inherit the style of an item of the same type. For example, if you
insert a measure in a list, the measure inherits the style of a measure that is in the
list, if one exists. Inheritance rules control which style is inherited.
Related tasks:
“Applying table styles” on page 166
Apply a table style to quickly format tables. You can also apply a table style to lists
and crosstabs.
Additional keyboard shortcuts for accessibility
The report authoring experience is more accessible to people who have a physical
disability, such as restricted mobility or limited vision. IBM Cognos Workspace
Advanced now includes additional keyboard shortcuts to make it easier to
navigate the user interface with a keyboard.
Related concepts:
“Keyboard Shortcuts” on page 201
This product uses some standard Microsoft Windows and accessibility shortcut
keys.
6 IBM Cognos Workspace Advanced Version 10.2.2: User Guide

New features in Cognos Business Insight version 10.1.1
This release contains new features.
Custom groups
You can create custom groups of existing data items based on elements that you
define and that are meaningful to you.
For example, you can create custom groups for product names based on their
alphabetical order. You might create groups for products that start with the letters
AtoC,DtoF,GtoH,andsoon.
Related tasks:
“Creating relational custom groups” on page 117
Create custom groups to classify existing data items into groups that are
meaningful to you.
“Creating dimensional custom groups” on page 141
Create custom groups to classify existing data items into groups that are
meaningful to you.
Creating sections
You can now create sections to show a separate list, chart, or crosstab for a data
item.
To create sections, use the section/unsection icon
on the toolbar.
Related tasks:
“Dividing data into sections” on page 167
Create sections in a report to show a separate list, chart, visualization, or crosstab
for a data item.
Filtering directly from the data tree
When using IBM Cognos Business Insight Advanced with relational data sources ,
you can now filter using measures
and query items in the source tree.
This allows you to create a filter based on a data item that is not included in your
report.
Related tasks:
“Filtering based on data items not in the report” on page 119
You can create a filter using a data item in the source tree that is not included in
your report.
Names for lists, crosstab, and chart objects
A new Name property for lists, crosstabs, and charts allows you to give these
report objects a meaningful business name. These names allow business users to
easily recognize the lists, crosstabs, or charts when they add them into an IBM
Cognos Business Insight workspace.
Related tasks:
“Naming report objects for workspaces in Cognos Workspace” on page 40
Provide a name for list, crosstab, and chart report objects so that they can easily be
identified when added in a workspace in IBM Cognos Workspace.
Chapter 1. What's new in Cognos Workspace Advanced 7
New startup options
A new Start page view option allows you to specify whether Business Insight
Advanced opens in Page Design or Page Preview view (Tools > Options > View).
By default, Business Insight Advanced opens in Page Preview view.
Related concepts:
“Options” on page 24
You can set various options that control the appearance and behaviors of IBM
Cognos Workspace Advanced (Tools, Options).
Visual aid to select lists and crosstabs
A new visual aid allows you to select all the objects in a list or crosstab.
When you enable the Show Container Selectors visual aid, a selector (three orange
dots) appears in the top-left corner of lists and crosstabs. You can use this selector
to easily access and set properties for all objects in the list or crosstab with one
mouse gesture.
Related tasks:
“Using visual aids to design your report layout” on page 23
Visual aids in the work area help you when you are designing your report layout.
Keyboard shortcuts for accessibility
To make the report authoring experience more accessible to people who have a
physical disability, such as restricted mobility or limited vision, Business Insight
Advanced now includes new keyboard shortcuts to allow navigating the user
interface with a keyboard.
Related concepts:
“Keyboard Shortcuts” on page 201
This product uses some standard Microsoft Windows and accessibility shortcut
keys.
Showing content when no data is available
In IBM Cognos Business Insight Advanced, you can now specify what to show in a
data container when no data is available in the database.
You can show an empty data container, such as a list, crosstab, or chart; alternate
content; or text. By default, the text No Data Available appears.
Related tasks:
“Specify what appears for data containers that contain no data” on page 178
You can specify what appears in a data container when no data is available from
the database.
Larger worksheet sizes for Microsoft Excel 2007 report
outputs
IBM Cognos Business Intelligence now supports a larger worksheet size for report
outputs exported in Microsoft Excel 2007 format.
In previous versions of IBM Cognos Business Intelligence, report output in
Microsoft Excel format was limited to a maximum of 256 columns by 65,000 rows.
Although this remains as the default worksheet size, administrators can now
enable larger worksheets and change the maximum number of rows in a
8 IBM Cognos Workspace Advanced Version 10.2.2: User Guide

worksheet - up to a maximum of 16,384 columns by 1,048,576 rows - by using
advanced server properties. This number matches the Microsoft Excel 2007
worksheet size limitations.
For more information, see the IBM Cognos Business Intelligence Administration and
Security Guide.
For an up-to-date list of environments supported by IBM Cognos products, such as
operating systems, patches, browsers, Web servers, directory servers, database
servers, and application servers, visit http://www.ibm.com/.
Related concepts:
“Producing a Report in Microsoft Excel Format” on page 35
You can export your report output to several different Microsoft Excel spreadsheet
software formats.
Microsoft Excel 2007 supported as an external data source
IBM Cognos Business Intelligence now supports external data sources from
Microsoft Excel up to version Microsoft Excel 2007.
For an up-to-date list of environments supported by IBM Cognos products, such as
operating systems, patches, browsers, Web servers, directory servers, database
servers, and application servers, visit http://www.ibm.com/.
Related concepts:
“Use Your Own External Data” on page 11
You can now supplement your enterprise data with your own external data file.
New features in Cognos Business Insight Advanced version 10.1.0
This release contains new features.
Business Insight Advanced
IBM Cognos Business Insight Advanced is part of a new report consumption
experience that provides an integrated business intelligence experience for business
users.
You use IBM Cognos Business Insight to create sophisticated interactive
workspaces and explore your content in a predefined way. In a Business Insight
workspace, you work with existing content and perform basic analysis, data
exploration, and collaborative decision making. When you want to perform deeper
analysis and report authoring, you graduate to Business Insight Advanced, where
you can perform more advanced data exploration, such as adding additional
measures, conditional formatting, and advanced calculations.
Business Insight Advanced is both an extension of and a replacement for the IBM
Cognos Report Studio Express authoring mode, which met the needs of financial
analysts to create statement-style reports. Business Insight Advanced offers much
greater capability, such as full support for list reports, charts, and relational data
sources, and offers an entirely different user experience.
The Business Insight Advanced user interface concentrates on exploring data. As a
result, the default behavior of some actions has changed. For example,
double-clicking an item now drills down, and when inserting members, you now
insert sets by default.
Chapter 1. What's new in Cognos Workspace Advanced 9

You can open Business Insight Advanced two different ways:
v from a Business Insight workspace to perform advanced editing of a report (Do
More)
v from either the Launch menu in IBM Cognos Connection or from the Welcome
page (Author Business Reports)
If you prefer to use the defaults from version 8.4, you can configure Business
Insight Advanced to behave like the Report Studio Express authoring mode (Tools,
Options).
Related concepts:
“Tips for Report Studio Express Authoring Users” on page 195
IBM Cognos Workspace Advanced is both an extension of and a replacement for
IBM Cognos Report Studio Express authoring mode, which allowed financial
analysts to create statement-style reports. The Report Studio Express authoring
mode allowed you to create only crosstabs with dimensional data sources, with no
relational or charting support.
Enhancements to the User Interface
Business Insight Advanced features an enhanced user interface, including a new
modern skin.
Full and Dimensional-only Views of Data Tree:
When working with dimensional and mixed model data sources, you can switch
between viewing the full data tree and the dimensional-only data tree by clicking
the view package tree button
and the view members tree button .
These same buttons are available when you build a calculation.
Related concepts:
Chapter 9, “Exploring Dimensional Data,” on page 123
Dimensional data sources include OLAP and dimensionally-modeled relational
(DMR) data sources. The Source tab
in the content pane shows a
member-oriented view of the data.
Properties Pane:
A new Properties pane lists the formatting properties that you can set for an object
in a report.
Related concepts:
Chapter 10, “Formatting Reports,” on page 159
Format your report to make it more readable and to reflect company standards.
When you format a report in IBM Cognos Workspace Advanced, the formatting is
stored in a layout.
Moving the content and properties panes:
By default, the content and properties panes appear to the right of the work area.
You can move them to the left.
Related concepts:
“Options” on page 24
You can set various options that control the appearance and behaviors of IBM
Cognos Workspace Advanced (Tools, Options).
10 IBM Cognos Workspace Advanced Version 10.2.2: User Guide

Inserting Members Buttons Moved:
The insert individual members button
and the insert member with children
button have moved to the top of the content pane.
These buttons have the same function as they did in the previous release.
Related tasks:
“Insert a Member” on page 125
By default, when you insert members from the source tree into your report with
IBM Cognos Workspace Advanced, members are inserted with their children and
are inserted as sets. You can change how members are inserted. For example, you
may want to insert a member without its children or insert only the member's
children.
Expanded Tooltips:
Business Insight Advanced now features expanded tooltips for toolbar buttons.
The expanded tooltips include a title for the button and a description of what the
button does. To see a tooltip, pause the pointer over a button in the toolbar.
Sorting Buttons Combined:
You can now access all the sorting options from the same sort button
.
The options that appear when you click this button depend on your data source.
Related tasks:
“Sorting relational data” on page 111
You can sort items to view them in your preferred order.
“Sort Dimensional Data” on page 134
You can sort items to view them in your preferred order. For example, if your bar
chart shows revenue for each product line by sales region, you can display product
lines from the most revenue to the least across the x-axis.
New Report Style
Business Insight Advanced includes a new report style with updated colors and
gradients.
By default, new reports appear in the new report style.
Related concepts:
“Modifying Report and Object Styles” on page 179
Objects in reports are assigned a Cascading Style Sheet (CSS) class that provides a
default style for the object. For example, when you create a new report, the report
title has the class property Report title text assigned to it. In addition, objects
inherit the classes set on their parent objects.
Use Your Own External Data
You can now supplement your enterprise data with your own external data file.
Chapter 1. What's new in Cognos Workspace Advanced 11

You can import an .xls, .txt, .csv, or .xml file into IBM Cognos and create reports
that contain your own data. This allows you to leverage the IBM Cognos platform,
including the security, data integrity, and full range of reporting functionality.
You can perform self-service reporting without the need to ask your IT department
or administrator to set up a data source connection to your file. You import your
own data file and start reporting on it right away.
After importing, your external data file is protected by the same IBM Cognos
security as your enterprise data, thus allowing you to report on your data in a
secure environment.
Related concepts:
Chapter 12, “Working with your external data,” on page 185
You can supplement your enterprise data with your own external or personal data
file.
Charts
You can now create charts in Business Insight Advanced.
You can insert a specific chart type from any report with the insert chart button
on the toolbar or by dragging a chart object from the Toolbox tab. When you
insert a chart into a report that already contains a list, the list data is added to the
chart automatically.
The current default charts use many properties that allow you to customize most
aspects of the chart. If you work with Report Studio reports that use the legacy
chart type, you can set the Use legacy chart authoring option in Business Insight
Advanced to continue working with the legacy chart type.
Related concepts:
Chapter 5, “Charts,” on page 49
You can use IBM Cognos Workspace Advanced to create many chart types, such as
column, bar, area, and line charts.
Mozilla Firefox Support
Versions 3.5 and 3.6 of the Mozilla Firefox Web browser are now supported for
Business Insight Advanced.
For a full list of supported software environments, see http://www.ibm.com/.
Working with Relational Data Sources
You can now work with relational data sources and create list reports, or tabular
reports, in Business Insight Advanced.
Related concepts:
Chapter 8, “Exploring Relational Data,” on page 105
Relational data is best represented by lists. This data is organized in IBM Cognos
Workspace Advanced by query items.
Chapter 7, “Lists,” on page 103
Use list reports to show detailed information from your database, such as product
lists and customer lists.
12 IBM Cognos Workspace Advanced Version 10.2.2: User Guide

Working with Dimensional Data Sources
The user interface of Business Insight Advanced is now geared toward data
exploration, including drilling, excluding, moving, replacing, duplicating,
expanding, filtering, and joining members.
When working with dimensional data sources, you can do the following by
right-clicking a member in a set, using the Explore option on the Data menu, or
clicking the explore button
:
v Drill up and down on members and sets.
v Exclude members from the initial set or from the set as it is currently shown.
v Move members to the top or bottom of the set.
v Replace members or sets with child members, with level members, with a set of
selected members, with individual members, or with an intersection.
v Create duplicates of individual members, add members from the next level
down, or create an intersection.
v Expand and collapse members to add its child members below it as new rows.
v Filter the members in a set.
v Join two sets to create a new, larger set.
Related concepts:
Chapter 9, “Exploring Dimensional Data,” on page 123
Dimensional data sources include OLAP and dimensionally-modeled relational
(DMR) data sources. The Source tab
in the content pane shows a
member-oriented view of the data.
Default Behaviors for Members in Dimensional Data Sources
Business Insight Advanced includes new default behaviors for members when
working with dimensional data sources.
The default behavior for inserting members from the source tree into your report is
now to insert members with their children and to create sets.
The default behavior for double-clicking a member is now to drill up or down on
that member.
The default behavior for replacing a member is now to replace the entire edge
rather than just one node.
Related tasks:
“Insert a Member” on page 125
By default, when you insert members from the source tree into your report with
IBM Cognos Workspace Advanced, members are inserted with their children and
are inserted as sets. You can change how members are inserted. For example, you
may want to insert a member without its children or insert only the member's
children.
Drill-up and Drill-down Links
You can drill up and down in a report by selecting and then clicking data items if
you have enabled drill-up and drill-down links for all reports.
Related concepts:
“Options” on page 24
You can set various options that control the appearance and behaviors of IBM
Chapter 1. What's new in Cognos Workspace Advanced 13
Cognos Workspace Advanced (Tools, Options).
Report Name Used for the Exported Output File Name
When you run a report in an export format such as PDF, delimited text (CSV),
Microsoft Excel spreadsheet software (XLS), the IBM Cognos report name is now
used as the exported file name.
This allows you to save the report output using the same name as the original
report.
Related tasks:
“Running a report” on page 33
Run your report to see how the report will appear to report consumers.
Accessibility Features
Business Insight Advanced includes features to help you create reports that are
more accessible to people who have a physical disability, such as restricted
mobility or limited vision.
You can
v add alternative text for non-text objects, such as images and charts.
v add summary text for crosstabs, lists, and tables.
v specify whether table cells are table headers.
In addition, the documentation now includes alternate text for all graphics so that
screen readers can interpret them.
Related concepts:
“Keyboard Shortcuts” on page 201
This product uses some standard Microsoft Windows and accessibility shortcut
keys.
Appendix A, “Accessibility Features,” on page 201
Accessibility features help users who have a physical disability, such as restricted
mobility or limited vision, to use information technology products.
Summarizing Data
You can now easily add summaries to your reports.
These summaries include the following:
v automatic summary
v total
v count
v average
v minimum
v maximum
Related tasks:
“Summarize Relational Data” on page 110
Summarize data in your reports to obtain a total, count, average, minimum,
maximum, and so on.
“Summarize Dimensional Data” on page 140
Summarize data in your reports to obtain a total, count, average, minimum,
maximum, and so on.
14 IBM Cognos Workspace Advanced Version 10.2.2: User Guide
Filtering to Limit Data
In addition to context filters, you can now add filters in your report to exclude
data based on a condition.
For example, you can select a value in your report, and filter out all values that are
less than the one you selected. You can also combine filters to create more complex
conditions.
In addition, you can filter sets of members to show only the top or bottom values.
For example, if you have a crosstab showing revenue for each product line for all
years, you can filter the product lines to show only the top three product lines by
revenue.
Related tasks:
“Filtering relational data” on page 115
Use filters to remove unwanted data from reports. Data is displayed in the report
only if it meets the filter criteria. When working with relational data sources, the
available filtering options are determined by the data that you select.
“Filtering dimensional data” on page 150
Use filters to remove unwanted data from reports. Data is shown in the report
only if it meets the filter criteria.
“Limiting data to top or bottom values” on page 152
You want to focus your report on the items of greatest significance to your
business question. For example, you want to identify your top 100 customers and
what that group of customers is worth.
Preview Reports when Opening and Saving
You can now see a preview of the report when you open or save it.
To preview a report, click Tools, Options, Display report preview.
Related concepts:
“Options” on page 24
You can set various options that control the appearance and behaviors of IBM
Cognos Workspace Advanced (Tools, Options).
Lay Out Report Pages
You can divide your report pages into various layouts, including two columns, two
rows, and four quarters. Your report objects then fit into the report sections.
Related tasks:
“Lay Out Report Pages” on page 165
You can divide your report pages into various layouts, including two columns, two
rows, and four quarters. You can then drag report objects to the report sections.
Braces and Parentheses are Breakable
When you run a report in PDF format, braces {} and parentheses () no longer stay
on the same line as the text before them.
For example, Products(2012) may now break to a new line between Products and
(2012).
Chapter 1. What's new in Cognos Workspace Advanced 15

Changed features in Cognos Business Insight Advanced
version 10.1.0
In this release, some features have been changed.
Line break rules in PDFs have changed
Line break rules for word wrapping in PDFs have changed slightly from the last
release. Brackets and parenthesis such as{}and()arenowtreated as breakable.
For example, in past releases, the following string would be treated as a single
non-breaking string.
Boilers(Steam)
In this release, "Boilers" and "(Steam)" are treated as separate strings which might
result in the following when the string occurs at the end of a line.
Boilers
(Steam)
Removed features in Cognos Business Insight Advanced
version 10.1.0
In this release, some features have been removed.
Analyze with Analysis Studio
The ability to open a report with IBM Cognos Analysis Studio from within IBM
Cognos Business Insight Advanced (Tools or right-click, Analyze) was removed in
this release.
Excel 2000 and Excel 2000 Single Sheet Report Outputs
The Microsoft Excel 2000 spreadsheet software and Excel 2000 Single Sheet
spreadsheet software report outputs are no longer supported in this release.
16 IBM Cognos Workspace Advanced Version 10.2.2: User Guide

Chapter 2. Understanding Cognos Workspace Advanced
IBM Cognos Workspace Advanced is a Web-based tool used to author reports and
analyze data. The user interface allows business users to gain insight into their
business.
Cognos Workspace Advanced allows you to create reports with relational or
dimensional data sources, and show data in lists, crosstabs, and charts. You can
also use your own external data source.
You can open Cognos Workspace Advanced two different ways:
v from a workspace in IBM Cognos Workspace to perform advanced editing or to
create a new report (Do More)
v from either the Launch menu in IBM Cognos Connection or from the Welcome
page (Author Business Reports) to create new reports or edit existing reports.
Relational and dimensional reporting styles
You can create reports in IBM Cognos Workspace Advanced using either a
relational reporting style or a dimensional reporting style depending on the type of
data source you use.
The Cognos Workspace Advanced tools and query language are the same for both
reporting styles. However, it is important to choose a reporting style to ensure that
you are making the most of your data and to avoid mixing dimensional and
relational concepts.
How to choose a reporting style
When authoring a report, first choose your preferred reporting style for working
with data: relational or dimensional. You can choose a reporting style from your
viewpoint:
v If you think about your data as tables and columns, you have a relational
viewpoint and should use a relational reporting style.
v If you think about your data as a number of dimensions intersecting at cells,
you have a dimensional viewpoint and should use a dimensional reporting style.
The type of data source that you use might also help you choose a reporting style.
If the metadata tree shows members and dimensions, the data is dimensional. If it
shows tabular query subjects, the data is relational. For more information, see
“Data source icons” on page 32. Relational data requires using the relational
reporting style. Dimensional data can be queried with either reporting style.
Relational reporting style
The relational reporting style consists of lists. You focus the data with filters and
summarize with header and footer summaries.
v If your data is purely relational, then only query subjects and query items
appear in the Source tab
of the content pane, and you must use the
relational reporting style.
© Copyright IBM Corp. 2005, 2014 17
v If your data is dimensional, then dimensions appear in the Source tab of
the content pane, and you can still use a relational reporting style, but instead of
query items (columns) and query subjects (tables), you use measures, levels, and
level properties.
To see an example of relational style reporting with dimensional data, see the
Manager Profile sample report in the GO Data Warehouse (analysis) package.
The relational reporting style is similar to report authoring in IBM Cognos Query
Studio.
Dimensional reporting style
The dimensional reporting style consists of measures and members from different
hierarchies arranged in a crosstab with cell values at the intersections. You focus
the data with set expressions that navigate from specific members in the hierarchy
and summarize with set summaries. To use the dimensional reporting style, you
must have either dimensional data or dimensionally modelled relational data.
To see an example of dimensional style reporting with dimensional data, see the
GO Balance Sheet as at Dec 31, 2012 sample report in the GO Data Warehouse
(analysis) package.
The dimensional reporting style is similar to report authoring in IBM Cognos
Analysis Studio.
Guidelines for each reporting style
This user guide is divided into relational and dimensional reporting sections so
that you can follow the best practices for using this product with the reporting
style that you have chosen. The following table outlines the best practices for both
reporting styles.
Table 1. Best practices for the relational and dimensional reporting styles
Item Relational reporting style Dimensional reporting style
Report type Lists
Crosstabs pivoted from lists
Charts created from lists
Crosstabs
Charts created from scratch or
from crosstabs
Metadata tree The view includes the following
items:
v package
v folder
v namespace
v query subject
v query item
v measure
v level
The view includes the following
items:
v package
v folder
v namespace
v fact
v measure
v dimension
v hierarchy
v level
v level attribute
v member
18 IBM Cognos Workspace Advanced Version 10.2.2: User Guide

Table 1. Best practices for the relational and dimensional reporting styles (continued)
Item Relational reporting style Dimensional reporting style
Data items Data items using relational and
common constructs.
Data items using dimensional
and common constructs.
Extended data items.
Inserting data Cognos Workspace Advanced
shows the data for the selected
query item. For example, when
you add the Product type query
item or level to a list, all product
types appear when you run the
report.
Cognos Workspace Advanced
shows just the data related to
the selected member or set of
members.
By default, the insertion options
are set to include only the
selected members. For example,
when you add Camping
Equipment and Golf Equipment
to a crosstab row or column
edge, just those members appear
when you run the report.
You can also set the insertion
options to include the selected
member and its children as a
set. For example, when you add
Camping Equipment to a
crosstab, that member appears
in the report, along with all of
the product types that are part
of the Camping Equipment
product line.
Focusing or filtering
data
Use the filtering options
available from the filter icon
on the toolbar. For example, add
the Quarter query item to a list
and filter to show only Q3.
If you are using the relational
reporting style with relational
data, use only the techniques in
“Filtering relational data” on
page 115.
Add only the relevant members
to an edge of the crosstab or to
the context filter. For example,
only add the Q3 member to
your report.
If you are using the dimensional
reporting style, use only the
following techniques:
v “Creating a context filter” on
page 151
v “Limiting data to top or
bottom values” on page 152
v “Filtering the members within
a set” on page 153
Drilling Drilling through by value Drilling through by member
Drilling up and down
Alternative Studios Cognos Query Studio Cognos Analysis Studio
Related concepts:
Chapter 8, “Exploring Relational Data,” on page 105
Relational data is best represented by lists. This data is organized in IBM Cognos
Chapter 2. Understanding Cognos Workspace Advanced 19

Workspace Advanced by query items.
Chapter 9, “Exploring Dimensional Data,” on page 123
Dimensional data sources include OLAP and dimensionally-modeled relational
(DMR) data sources. The Source tab
in the content pane shows a
member-oriented view of the data.
Working in Cognos Workspace Advanced
To create reports in IBM Cognos Workspace Advanced, you must become familiar
with the Cognos Workspace Advanced environment, including the user interface,
the basic report layout, and setting options.
The user interface
IBM Cognos Workspace Advanced has a work area, content and properties panes,
a page layers area, and a context filter area to help you to create reports.
The following figure shows the Cognos Workspace Advanced user interface.
Use a screen resolution of at least 1024 by 768 pixels.
Figure 2. The user interface of Cognos Workspace Advanced
20 IBM Cognos Workspace Advanced Version 10.2.2: User Guide

User interface profiles
A user interface profile might be set for you by an IBM Cognos Business
Intelligence administrator. Users with different profiles see different interfaces and
experience different default behavior. If you are able to use more than one profile,
you are prompted to choose a profile when you start Cognos Workspace
Advanced.
For more information about profiles, see your Cognos BI administrator or the IBM
Cognos Business Intelligence Administration and Security Guide.
The work area
The work area is where you create your report.
By default, you see live data as you create your report. You can switch to design
mode where you see only placeholder data. For more information, see “Work in
Preview or Design Mode” on page 22.
Content pane
The content pane contains objects that you can add to a report. You add objects to
a report by dragging them to the work area.
Tip: You can reposition the content pane to the left of the screen (Tools > Options,
View tab).
You cannot reposition the pane when you open a widget from a workspace in IBM
Cognos Workspace to edit it in Cognos Workspace Advanced.
Source tab
The Source tab of the content pane contains items from the package that is
selected for your report, such as data items and calculations. The source tree
presents a dimensional view of your data, which is organized into dimensions,
hierarchies, levels, and measures. For more information, see Chapter 9, “Exploring
Dimensional Data,” on page 123.
By default, the maximum number of items that are shown in the source tree is 50.
Your administrator can set a different value for optimum performance, depending
on the size of the data source.
For more information about inserting items from the source tree into your report,
see “Add Data to a Report” on page 31.
Toolbox tab
The Toolbox tab
of the content pane contains various objects, such as text and
graphics, that you can add to your report.
For more information about inserting objects from the Toolbox tab into your
report, see “Insert Other Objects” on page 163.
Chapter 2. Understanding Cognos Workspace Advanced 21

Search tab
The Search tab of the content pane contains the results when you search for
members. You can insert the members that are found in a search directly into a
report.
Tip: The Search tab appears only after a search for a member runs.
For more information, see “Search for a Member” on page 125.
Properties pane
The Properties pane shows the formatting for an object in a report. You can change
the formatting properties by using either the toolbar or the Properties pane. If you
prefer to use the Properties pane, you can click Hide Style Toolbar to hide the
toolbar icons that control object formatting.
Tip: You can reposition the Properties pane to the left of the screen (Tools >
Options, View tab).
You cannot reposition the pane when you open a widget from a workspace in
Cognos Workspace to edit it in Cognos Workspace Advanced.
Page layers area
Use the Page layers area to create sections, or page breaks, in a report to show
values for each member on a separate page. For example, you can drag Northern
Europe sales territory from the Source tab
to the Page layers area. The report
is broken into a separate page for each territory within northern Europe. Each
page's context appears in the report header.
For more information, see “Create Page Layers” on page 133.
Context filter area
Use the Context filter area to filter your report to show values, or context, only for
a specific data item. This technique is also known as a slicer filter. For example,
you can drag Sales Territory from the Source tab
to the Context filter area.
When you click a specific territory from the list, the values in the crosstab change
to represent data for that territory.
For more information, see “Creating a context filter” on page 151.
Work in Preview or Design Mode
By default, you see live data as you create your report. However, to see data, you
must add enough information in your report to resolve the multi-dimensional
query. You can also switch to only see placeholder data, using the Page Design
mode.
You cannot work in Page Design mode when you have opened a widget from a
workspace in IBM Cognos Workspace to edit it in IBM Cognos Workspace
Advanced.
22 IBM Cognos Workspace Advanced Version 10.2.2: User Guide

Procedure
1. From the View menu, click Page Design or Page Preview.
2. If you want to specify how many rows of data to show per page when working
in Page Preview mode, from the View menu, click Preview Options and type a
new value.
Basic Report Layout
A layout is a set of pages that defines the appearance and formatting of a report.
When you design the layout of a report, you
v present the data in a meaningful way
v design the report by adding formatting, such as borders, color, and page
numbers
v specify how the data flows from one page to the next
Pages
Pages are containers for the layout objects that you use to build a report. A page is
made up of the following mandatory and optional components:
v page header (optional)
v page body (mandatory)
v page footer (optional)
When you run a report, the amount of data queried often exceeds one page. As a
result, pages are added until all the data is shown. You have control over how data
flows from one page to the next.
Objects
You add layout objects to a page when you create a report. The most commonly
used objects are text, blocks and tables. Blocks are often used to lay out horizontal
bands of information. Use blocks to hold text or other information.
Related tasks:
“Insert Other Objects” on page 163
In addition to text and images, the Toolbox tab contains other objects that you can
add to the report layout.
Using visual aids to design your report layout
Visual aids in the work area help you when you are designing your report layout.
Procedure
1. Click View > Visual Aids.
2. Select the options that you want to make visible.
Table 2. Descriptions of visual aids
Option Description
Show Boundary Lines Overrides all boundary line settings by replacing them
with default (dotted line) lines. For example, if you set
the Border property for an object, the border lines are
replaced with dotted lines.
Show Page Header & Footer Shows the page header and page footer.
Chapter 2. Understanding Cognos Workspace Advanced 23

Table 2. Descriptions of visual aids (continued)
Option Description
Show Drag & Drop Padding Shows a drag-and-drop zone when the Padding
property for an object is set to 0.IfthePadding
property is set to a value that is greater than the
minimum padding that IBM Cognos Workspace
Advanced uses to show drag-and-drop zones, only the
minimum padding is shown.
Show Container Selectors Shows a small selector (three orange dots) in the top
left corner of list and crosstab reports that allows you
to select lists and crosstabs and the objects that they
contain.
Options
You can set various options that control the appearance and behaviors of IBM
Cognos Workspace Advanced (Tools, Options).
Note: You cannot set Cognos Workspace Advanced options when you have
opened a widget from a workspace in IBM Cognos Workspace to edit it in Cognos
Workspace Advanced.
View Options
Table 3. Descriptions of the options on the View tab of the Options window
Option Description
Show all hidden dialogs Shows all dialog boxes where the Show this
dialog in the future check box was cleared,
such as the Welcome dialog box at startup.
Reuse Cognos Viewer window Reuses the same IBM Cognos Viewer
window when you rerun a report without
first closing the window.
Resize Cognos Viewer window Maximizes the IBM Cognos Viewer window
when you run a report.
Enable animation Animates the appearance of dialog boxes,
menus, and panes.
Window startup size Specifies the size of the Cognos Workspace
Advanced window at startup.
Position pane on the right (requires restart) Moves the content and Properties panes to
the right of the work area. This check box is
selected by default. For the change to take
effect, you must close and then restart
Cognos Workspace Advanced.
24 IBM Cognos Workspace Advanced Version 10.2.2: User Guide

Table 3. Descriptions of the options on the View tab of the Options window (continued)
Option Description
Show rich tooltips (requires restart) Specifies whether to show descriptive
tooltips when you hover over a button in
the toolbar. This check box is selected by
default. For the change to take effect, you
must close and then restart Cognos
Workspace Advanced.
Display report preview Shows a preview of the report when you
open or save a report, within the Open,
Save, and Save As dialog boxes.
Start page view Enables you to start Cognos Workspace
Advanced in Design or Preview view. For
the change to take effect, you must close and
then restart Cognos Workspace Advanced.
Edit Options
Table 4. Descriptions of the options on the Edit tab of the Options window
Option Description
Automatically populate values lists When building expressions in the expression
editor, automatically shows values when
you browse the data of a data item.
Enable drill-up or drill-down links For data items where drill-up or drill-down
is possible, enables drill-up or drill-down
links. When you select a data item, it
becomes a link that you can click to drill up
or down. Also, you can still double-click
data items to drill up and down.
By default, this option is enabled.
Drop replace on crosstab and chart nodes Specifies what the existing members are
replaced with when you drag a new
member onto a report.
Double click on member action When working with dimensional data,
specifies what happens when you
double-click a member data item.
By default, you drill down or up on the item
that you double-click.
Chapter 2. Understanding Cognos Workspace Advanced 25

Report Options
Table 5. Descriptions of the options on the Report tab of the Options window
Option Description
Table Style inheritance When a table style is applied to a list or
crosstab, specifies whether new objects
inserted in the list or crosstab should inherit
the style. For more information, see
“Applying table styles” on page 166.
Automatic group and summary behavior
for lists
When working with lists, automatically adds
an overall aggregate summary in the list
footer and a summary for any groups in the
list. When grouping a column, automatically
makes it the first column in the list.
Automatically create crosstab headers for
sets
When adding sets in a crosstab that uses a
dimensional data source, automatically adds
header labels on new columns and rows.
The headers help consumers of the report to
understand where the data is in the
hierarchy.
Limit on inserted individual members When working with a dimensional data
source, limits the number of child members
that are inserted. For example, you specify 3
for this option and in the Source tab
you specify the option to insert children
when you drag a member to a data
container. You then drag the Camping
Equipment member to the rows of a
crosstab. What you see as rows are the child
members Cooking Gear, Tents, and Sleeping
Bags, and a row named Others (Camping
Equipment) for the remaining child
members of Camping Equipment.
Advanced Options
Table 6. Descriptions of the options on the Advanced tab of the Options window
Option Description
Use operating system clipboard If Cognos Workspace Advanced is running
in the Microsoft Internet Explorer Web
browser, uses the Microsoft Windows
operating system's clipboard instead of the
internal application clipboard.
Tip: If Cognos Workspace Advanced is
running in the Mozilla Firefox Web browser,
the internal application clipboard is always
used.
Use legacy chart authoring Enables you to create new reports using the
legacy Report Studio charts instead of the
default Cognos Workspace Advanced charts.
26 IBM Cognos Workspace Advanced Version 10.2.2: User Guide

Table 6. Descriptions of the options on the Advanced tab of the Options
window (continued)
Option Description
Disable previews When editing properties such as date and
number formatting, does not display a
sample of the formatting that is applied to
data. When this option is not enabled, either
sample data or data from your data source
is displayed with formatting options
applied.
Additionally, when in Page Design view,
displays a static image for a chart instead of
updating the chart with new data.
Override 10.x styles with 8.x styles on new
reports
Specifies whether to use the version 8.x
report styles by default when creating new
reports.
For more information about report styles,
see “Modifying Report and Object Styles” on
page 179.
Enable accessibility (requires restart) Specifies whether to enable accessibility
features in Cognos Workspace Advanced.
For the change to take effect, you must close
and then restart Cognos Workspace
Advanced.
For more information about accessibility
features, see “Accessibility features in IBM
Cognos Workspace Advanced” on page 201.
Member display count limit (in source tree) When working with dimensional data,
specifies the maximum number of members
that can appear in the Source tab
pane
before you need to perform a search.
Web browser settings
IBM Cognos Workspace Advanced can be used in the Microsoft Internet Explorer
and Mozilla Firefox web browsers.
To review an up-to-date list of the environments that are supported by IBM
Cognos products, including information about operating systems, patches,
browsers, web servers, directory servers, database servers, and application servers,
see Supported Software Environments (http://www.ibm.com/support/
docview.wss?uid=swg27042164).
IBM Cognos Business Intelligence uses the default browser configurations provided
by the Microsoft Internet Explorer and Mozilla Firefox web browsers. Additional
required settings are specific to the browser.
For the Microsoft Internet Explorer web browser, the following settings are
required:
Chapter 2. Understanding Cognos Workspace Advanced 27
v Allow Cookies
v Active Scripting
v Allow META REFRESH
v Run ActiveX controls and plug-ins
v Script ActiveX controls marked safe for scripting
v Binary and Script Behaviors
v Allow programmatic clipboard access
v Enable pop-ups for the IBM Cognos BI server
For the Firefox web browser, the following settings are required:
v Enable JavaScript
v Accept Cookies
v Allow Scripts to disable or replace context menus
v Enable pop-ups for the IBM Cognos BI server
For more information about the web browser configuration and cookies used by
IBM Cognos BI, see the IBM Cognos Business Intelligence Installation and
Configuration Guide.
28 IBM Cognos Workspace Advanced Version 10.2.2: User Guide

Chapter 3. Creating Reports
When you create a report, you are actually creating a report specification. The
report specification defines the queries and prompts that are used to retrieve data,
as well as the layouts and styles used to present the data. For simplicity, the report
specification is named the report.
Specify the Package
Specify the package that will provide items for the report.
A package contains a set of related objects, such as members, dimensions, filters,
and calculations. When you open a package in IBM Cognos Business Intelligence,
these objects are visible in the Source tab
.
Note: You cannot specify the package when you have opened a widget from a
workspace in IBM Cognos Workspace to edit it in IBM Cognos Workspace
Advanced. In this case, the widget already has a package.
Before you begin
The package must be previously created and published to the IBM Cognos
Connection portal. For more information, see the IBM Cognos Framework Manager
User Guide.
Important: If the package version changed since you opened IBM Cognos
Workspace Advanced, close and restart Cognos Workspace Advanced to ensure
that you are working with the latest version of the package.
Procedure
1. In the portal, from the Launch menu, click Cognos Workspace Advanced.
Note: If there is more than one package available, the Select a package page
appears. Otherwise, Cognos Workspace Advanced starts.
2. If more than one package exists, click the one you want to use.
3. In the Welcome dialog box, choose whether to create a new report or template,
open an existing report or template, or create a new report from an existing
report or template.
v To create a new report, click Create New and choose a basic report layout.
v To open an existing report or template, click Open Existing and select a
report or template.
v To create a new report from an existing report or template, click New from
Existing and select a report or template.
Results
Objects from the package now appear on the Source tab
.
Tip: You can later change packages.
© Copyright IBM Corp. 2005, 2014 29

Refresh the package
If the package that a report is using changed, refresh it to ensure that you are
working with the latest content.
About this task
The contents of a package can change without the package version changing. For
example, your modeler makes changes to a model and republishes the package
with model versioning disabled.
Procedure
Refresh the package.
v To get the latest contents of the current package version being used, in the
Source tab
, click the refresh icon .
v To get the latest package version, close and restart your component.
Choosing a basic report layout
IBM Cognos Workspace Advanced includes several basic report layouts that
include report objects, such as lists, crosstabs, and charts. You can also choose to
start with a blank report or create a new report from an existing report or
template.
Note: You cannot choose a basic report layout when you have opened a widget
from a workspace in IBM Cognos Workspace to edit it in IBM Cognos Workspace
Advanced. In this case, the widget already has a basic report layout.
Procedure
1. Click File > New.
2. If you want to change the package, click the ellipsis (...) button and click a
different package.
3. Choose a basic report layout:
v To create a report using one of the predefined report layouts, double-click the
layout.
v To create a new report from an existing report or template, double-click From
Template, locate the report or template, and click Open.
Tip: Click the Type box and then click Report templates to see only existing
templates.
Inserting a data container from the toolbox tab
You can insert data containers from the toolbox tab into a report.
About this task
When you insert a data container from the Toolbox tab, you can specify a name
for the data container and the query that you want to create for the container
instead of accepting the default names that are generated.
30 IBM Cognos Workspace Advanced Version 10.2.2: User Guide

Extensible visualizations can contain one or more data containers. When you insert
an extensible visualization, you can specify the visualization name, the names of its
data containers, and the query that you want to create for the data containers.
Tip: By default, a single query is created for a visualization so that any filters that
you add are shared across all data containers in the visualization. You can specify a
different query for each data container.
Procedure
1. From the Toolbox tab , drag the data container that you want to insert in
the report.
2. In the window that appears, type a name for the data container and a name for
the query to be created for the container.
Tip: You can link a container to an existing query by clicking the query menu
and choosing from the list of available queries.
Add Data to a Report
Select the data items that you want to appear in the report.
The data tree in the Source tab
is members-orientated. It allows you to add
dimension members, values, and hierarchies directly to your report. You can add a
single member, only the member's children, or both the member and its children.
If you frequently use items from different query subjects or dimensions in the
same reports, ask your modeler to organize these items into a folder or model
query subject and then to republish the relevant package. For example, if you use
the product code item in sales reports, the modeler can create a folder that contains
the product code item and the sales items you need.
Procedure
From the Source tab , drag each data item to the work area location where
you want it to appear.
Note: A flashing black bar indicates where you can drop an item.
Another way to insert a data item is to right-click each item and click Insert.
Results
Tip: For more information about a data item, select the data item and, from the
Data menu, click Data Properties. If you want to remove a data item from the
report, select it and click the delete button.
Related tasks:
“Insert a Member” on page 125
By default, when you insert members from the source tree into your report with
IBM Cognos Workspace Advanced, members are inserted with their children and
are inserted as sets. You can change how members are inserted. For example, you
may want to insert a member without its children or insert only the member's
children.
Chapter 3. Creating Reports 31

Data source icons
Each object in the data source has a representative icon. You can insert all of the
following objects in a report, except for packages and dimensions.
Table 7. Objects represented by data source icons
Icon Object
Package, which contains the objects you can insert in a report.
Namespace, used to organize objects.
Query subject, which represents a table in the database.
In relational data sources, query item, which represents a column of
qualitative data in the database, such as product name or country or
region.
In dimensional data sources, level attribute, which represents a property
of a level.
A member is a unique item within a hierarchy. For example, Camping
Equipment and 4 Man tent are members of the Products Hierarchy.
Dimension, which represents a broad grouping of descriptive data about
a major aspect of a business, such as products, dates, or markets.
Hierarchy, which represents a collection of dimensional members
organized into a tree structure.
Level, which is a set of members that have common attributes. For
example, a geographical dimension might contain levels for country or
region or city.
Multiple levels can exist within a level hierarchy, beginning with the root
level. The root level is the parent and rollup of all members in the first
level. It is used to obtain a rollup of all values across the hierarchy and to
provide a convenient point to start drilling.
For example, a Years level hierarchy may contain the following levels:
v Root level Years
v First level Year
v Second level Quarter
v Third level Month
Measure or fact, a query item that represents a column of quantitative
data in the database, such as revenue or quantity, in a relational model.
Measure or fact, a query item that represents a column of quantitative
data in the database, such as revenue or quantity, in a dimensional
model.
Measures folder, which contains hierarchical measures, in a dimensional
model.
Model filter.
Model calculation.
Folder, used to organize data items. You cannot import a folder into your
report.
32 IBM Cognos Workspace Advanced Version 10.2.2: User Guide

Save a Report
Save your report to preserve the modifications you made.
Reports are saved to the IBM Cognos Business Intelligence server. You can also
save your report on your computer.
Note: You cannot save a report when you have opened a widget from a
workspace in IBM Cognos Workspace to edit it in IBM Cognos Workspace
Advanced. In this case, you can click Done to finish editing the widget and return
to Cognos Workspace.
Procedure
1. Click File > Save, or click File > Save As to save a copy of the report under a
different name.
2. If you are saving the report for the first time, specify where to save the report
and type a file name.
For information about setting up folders in IBM Cognos Connection for your
reports, see the IBM Cognos Connection User Guide.
3. Click Save.
Running a report
Run your report to see how the report will appear to report consumers.
You can also run a report or a group of reports in IBM Cognos Connection. For
more information, see the IBM Cognos Connection User Guide.
When you run a report in an export format such as PDF, delimited text (CSV), or
Microsoft Excel spreadsheet software format (XLS), the IBM Cognos report name is
used as the exported file name.
Tip: You cannot run a report when you have opened a widget from a workspace
in IBM Cognos Workspace to edit it in IBM Cognos Workspace Advanced. In this
case, you can click Done to finish editing the widget and return to Cognos
Workspace.
Procedure
1. Open the report that you want.
2. If you want to set run options, from the Run menu, click Run Options.
The default value is the value of the selected corresponding run option in IBM
Cognos Connection.
Note: The run options you set apply only to the current session. When you
close Cognos Workspace Advanced, the options return to the default settings.
3. Change any values you want for the current session.
Option Description
Format None.
Paper size Specify only if the output format is PDF.
Chapter 3. Creating Reports 33

Option Description
Paper orientation Specify only if the output format is PDF.
Data mode Specify how much data is returned. All Data returns all data.
Limited Data limits the amount of data returned based on
design mode filters defined in the package. No Data returns
artificial data instead of actual data from the data source.
For more information about design mode filters, see the IBM
Cognos Framework Manager User Guide.
Language The content language sets the preferred language for the data,
IBM Cognos Viewer, dates, and so on.
Rows per page Specifies the number of rows to appear on each page.
Prompt Select to be prompted for each prompt defined, unless the
prompt is defined in a report page.
If you clear the check box, you are prompted only if the report
cannot run without user intervention. For example, if a report
has a single parameterized filter that is optional, you are not
prompted when you run the report.
Include accessibility
features
Specifies whether accessibility features, such as alternate text
on images and charts and summary text in tables, are included
in the report output.
For more information about how to create accessible reports,
see “Considerations to Improve Report Accessibility” on page
202.
Enable bidirectional
support
Specifies whether to enable bidirectional support in the report
output.
Tip: You can also enable bidirectional support in Cognos
Connection by modifying your user preferences (My
Preferences link). If you enable bidirectional support in
Cognos Connection, this run option will be automatically
selected.
4. From the Run menu, click one of the options to produce the report in the
format you want.
You can produce a report in HTML, PDF, CSV, various Microsoft Excel formats,
and XML.
Restriction: The formats that are available depend on the capabilities set by the
administrator for each user. You may not be able to run reports in all formats.
For more information, see the IBM Cognos Business Intelligence Administration
and Security Guide or contact your administrator.
Results
The report runs in IBM Cognos Viewer. Once the report has finished running, you
can run the report again in the same format or in a different format. If you run the
34 IBM Cognos Workspace Advanced Version 10.2.2: User Guide
report again in CSV or XLS format, the report appears in a new browser window
or tab.
Related concepts:
“Support for bidirectional content” on page 169
You can author reports that support bidirectional content. You can specify base text
direction, digit shaping, and container direction.
Running a Report Against a Dimensional Data Source
You can cancel a report that is running against Microsoft SQL Server Analysis
Services only during the initial portion of its execution. After this time, the report
runs to completion.
Units of Measure Notation
If you see an asterisk character (*), one of the following was detected:
v an unknown currency
v a value with an unknown or questionable unit of measure, such as a mixed
currency calculation or rollup
Mixed currency values occur when you calculate values with different
currencies.
This behavior occurs when you are using an IBM Cognos cube as a data source.
Producing a Report in CSV Format
IBM Cognos Business Intelligence can produce reports in CSV format so you can
open them in other applications, such as Microsoft Excel spreadsheet software.
Reports saved in CSV format
v are designed to support Unicode data across many client operating systems
v are UTF-16 Little Endian data encoded
v include a BOM (Byte Order Mark) at the beginning of the file
v are tab-delimited
v do not enclose strings in quotation marks
v use a new line character to delimit rows
You can open reports saved in CSV format using Microsoft Excel, Microsoft
Windows Wordpad, and Oracle StarOffice software. By default, reports produced
in CSV format will appear in the application associated with the .csv file type.
In IBM Cognos Connection, you can configure the CSV output to suit your
environment. For example, you can specify the character used to delimit fields. For
more information, see the Administration and Security Guide, or contact your
administrator.
Producing a Report in Microsoft Excel Format
You can export your report output to several different Microsoft Excel spreadsheet
software formats.
Excel 2007 and Excel 2007 Data formats render report output in native Excel XML
format, also known as XLSX. This format provides a fast way to deliver native
Excel spreadsheets to Microsoft Excel 2002, Microsoft Excel 2003, and Microsoft
Chapter 3. Creating Reports 35
Excel 2007. Users of Microsoft Excel 2002 and Microsoft Excel 2003 must install the
Microsoft Office Compatibility Pack, which provides file open and save capabilities
for the new format.
Excel 2007 provides fully formatted reports for use in Microsoft Excel version 2007.
The output is similar to other Excel formats, with the following exceptions:
v Charts are rendered as static images.
v Row height can change in the rendered report to achieve greater fidelity.
v Column widths that are explicitly specified in reports are ignored in Microsoft
Excel 2007.
v Merged cells are used to improve the appearance of reports.
v The default size of worksheets is 65 536 rows by 256 columns.
Your IBM Cognos administrator can enable larger worksheets and change the
maximum number of rows in a worksheet, up to a maximum of 16,384 columns
by 1,048,576 rows, by using advanced server properties. For more information,
see the IBM Cognos Business Intelligence Administration and Security Guide.
Excel 2007 Data provides data for use in Microsoft Excel version 2007. These
reports only contain minimal formatting. Default data formatting is applied to the
data based on data type and assumes that each column has a single data type.
The output is similar to other Excel formats, with the following exceptions:
v The generated output includes only the first list query in the report. If a report
contains multiple queries and the first query is a multi-dimensional query for a
crosstab or for a chart, an error message is displayed when the report runs.
v Nested frames and master-detail links are not supported.
v Cells in the Microsoft Excel file have a default width and height. You must
adjust the column width and height if the data is larger than the default size.
v Style specifications are not rendered, including color, background color, and
fonts.
v Borders are not rendered.
v User-specified data formatting in the report specification are not applied,
including exception highlighting and color rules for negative numbers.
Excel 2002 provides fully formatted reports for use in Microsoft Excel versions
earlier than 2007. Excel 2002 format also offers the following benefits:
v Spreadsheets are contained in a single file for reliable spreadsheet navigation.
v The maximum size of worksheets is 65,536 rows by 256 columns.
Related concepts:
“Larger worksheet sizes for Microsoft Excel 2007 report outputs” on page 8
IBM Cognos Business Intelligence now supports a larger worksheet size for report
outputs exported in Microsoft Excel 2007 format.
Appendix C, “Limitations When Producing Reports in Microsoft Excel Format,” on
page 211
There are limitations when producing reports in Microsoft Excel format.
Option to group repeating cells in reports produced in Excel
2007 format
When you produce reports in Excel 2007 format, you can specify whether
repeating cells are grouped, or merged, into a single cell.
36 IBM Cognos Workspace Advanced Version 10.2.2: User Guide
Report outputs to Excel 2007 format are easier to read and look more like other
output formats when repeating values are grouped. If further analysis of the data
is required within Excel or if the outputs are used to provide data to another tool,
it is often preferable for repeating values to be populated in each row or column to
which they apply.
By default, repeating cells are merged in Excel 2007 output. For example, Product
line is a grouped column in a list. The values for Product line, such as Camping
Equipment and Golf Equipment, appear once in a merged cell in Excel output.
When repeating cells are not grouped, the values for Product line appear in each
repeating cell. The option to merge repeating cells in Excel output is controlled by
selecting or clearing the Group repeating cells when exporting to Excel check box
in the Report Properties dialog box.
Crosstabs
In general, grouped data item values appear in each repeating cell. For example, a
crosstab contains Product line and Product type as rows. When repeating cells are
ungrouped, the label for each product line value is rendered in each repeating row
cell.
If a cell on a column edge spans multiple worksheet rows, the cell label is not
repeated in all rows. If a cell on a row edge spans multiple columns, the cell label
value is not repeated in multiple worksheet columns. For example, a crosstab
contains Product line, Product type, and Product as rows. A summary is added for
Product line. The product line summary cell spans Product line, Product type, and
Product. In Excel, repeating cells are produced for the summary row, but the label
for the summary appears only in the first cell.
Repeating cells that are produced from crosstab headers follow this behavior. For
example, Product line and Product type are inserted as rows in a crosstab. Headers
named Product line and Product type are created, and each header spans two
columns. In Excel, the header labels appear only in the first cell. The repeating cells
are empty.
If a layout object, such as a table or image, is inserted in the crosstab corner, the
size of the object might cause the crosstab corner column edge to span multiple
rows and row edges to span multiple columns. When this situation occurs, column
labels repeat only in the column span and row labels repeat only in the row span.
The following figure shows a crosstab that contains Year as columns and Order
method type as rows. A three by three table is inserted in the crosstab corner. In
Excel output, the size of the table produces repeating cells in the columns and in
the rows. Year labels, such as 2010, repeat only in the columns and not in the rows.
Order method labels, such as E-mail, repeat only in the rows.
Chapter 3. Creating Reports 37

Lists
In lists, grouped data values are repeated in ungrouped cells. For example, a list
contains Product line and Product type, and Product line is grouped. When
repeating cells are ungrouped in Excel, the label for each product line value is
rendered in the repeating cells.
Group header and list page header labels are not repeated. These labels appear
only in the first cell, and repeating cells are empty.
Nested data containers, images, and charts
Nested data containers, images, and charts in a report can produce merged cells.
For example, when a crosstab is inserted in a list, other columns in the list appear
as merged cells in Excel 2007 output. The following rules are applied when merged
cells are split.
1. If a cell is merged as a result of a data item grouping, then data values are
repeated in the split cells.
2. If a cell is merged as a result of a nested data container, image, or chart, then
data values are not repeated in split cells.
For example, a list contains Product line, Product type, Quantity, and an image as
columns. The Product line column is grouped. The image produces merged cells in
Excel output because its size spans more than one row. When the report is run
with the option to ungroup repeating cells, Product line values are repeated, but
Product type and Quantity values are not.
Bookmarks
When you produce Excel 2007 output with ungrouped repeating cells, clicking an
entry in a table of contents brings you to the first row that contains that entry. For
Figure 3. Excel 2007 output of a crosstab with a table inserted in the crosstab corner
38 IBM Cognos Workspace Advanced Version 10.2.2: User Guide
example, a report contains a list with a table of contents. Product line values are
repeated in the list in Excel output. When you click Camping Equipment in the
table of contents, you are brought to the first cell in the list that contains Camping
Equipment.
Related tasks:
“Modify the report properties” on page 179
You can change the styles in the style sheet to make your entire report appear
differently.
Producing a Report in XML Format
XML report outputs save the report data in a format that conforms to an internal
schema, xmldata.xsd.
You can find this schema file in c10_location/bin.
This format consists of a dataset element, which contains a metadata element and a
data element. The metadata element contains the data item information in item
elements. The data element contains all the row and value elements.
You can create models from reports and other data that conform to the
xmldata.xsd schema. This is useful if you want to use a report as a data source for
another report, or if you use a database that cannot be read by IBM Cognos
Framework Manager. In this case, export the data from the data source to an XML
file, in conformance with the xmldata schema, and then open the XML file in
Framework Manager.
For more information, see the Framework Manager User Guide.
You cannot produce the following in XML format:
v maps
v charts that do not have at least one category or series
v reports that have more than one query defined in the report, unless the
additional queries are used for prompts
If a report contains more than one data container, such as a crosstab and a list,
and both containers use the same query, only the output for the list is produced.
If a report contains multiple lists, only the output for the first list is produced. If
a report contains multiple crosstabs and multiple lists, only the output for the
first list is produced.
Set PDF Page Options
Set PDF page options to control how report pages appear in PDF.
You can also set PDF page options in IBM Cognos Connection. For more
information, see the IBM Cognos Connection User Guide.
Note: You cannot set PDF page options when you have opened a widget from a
workspace in IBM Cognos Workspace to edit it in Cognos Workspace Advanced.
Procedure
Click File > PDF Page Setup, set the page options that you want, and then click
OK.
Chapter 3. Creating Reports 39

Naming report objects for workspaces in Cognos Workspace
Provide a name for list, crosstab, and chart report objects so that they can easily be
identified when added in a workspace in IBM Cognos Workspace.
When building a workspace in Cognos Workspace, business users can insert an
entire IBM Cognos Workspace Advanced report or only insert an individual list,
crosstab, or chart from a report.
By default, Cognos Workspace Advanced gives each list, crosstab, or chart in a
report a default name such as List 1, Crosstab1, Chart1, and so on. In Cognos
Workspace, these names appear in the Content tree. To help business users
recognize the report objects, rename them to something more meaningful.
Procedure
1. Select the list, crosstab, or report.
2. In the Properties pane, double-click the Name property.
3. Type a name that describes the report object.
Recommendation - Creating Financial Reports
When creating a statement-style or financial report, we recommend that you follow
these steps:
v Open the Financial report template.
This template offers a simple crosstab report, with a header and a footer that
includes the date, page number, and time. You can edit the content of the report
by adding and removing objects.
v Insert data to the rows.
A typical statement-style report includes accounts in the rows.
v Insert data to the columns.
A typical statement-style report includes a time dimension in the columns.
v Insert a measure.
v Insert calculations and format data.
v Add page layers or context filters to focus your report.
v Apply formatting.
You can add colors, lines, images, conditional formatting, blank rows or
columns, headings, and so on to improve the appearance of your report.
The IBM Cognos Business Intelligence Software Development Kit
When you create a report, you are creating a report specification. A report
specification is an XML file that you can view (Tools, Show Specification
). In
addition, you can view the specification for a selected object with the Show
Specification (Selection) menu option.
When you are viewing the report specification, you cannot modify or copy parts of
it.
You can also programmatically create or modify reports by using an editing tool to
work with report specifications. You then use the IBM Cognos Software
Development Kit to implement the reports in your IBM Cognos BI environment.
40 IBM Cognos Workspace Advanced Version 10.2.2: User Guide

This is useful if, for example, you must make the same modification in many
reports. Rather than opening each report and making the change, you can
automate the process using the Software Development Kit, thereby saving you
time. For more information about the IBM Cognos Software Development Kit,
contact your local sales office.
You can also modify the XML code in a report specification by saving the report
specification on your computer.
View Lineage Information for a Data Item
View lineage information of a data item to see what the item represents before you
add it to a report.
Lineage information traces the metadata of an item back through the package and
the data sources used by the package. Lineage also displays any data item filters
that were added by the report author or that were defined in the data model.
Viewing lineage information ensures that you add the correct data items to a
report. For example, you can view the lineage information of a model calculation
to see how it was created.
Note: Lineage is available only after your administrator has configured it. For
more information, see the IBM Cognos Business Intelligence Administration and
Security Guide. In addition, lineage is not supported in reports that are not linked
to packages.
You can use the lineage tool that comes with IBM Cognos Business Intelligence, or
you can use another lineage tool by specifying the URL to the tool in IBM Cognos
Administration. Note that if the URL source is secured, the source must be able to
prompt users for a password because IBM Cognos BI does not pass security
information. IBM Cognos BI also supports the IBM Metadata Workbench as a
lineage tool. For more information about configuring other lineage tools, see the
IBM Cognos Business Intelligence Administration and Security Guide.
You cannot use lineage information to troubleshoot queries. For example, lineage
information will not explain why a data item is double counted. Also, you cannot
view lineage information when running a report from a mobile device.
Before you begin
Before you can access lineage information for a report, your administrator must
configure lineage in IBM Cognos Administration. Also, the administrator must
enable the lineage capability and grant read permission for you on the report.
Note: The IBM Cognos BI lineage tool shows lineage on a report at its highest
level. The lineage does not change after you drill down on a report. Because the
selection context used to launch lineage can be affected by drill-down operations,
we recommend that you always launch lineage at the highest report level before
drilling down on the report. Otherwise, the lineage may not start properly.
Procedure
From the Source tab , right-click the data item and click Lineage.
Chapter 3. Creating Reports 41

Tip: You can view lineage information for multiple data items at the same time by
first Ctrl+clicking the items. The IBM Metadata Workbench does not support
viewing lineage for multiple data items at once.
Results
The lineage tool opens showing the lineage information of the selected data item.
The IBM Cognos Business Intelligence lineage tool
The IBM Cognos Business Intelligence lineage tool includes two views: the
business view and the technical view.
The business view displays high-level textual information that describes the data
item and the package from which it comes. This information is taken from IBM
Cognos Connection and the IBM Cognos Framework Manager model.
The technical view is a graphical representation of the lineage of the selected data
item. The lineage traces the data item from the package to the data sources used
by the package.
When you click an item, its properties appear below it. If you click an item in the
Package area, you see the model properties of the item. If you click an item in the
Data Sources area, you see the data source properties of the item.
You can also view lineage information in IBM Cognos Viewer after you run a
report. For example, you can click a cell in a crosstab to see how the cell value was
calculated. To view lineage information in IBM Cognos Viewer, right-click an item
in the report and then click Lineage. If you or an administrator runs a saved report
with the IBM Cognos BI lineage tool, both the business view and the technical
view are visible. Report consumers can see only the business view. In addition to
the Package and Data Sources areas, a Report area exists when looking at the
technical view.
Figure 4. The technical view in the IBM Cognos Business Intelligence lineage tool
42 IBM Cognos Workspace Advanced Version 10.2.2: User Guide

Chapter 4. Crosstabs
Use crosstab reports, also known as matrix reports, to show the relationships
between three or more query items. Crosstab reports show data in rows and
columns with information summarized at the intersection points.
For example, the following example crosstab report shows the gross profit and
revenue by product line for each year.
Working with Crosstab Reports
When you add data items to a crosstab, you create crosstab nodes and crosstab
node members. These objects allow you to easily create crosstabs, using
drag-and-drop operations.
Crosstabs are dimensional objects that have row edges and column edges. Each
edge is composed of a set of crosstab nodes. Each crosstab node contains the
following:
v One or more crosstab node members.
v Zero or one nested crosstab node, which contains one or more crosstab node
members or nested crosstab nodes.
Each crosstab node member refers to a data item that contains an expression that
defines the members that appear in the crosstab.
The following crosstab contains four crosstab nodes.
Figure 5. An example crosstab report
© Copyright IBM Corp. 2005, 2014 43

1 Crosstab node 1 contains a single node member for the total. This node refers
to the data item Total(Product line).
2 Crosstab node 2 contains a crosstab node member that refers to the data item
Product line. This member has a nested crosstab node containing a crosstab node
member that refers to the data item Product type.
3 Crosstab node 3 contains a single node member for the average. This node
refers to the data item Average(Product line).
4 Crosstab node 4 contains a crosstab node member that refers to the data item
Order year. This member has two nested crosstab nodes. The first node contains a
crosstab node member that refers to the data item Order month. The second node
contains a crosstab node member for the total. This node refers to the data item
Total(Order month).
Crosstab nodes can be placed anywhere in the crosstab. For example, in the
previous diagram, you can drag Order month under Average to create a row edge.
Create a Nested Crosstab
Nest data in a crosstab report to compare information by using more than one data
item in a column or row. For example, a report shows the number of sales by
product line for the past fiscal year. You decide to add a data item to further break
down the number of sales by quarter.
When nesting columns in a crosstab report, there are four distinct drop zones
where you can insert a new data item. The drop zone you choose will define the
relationship between the data item and the column.
The following relationships are created when you insert a data item as a row:
v Inserting a data item to the left or right of a column creates a parent-child
relationship between them.
When you insert a data item to the left of a column, the data item becomes a
parent to the column. When you insert a data item to the right of a column, the
data item becomes a child of the column.
v Inserting a data item above or below a column creates a union relationship
between them.
The following relationships are created when you insert a data item as a column:
v Inserting a data item to the left or right of a column creates a union relationship
between them.
Figure 6. An example crosstab report with four nodes
44 IBM Cognos Workspace Advanced Version 10.2.2: User Guide

v Inserting a data item above or below a column creates a parent-child
relationship between them.
When you insert a data item above a column, the data item becomes a parent to
the column. When you insert a data item below a column, the data item becomes a
child of the column.
For example, you have a crosstab with Product line as rows and Quantity and
Revenue as nested rows. For columns, you have Order method with Country or
Region as a nested column. In this crosstab,
v Product line is a parent to Quantity and Revenue.
v Quantity and Revenue are peers.
v Order method is a parent to Country or Region.
Procedure
1. From the Source tab , click the data item to add.
2. Drag the data item to the report as a nested column or nested row.
A black bar indicates where you can drop the data item.
3. Repeat steps 1 to 2 to add other nested columns or rows.
Tip: If you add more than one measure to a crosstab, all measures appear as
columns. You cannot have one measure appear as a row and another as a
column. To make all measures appear as rows, swap columns and rows.
Create a Single-Edge Crosstab
Create a single-edge crosstab report to show data in a list-like form. For example,
to show the quantity of products sold for each year and for each order method,
you could create a crosstab with Order Year and Order Method as rows and
Quantity as the measure.
Procedure
1. From the Toolbox tab , insert a crosstab object to the work area.
2. From the Source tab
, drag data items to the Rows or Columns drop zone.
A black bar indicates where you can drop the data item.
3. Repeat step 2 to insert additional data items:
v If you dragged the data item in step 2 to the Rows drop zone, drag the
additional items above or below the first item.
v If you dragged the data item in step 2 to the Columns drop zone, drag the
additional items to the left or right of the first item.
4. To add measures to the crosstab, drag the measures to the Measures drop zone.
Results
When you run the report, a crosstab is produced that has only one edge.
Chapter 4. Crosstabs 45

Creating headers automatically for sets in crosstabs
You can automatically add header labels on columns and rows when working with
sets in a crosstab that uses a dimensional data source. The headers help consumers
of the report to understand where the data is in the hierarchy.
Header labels are added only when you add new sets to your crosstab. The labels
are not added to existing sets. After you enable this option, it remains on until you
disable it, and applies to any new crosstabs that you create.
Procedure
1. From the Tools menu, click Options, then click the Report tab.
2. Select Automatically create crosstab headers for sets.
3. Click OK.
Results
Header labels are created in the rows and columns in a crosstab.
Showing crosstab values as percentages
When you work with dimensional data sources, you can show crosstab values as a
percentage of a summary instead of the actual values. When you show values as a
percentage, you can compare the contribution of an item to the whole.
About this task
You can show crosstab values as a percentage of a summary on the rows, the
columns, or the rows and columns. For example, a crosstab has Product line as
rows, Year as columns, and Revenue as the measure. You can show the following
crosstab values:
v The actual values of Revenue
v A percentage of a summary on Product line
v A percentage of a summary on Year
v A percentage of a summary on Product line, Year
By default, the summary type that is used to calculate the percentages is Automatic
summary.
When you show values as a percentage, a percentage measure data item is created.
You can also create a custom percentage calculation. For example, you can show
values as a percentage of an intersection (tuple). Or you can show values as a
percentage of a different summary type, such as Maximum.
When you show values as a percentage, the fact cells are formatted with the
percent data format. When you show the actual values, the fact cells are formatted
with the number format. If you modify the data format of the actual values, the
change is lost when you switch between showing the actual values and percentage
values.
If you limit the data in the crosstab to top or bottom values, the actual values are
used to filter the crosstab.
46 IBM Cognos Workspace Advanced Version 10.2.2: User Guide

You can show values as a percentage only in crosstabs. If you insert a chart, you
cannot fill the chart with data from a crosstab that shows values as a percentage. If
you create a chart from a crosstab that shows values as percentages, an empty
chart is created in the report.
Procedure
1. Select the measure for which you want to show values as a percentage.
If there is only one measure in the crosstab, click the crosstab corner.
2. From the Data menu, click Show Value As, and click the percentage values
that you want to show.
3. If you click Custom, provide the information that is required to calculate the
percentage values.
a. To change the default name of the percentage data item that you are
creating, type the new name in the Name field.
b. In the Percentage based on box, choose to build the percentage data item
based on a summary of sets in the crosstab or based on an intersection
(tuple).
c. If you choose to build the percentage data item based on a summary of sets,
in the Choose sets box, click the sets that you want to use. Then, click the
Summary type menu and select the summary that you want to use to
calculate the percentage values.
If there is more than one data item on the crosstab edge that you chose for
the sets, select which data item that you want to use.
d. If you choose to build the percentage data item based on an intersection
(tuple), click the ellipsis and select the items that you want to use to create
the intersection.
e. Click OK.
4. To edit a measure percentage data item, follow these steps.
a. Select the measure.
b. From the Data menu, click Show Value As > Edit.
c. Modify the information for the data item as described in step 3.
d. If you replaced a set in the crosstab with a different set, in the Choose sets
box, click Existing sets when you want to base the percentage values on the
set that you replaced.
Swap Columns and Rows
Swap columns and rows to look at information from a different perspective. This
may help you discover high and low points in the data that you hadn't previously
noted.
You can only swap columns and rows in a crosstab or chart. In a chart, you swap
the x- and y-axes.
Procedure
From the toolbar, click the swap rows and columns button .
Results
In the report, the rows become the columns and the columns become the rows.
Chapter 4. Crosstabs 47

Change a List into a Crosstab
Change a list into a crosstab to view your data from a different perspective.
Procedure
1. Click the columns to appear as columns or nested columns in the crosstab.
2. From the Structure menu, click Pivot List to Crosstab.
Results
The list becomes a crosstab with the columns you selected in step 2 appearing as
columns and nested columns. The unselected columns, except for measures, appear
as rows and nested rows. If you have one measure, it becomes the cells of the
crosstab. If you have more than one measure, they appear as columns.
Tip: To make all measures appear as rows, swap columns and rows.
48 IBM Cognos Workspace Advanced Version 10.2.2: User Guide
Chapter 5. Charts
You can use IBM Cognos Workspace Advanced to create many chart types, such as
column, bar, area, and line charts.
Tip: To view the available chart types, from the toolbar, click the insert chart
button
and click More. You can also view the available chart types by adding
a Chart object from the Toolbox tab
to an existing report.
Using Legacy Report Studio Charts
IBM Cognos Workspace Advanced includes a default chart technology that is
different than the legacy chart technology used in IBM Cognos Report Studio as of
version 10.1.0.
You can continue to work in Cognos Workspace Advanced with Cognos Report
Studio reports that use the legacy chart technology if you set the Use legacy chart
authoring option. You can also convert a legacy chart to a new default chart.
Related tasks:
“Convert Charts From One Type to Another” on page 68
This procedure applies to converting charts from one type (for example, a bar
chart) to another type (for example, a line chart). It also applies to converting
charts from the legacy Report Studio charts to the current default charts.
Creating Charts
Before creating charts, review the available chart types to select the best chart for
your needs. Also review the chart elements that make up charts.
Tip: To view the available chart types, click File > New, and then double-click the
chart icon
. You can also view the available chart types by adding a Chart
object from the Toolbox tab
to an existing report.
To create charts, drag data items from the Source tab
to the measures, data
series, and categories drop zones.
To help you when creating charts, you can do the following:
v Resize your charts.
v Move the chart drop zones into flyouts so that they appear only when you
pause your pointer over the chart.
After you create a basic chart, modify the various chart objects to customize your
chart.
© Copyright IBM Corp. 2005, 2014 49

Chart objects
Charts are composed of objects. Settings that you apply to objects in charts in IBM
Cognos Workspace Advanced affect how a chart appears when you run it and
view it in Cognos Viewer.
The following image shows a chart as it appears in Cognos Viewer.
The following image shows the same chart as it appears in the Cognos Workspace
Advanced user interface. The Y-axis title is selected.
Figure 7. A column chart with elements marked in Cognos Viewer.
50 IBM Cognos Workspace Advanced Version 10.2.2: User Guide

Data Series
A data series is a group of related data points that are plotted in a chart. Each
series has a unique color or pattern and is described in the legend. You can plot
one or more data series in a chart; pie charts have only one data series.
In the example chart, the data series are order years 2010, 2011, 2012, and 2013.
Categories
Categories are groups of related data from the data series that are plotted on the
X-axis. Categories of multiple data series are shown together using clustered and
stacked data markers.
In the example chart, the categories are the product lines of The Sample Outdoors
Company in clustered columns.
Axes
Axes are lines that provide references for measurement or comparison.
The primary axis (or Y-axis) refers to measures of quantitative data, such as sales
figures or quantities. Charts can have more than one primary axis.
The category axis (X-axis or ordinal axis) plots qualitative data, such as products or
regions. It runs horizontally, except in bar charts.
The z-axis is the vertical axis in a 3-D chart.
Major gridlines extend from the tick marks on an axis and run behind the data
markers.
Figure 8. An editable column chart with elements marked in Cognos Workspace Advanced
Chapter 5. Charts 51

Legend
A legend is a key to the patterns or colors assigned to the data series or categories
in a chart.
Columns, Lines, and Areas
Charts use graphical elements such as columns, horizontal bars, points, bubbles,
lines, and areas as visual representations of data points.
Chart types and chart configurations
To choose a chart type, consider what you want the chart to illustrate. Different
chart types and configurations emphasize different things.
Table 8. Types of charts and chart configurations and their purposes
Purpose Chart type or configuration
Show contributions of parts to a whole Bar Charts
Pie Charts
Stacked Charts, when you want to display
measures of the whole, as well as the parts
100 Percent Stacked Charts
Show trends in time or contrast values
across different categories
Line Charts
Area Charts
Bar Charts
Column Charts
Always place time in the horizontal axis.
Compare groups of related information
against actual values
Bar Charts
Radar Charts
Compare different kinds of quantitative
information
Combination Charts
Rank values in descending or ascending
order
Bar Charts
Column Charts
Show correlation between two sets of
measures
Point Charts
Show key performance indicators in an
executive dashboard
Gauge Charts
Bullet Charts
Chart Types
IBM Cognos Workspace Advanced includes a number of chart types, such as
column, bar, area, and line charts.
52 IBM Cognos Workspace Advanced Version 10.2.2: User Guide

Column Charts
Column charts use vertical data markers to compare individual values.
Column charts are useful for comparing discrete data or showing trends over time.
For example, the following example shows the revenue for each product line.
Column charts can plot data using standard, stacked, 100 percent stacked, and
three-dimensional configurations.
Line Charts
Line charts are useful for showing trends over time and comparing many data
series.
Line charts plot data at regular points connected by lines.
It is best not to use stacked line charts because they are difficult to distinguish
from unstacked line charts when there are multiple data series.
The following example shows a revenue trend that peaked in 2012 in every
territory.
Figure 9. An example column chart
Chapter 5. Charts 53

Line charts can plot data using standard, stacked, 100 percent stacked, and
three-dimensional configurations.
Pie Charts
Pie charts are useful for highlighting proportions.
They use segments of a circle to show the relationship of parts to the whole. To
highlight actual values, use another chart type, such as a stacked chart.
Pie charts plot a single data series. If you need to plot multiple data series, use a
100 percent stacked chart.
Reports in PDF or HTML format show a maximum of 16 pie or gauge charts. If
you need to see more, run the report in Microsoft Excel spreadsheet software
Single Sheet format and they all appear in the report.
The following example shows that the largest proportion of revenue comes from
the Americas, followed by the Asia Pacific region.
Figure 10. An example line chart
54 IBM Cognos Workspace Advanced Version 10.2.2: User Guide

Pie charts can plot data using standard, 100 percent, and three-dimensional
configurations.
Bar Charts
Bar charts are useful for showing trends over time and for plotting many data
series.
Bar charts use horizontal data markers to compare individual values.
The following example shows revenue for every country or region.
Figure 11. An example pie chart
Figure 12. An example bar chart
Chapter 5. Charts 55

Bar charts can plot data using standard, stacked, and 100 percent stacked
configurations.
Area Charts
Area charts are useful for emphasizing the magnitude of change over time. Stacked
area charts are also used to show the relationship of parts to the whole.
Area charts are like line charts, but the areas below the lines are filled with colors
or patterns.
Do not use standard area charts to show multiple data series because it is possible
for areas with lower values to be covered by others. For multiple data series, use a
stacked area chart.
The following example is a stacked area chart that shows the quantity of products
that were sold over a four-year period in multiple territories.
Area charts can plot data using standard, stacked, 100 percent stacked, and
three-dimensional configurations.
Point Charts
Point charts are useful for showing quantitative data in an uncluttered fashion.
Point charts use multiple points to plot data along an ordinal axis. A point chart
the same as a line chart without the lines. Only the data points are shown.
The following example shows the revenue for each product line.
Figure 13. An example area chart
56 IBM Cognos Workspace Advanced Version 10.2.2: User Guide

Combination Charts
Combination charts plot multiple data series by using combinations of columns,
areas, and lines within one chart. They are useful for highlighting relationships
between the various data series.
The following example shows a combination chart that includes planned revenue
as a line chart and actual revenue as a column chart.
Combination charts can plot data using standard, stacked, 100 percent stacked, and
three-dimensional configurations.
Figure 14. An example point chart
Figure 15. An example combination chart
Chapter 5. Charts 57
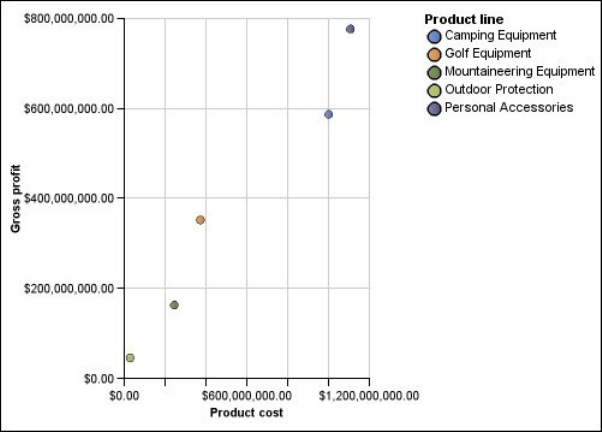
Scatter Charts
Scatter charts use data points to plot two measures anywhere along a scale, not
only at regular tick marks.
Scatter charts are useful for exploring correlations between different sets of data.
The following example shows the correlation between production cost and gross
profit for each product line.
Bubble Charts
Bubble charts, like scatter charts, use data points and bubbles to plot measures
anywhere along a scale. The size of the bubble represents a third measure.
Bubble charts are useful for representing financial data. These charts are not
supported for Microsoft Excel output.
The following example plots quantity and revenue by product line. The size of the
bubble represents gross profit.
Figure 16. An example scatter chart
58 IBM Cognos Workspace Advanced Version 10.2.2: User Guide

Bullet Charts
Bullet charts are a variation of bar charts. They compare a featured measure (the
bullet) to a targeted measure (the target). They also relate the compared measures
against colored regions in the background that provide additional qualitative
measurements, such as good, satisfactory, and poor.
Bullet charts are often used instead of gauge charts in executive dashboards. Bullet
charts can be horizontal or vertical.
Note: This chart type applies only to the current default charts, and does not
apply to the legacy charts.
The following figure is an example of a bullet chart.
A bullet chart contains the following components:
v A bullet measure.
The bullet measure, Revenue, appears as the blue bar in the example.
v A target measure.
The target measure, Planned revenue, appears as the black indicator in the
example.
v From zero to five colored regions along the numeric scale to provide information
about the featured measures' qualitative state.
Figure 17. An example bubble chart
Figure 18. An example bullet chart
Chapter 5. Charts 59

The example contains three colored regions, 0-50%, 50-75%, and 75-100%.
v A label that identifies the measures.
v A numeric scale.
Gauge Charts
Gauge charts, also known as dial charts or speedometer charts, use needles to
show information as a reading on a dial.
On a gauge chart, the value for each needle is read against the colored data range
or chart axis. This chart type is often used in executive dashboard reports to show
key business indicators.
Gauge charts are useful for comparing values between a small number of variables
either by using multiple needles on the same gauge or by using multiple gauges.
Reports in PDF or HTML format are limited to show a maximum of 16 pies or
gauges per chart. These charts are not supported for Microsoft Excel output.
A gauge chart consists of a gauge axis (which contains the data range, color
ranges, and intervals markers), needles, and a center pivot point. The following
example shows a basic gauge chart with default attributes. It is a degree dial chart
with two axes.
Pareto Charts
Pareto charts help you to improve processes by identifying the primary causes of
an event. They rank categories from the most frequent to the least frequent. These
charts are frequently used for quality control data, so that you can identify and
reduce the primary cause of problems.
Pareto charts include a cumulation line, which shows the percentage of the
accumulated total of all the columns or bars.
Figure 19. An example gauge chart
60 IBM Cognos Workspace Advanced Version 10.2.2: User Guide

You can create before and after comparisons of Pareto charts to show the impact of
corrective actions. These charts are not supported for Microsoft Excel output.
The following example shows that the most frequent reason for product returns is
unsatisfactory product.
You can also create Pareto charts using horizontal bars.
Progressive Column Charts
Progressive column charts, also knows as waterfall charts, are like stacked charts
with each segment of a single stack displaced vertically from the next segment.
Progressive column charts are useful for emphasizing the contribution of the
individual segments to the whole.
These charts are not supported for Microsoft Excel output.
The following example analyzes the contribution of each product line to revenue.
Figure 20. An example pareto chart
Chapter 5. Charts 61

Quadrant Charts
Quadrant charts are bubble charts with a background that is divided into four
equal sections. Quadrant charts are useful for plotting data that contains three
measures using an X-axis, a Y-axis, and a bubble size that represents the value of
the third measure.
You can also specify a default measure. For example, you might need to specify a
default measure to give context to a calculated measure in the chart.
Legacy quadrant charts use baselines to create the quadrants. Current default
charts use colored regions. You can change the size of the quadrants.
For more information about the legacy and current default chart technologies, see
“Using Legacy Report Studio Charts” on page 49.
Use a quadrant chart to present data that can be categorized into quadrants, such
as a SWOT (strengths, weaknesses, opportunities, and threats) analysis.
The following example shows the relationship between production cost and gross
profit. The size of the bubble represents quantity.
Figure 21. An example progressive column chart
62 IBM Cognos Workspace Advanced Version 10.2.2: User Guide

Marimekko Charts
Marimekko charts are 100 percent stacked charts in which the width of a column is
proportional to the total of the column's values. Individual segment height is a
percentage of the respective column total value.
The following example shows the contribution of revenues for product lines in
different regions.
Figure 22. An example quadrant chart
Figure 23. An example Marimekko chart
Chapter 5. Charts 63
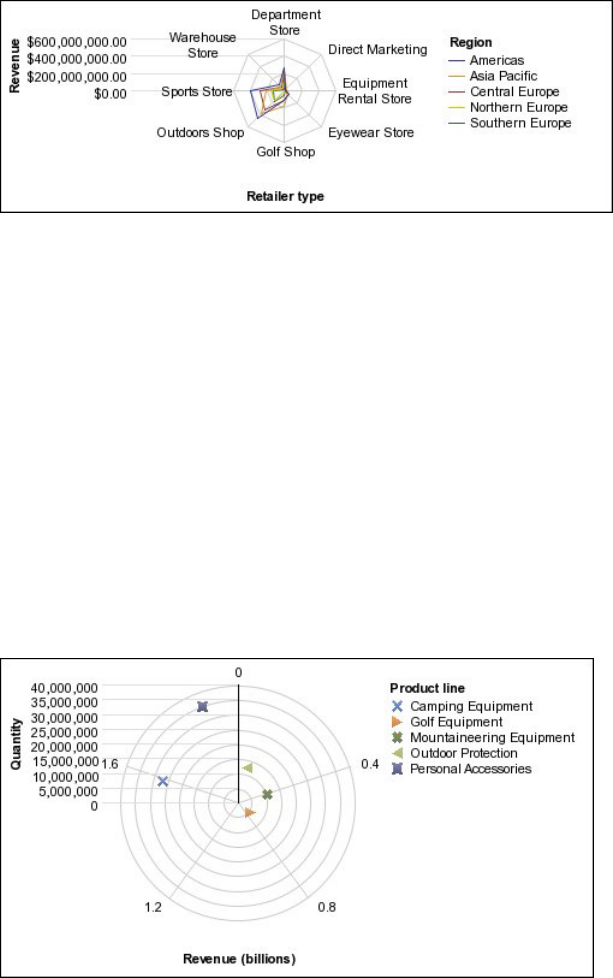
Radar Charts
Radar charts integrate multiple axes into a single radial figure. For each figure,
data is plotted along a separate axis that starts at the center of the chart.
The following example shows the revenue from multiple retailer types in multiple
territories.
Radar charts can plot data using standard and stacked configurations.
Polar Charts
Polar charts are circular charts that use values and angles to show information as
polar coordinates.
Polar charts are useful for showing scientific data.
You can specify a default measure. For example, you might need to specify a
default measure to give context to a calculated measure in the chart.
The following example shows the revenue and quantity for each product line. The
distance along the radial axis represents quantity, and the angle around the polar
axis represents revenue.
Figure 24. An example radar chart
Figure 25. An example polar chart
64 IBM Cognos Workspace Advanced Version 10.2.2: User Guide

Chart Configurations
Chart configurations specify the grouping type of the columns, bars, lines, and
areas in a chart. Some examples are standard, stacked, and 100 percent stacked
charts.
Standard Charts
Standard or absolute charts are useful for comparing specific values and for
representing discrete data, such as data for different regions or individual
employees. For example, a standard column chart that plots regional sales
emphasizes the actual value that each region achieves in sales.
Standard charts plot the actual value of each data series from a common axis.
When you create charts using multiple data series, you can distinguish each series
by the color or pattern of its data marker. Related data series are shown together in
clusters for easy comparison.
In standard area and radar charts that have multiple data series, the colored areas
that represent lower values might be covered by the larger colored areas that
represent higher values. Use the stacked configuration for area and radar charts
with multiple data series.
The following example shows the revenue values for each product line within each
territory.
Stacked Charts
Stacked charts are useful for comparing proportional contributions within a
category. They plot the relative value that each data series contributes to the total.
For example, a stacked column chart that plots product line sales will emphasize
the proportion that each product line contributes to the total in each territory.
You can distinguish each data series by the color or pattern of its section in the
stack. The top of each stack represents the accumulated totals for each category.
Figure 26. An example standard chart that compares specific values
Chapter 5. Charts 65

Do not use the stacked configuration in line charts that have multiple data series
because it is difficult to distinguish between unstacked and stacked configurations,
and your chart consumers might misunderstand your data.
The following example shows that camping equipment contributed a large
proportion of the actual revenue in most sales territories.
100 Percent Stacked Charts
100 percent stacked charts are useful for comparing proportional contributions
across all categories. They plot the relative contribution of each data series to the
total as a percentage. For example, a 100 percent stacked column chart that plots
product line sales emphasizes the percentage within each region without referring
to actual values.
You can distinguish each data series by the color or pattern of its section in the
stack. Each stack represents 100 percent.
100 percent stacked charts highlight proportions. When actual values are
important, use another chart configuration.
The following example shows the percentage of sales for each product line in each
region.
Figure 27. An example stacked chart
66 IBM Cognos Workspace Advanced Version 10.2.2: User Guide

Three-dimensional Charts
Three-dimensional charts provide a visually effective display that is suitable for
presentations.
Three-dimensional column, bar, line, and area charts plot data by using three axes.
Three-dimensional pie charts have a three-dimensional visual effect.
Do not use three-dimensional charts when you need to show exact values, such as
for control or monitoring purposes. The distortion in three-dimensional charts can
make them difficult to read accurately. For example, the following chart shows
actual revenue for each product line in each territory, but some data labels are
omitted because there is not enough room to display them all.
Figure 28. An example 100 percent stacked chart
Figure 29. An example three-dimensional chart
Chapter 5. Charts 67

Convert Charts From One Type to Another
This procedure applies to converting charts from one type (for example, a bar
chart) to another type (for example, a line chart). It also applies to converting
charts from the legacy Report Studio charts to the current default charts.
When you convert a chart to a new chart type, IBM Cognos Workspace Advanced
keeps the properties from the existing chart if they exist in the new chart type. For
example, if you convert a donut chart to a bar chart, Cognos Workspace Advanced
maps your chart palette to the new chart, but does not map the hole size, because
the hole size property does not exist in a bar chart.
Note: Cognos Workspace Advanced converts legacy charts to the current default
chart technology unless you select the Use legacy chart authoring option.
Procedure
1. Right-click a chart and click Convert Chart.
2. Select a new chart type, and click OK.
Related concepts:
“Using Legacy Report Studio Charts” on page 49
IBM Cognos Workspace Advanced includes a default chart technology that is
different than the legacy chart technology used in IBM Cognos Report Studio as of
version 10.1.0.
Customizing charts
After you create a chart, you can customize it by changing its properties.
For example, you might want to change how chart axes are displayed, add titles
and data labels, change the colors that are used, move or hide the legend, or add
more chart objects such as notes, trendlines, and baselines.
You can make these and many other changes by changing the default properties of
a chart or a chart object. Some properties depend on the existence of other
properties.
The following table shows some of the properties you can change in charts. These
properties are available when you select the chart object unless specified otherwise
in the "Action to perform" column.
Table 9. Ways to customize charts
Goal Action to perform
Hide or show the chart,
legend, or axes titles
Select the chart and in the Properties pane, click Title.
For more information, see “Add Titles to a Chart” on page 71.
Hide or show the legend Select the chart and in the Properties pane, click Legend.
For more information, see “Customize the Legend of a Chart”
on page 79.
68 IBM Cognos Workspace Advanced Version 10.2.2: User Guide

Table 9. Ways to customize charts (continued)
Goal Action to perform
Hide or show baselines Select the chart and in the Properties pane, click Numeric
baselines.
For more information, see “Adding a Baseline to a Chart” on
page 81.
Hide or show trendlines Select the chart and in the Properties pane, click Trendlines.
For more information, see “Display Trendlines in Current
Default Charts” on page 82.
Hide or show notes Select the chart and in the Properties pane, click Notes.
For more information, see “Adding a Note to a Chart” on
page 80.
Hide, show, or change the
axis line
Select the Primary Axis or Category Axis chart object. In the
Properties pane, click Axis line.
For more information, see “Change the Axis Scale of a Chart”
on page 78.
Add data labels, such as
values on bars, slices, and
columns
Select the chart and in the Properties pane, select the Axis
label check box.
For more information, see “Customizing the Axes in a Chart”
on page 77.
Hide or show an axis label Select the Primary Axis or Category Axis chart object. In the
Properties pane, select the Axis label check box.
For more information, see “Customizing the Axes in a Chart”
on page 77.
Change axis properties,
such as range and scale
interval
Select the axis and in the Properties pane, click Axis range.
For more information, see “Change the Axis Scale of a Chart”
on page 78.
Hide or show the border
around a chart or chart
object
Select the chart or chart object and from the toolbar, click the
Background Effects Presets icon
.
For more information, see “Add Background Effects to a Chart
Object” on page 75.
Hide or show the tooltips
in a chart
Select the chart and in the Properties pane, click Tooltips and
select an option.
When you pause your pointer over a data marker in the report
output, the corresponding absolute or cumulative value
appears in a tooltip.
Tooltips are not supported in PDF output.
Chapter 5. Charts 69
Table 9. Ways to customize charts (continued)
Goal Action to perform
Change the white space
around the chart
Select the chart and in the Properties pane, click Padding.
For more information, see “Apply Padding to an Object” on
page 168.
Change the chart
orientation
In the Properties pane, under Chart Orientation, select
Vertical or Horizontal.
Apply a preset palette to a
chart or chart object
Select the chart or chart object and from the toolbar, click the
Chart Palette Presets icon
.
For more information, see “Customizing the Color Palette of a
Chart” on page 71.
Apply a conditional
palette to a chart or chart
object
Select the chart and in the Properties pane, click Conditional
palette.
For more information, see “Highlighting data in a chart by
creating a conditional palette” on page 74.
Change the default color
or font for all chart objects
Select the chart and in the Properties pane, click Foreground
color and Font.
Change the
three-dimensional
appearance of a chart
Select the chart and in the Properties pane, click Depth.
Insert a background
image, background
gradient, or watermark in
the chart object
Select the chart or chart object and from the toolbar, click the
Background Effects Presets icon
.
For more information, see “Add Background Effects to a Chart
Object” on page 75.
Enable drilling up and
down in a chart, when
you are working with
dimensional data sources
From the Data menu, click Drill Options.
Drill up and down to view more general or more detailed
information on your data within a predefined dimensional
hierarchy.
For more information, see “Create a Drill-up and Drill-down
Report” on page 157.
Procedure
1. Select the chart object.
2. To change specific chart objects, such as a title or axis, select the object itself
from the Select a chart object menu below the chart.
3. In the Properties pane, set the property value.
An ellipsis (...) button indicates that a dialog box provides further options.
Note: You might have to scroll to see all the properties.
70 IBM Cognos Workspace Advanced Version 10.2.2: User Guide

Resizing a chart
You can change the size of a chart by dragging the resize handle in the lower-right
corner of the chart.
Procedure
1. Select the chart object.
2. Click the resize handle in the lower right corner of the chart
and drag it to
the wanted size.
Press Shift and drag to maintain the aspect ratio of the chart.
Tip: To cancel the resizing of the chart, press the Esc key.
Add Titles to a Chart
You can add or change the titles for the chart, legend, and axes.
You can add text titles that are descriptive, such as Revenue by product line in
2005. You can use data items as titles. For example, if you have several charts
showing revenue by product line for each year, you can drag the year data item to
the chart title for each chart.
Procedure
1. To add a chart title, do the following:
a. Select the chart object.
b. In the Properties pane, click Title, and type a chart title.
c. To add a data item in the chart title, change to the Page Design view and
drag a data item to the report title area on the chart.
2. To add a legend title, do the following:
a. Select the legend chart object.
b. In the Properties pane, click Legend title and specify the title.The default
title is the name of the data item.
c. To add a data item in the legend title, change to the Page Design view and
drag a data item to the legend title area on the chart.
Note: If you add a data item to your legend title, when you are in Page
Preview view, you cannot edit the data item. To edit the chart title, you
must switch to the Page Design view.
3. To add an axis title, do the following:
a. Select the axis chart object.
b. In the Properties pane, click Axis title and specify the title.The default title
is the name of the data item.
c. To add a data item as an axis title, change to the Page Design view and
drag a data item to the axis title area on the chart.
Customizing the Color Palette of a Chart
You can use the chart palette to control the colors or patterns used in the columns,
lines, data markers, or areas in a chart.
For example, if "Telephone" is the first in a data series of order methods, and you
want it to appear in blue, use the palette to make the first item in the series blue.
Chapter 5. Charts 71

You can also apply background effects to chart objects or change the colors of
specific objects.
If specified, the default color is used for outputs that do not support the palette
definition. For example, if the palette is defined to use a radial rectangle gradient
and you run the report as PDF output, the default color is used because radial
rectangle gradients are not supported in PDF output.
Note: Progressive charts have a separate set of steps.
Procedure
1. Select the chart object. For combination charts, select the bar, line, or area
objects.
2. To choose a preset color palette, on the style toolbar, click the chart palette
presets button
, and then click a palette.
3. To change the existing color palette, do the following:
a. In the Properties pane, click Palette.
b. On the Entries tab, click the palette entry that you want to change.
c. Under Fill, select fill type, color, transparency, and other fill settings. The
options in the Fill type list depend on the chart type you are using.
Linear Gradient displays a gradient that changes color horizontally. You can
specify the position of each color in the gradient and add or remove colors
from the gradient.
Radial Line Gradient displays a gradient that changes color outwards from
a central point, or focus. You can specify the position of each color in the
gradient and the size and position of the focus. You can also add or remove
colors from the gradient.
Radial Rectangle Gradient displays a gradient that changes color outwards
from a rectangle. You can specify the position of each color in the gradient
and the size of the rectangle. You can also add or remove colors from the
gradient.
Pattern displays a colored pattern that you choose from a preset list. You
can specify the foreground and background colors.
Color displays a solid color. You can specify the transparency.
Image displays an image. You can specify the image to use.
4. Under Style, depending on the chart type you are customizing and the fill type
you chose in step 2, you can change the marker shape, line style, default color,
and line weight.
5. To add a new palette entry, click the new button
and specify the new
palette settings.
6. To customize the data markers, on the Properties tab, depending on the chart
type you are customizing and the fill type you chose in step 2, you can specify
whether data markers are shown and change their color and size.
7. To change the order in which the colors, gradients, or patterns appear in the
chart, use the arrow buttons under the Palette box to change their position.
8. To copy and paste a palette in the Microsoft Internet Explorer Web browser,
click the copy button
to copy the palette definition to the clipboard.
72 IBM Cognos Workspace Advanced Version 10.2.2: User Guide
Close the palette dialog box. Select another chart, open the palette dialog box,
and click the paste button
to paste the palette definition from the
clipboard.
Customizing the Color Palette of a Progressive Chart
You can use the chart palette to control the colors or patterns used in the columns,
lines, data markers, or areas in a chart.
For example, if "Telephone" is the first in a data series of order methods, and you
want it to appear in blue, use the palette to make the first item in the series blue.
You can also apply background effects to chart objects or change the colors of
specific objects.
If specified, the default color is used for outputs that do not support the palette
definition. For example, if the palette is defined to use a radial rectangle gradient
and you run the report as PDF output, the default color is used because radial
rectangle gradients are not supported in PDF output.
Procedure
1. Select the progressive chart object.
2. To choose a preset color palette, click the chart palette presets button
on
the style toolbar, and then click a palette.
3. In the Properties pane, click Progressive palette.
You can specify the following:
v Positive value fill defines the appearance of the positive bars or columns on
the chart.
v Negative value fill defines the appearance of the negative bars or columns
on the chart.
v First value fill defines the appearance of the first bar or column on the chart.
v Total value fill defines the appearance of the total bar or column on the
chart, if a total bar or column is present.
4. To change the appearance of a fill, do the following:
a. Click the colored box beside the fill name.
b. Click a fill type from the Fill type list.
Linear Gradient displays a gradient that changes color horizontally. You can
specify the position of each color in the gradient and add or remove colors
from the gradient.
Radial Line Gradient displays a gradient that changes color outwards from
a central point, or focus. You can specify the position of each color in the
gradient and the size and position of the focus. You can also add or remove
colors from the gradient.
Radial Rectangle Gradient displays a gradient that changes color outwards
from a rectangle. You can specify the position of each color in the gradient
and the size of the rectangle. You can also add or remove colors from the
gradient.
Pattern displays a colored pattern that you choose from a preset list. You
can specify the foreground and background colors.
Color displays a solid color. You can specify the transparency.
Chapter 5. Charts 73

Image displays an image. You can specify the image to use.
c. To change the color of this fill, click the color in the Colors list, click Color,
specify the color properties, and click OK.
5. To change the text of the label that appears next to a bar, double-click the text
box beside the fill name and specify the text.
Highlighting data in a chart by creating a conditional palette
You can create a conditional palette to highlight data items that meet conditions
that you specify.
You can use conditions to highlight exceptional data and to control the layout of
your chart.
For example, you want to highlight columns in a chart that show revenue greater
than $1,000,000. You can create a conditional palette that causes columns that meet
the criteria to be colored green. The conditional palette overrides the default
palette that your chart uses.
Procedure
1. Right-click the chart object to which you want to apply a conditional palette
and click Conditional palette.
2. Click the New Conditional Palette Entry icon
, and then click New
Condition.
3. If you want to create a conditional palette that is based on a string data item,
do the following steps:
a. Select the string data item to determine the condition and click OK.
b. Click the New String Condition icon
, and then define the condition:
v To select more than one individual value, click Select Multiple Values
and click the values.
v To type specific values, click Enter Values and type the values.
v To specify your own criteria, such as values that begin with the letter A,
click Enter String Criteria, and then specify the condition.
c. In the Conditional Palette - String dialog box, in the Palette Entry column,
click the Edit Palette Entry icon
that corresponds to the new condition.
d. Define the palette entry fill type, colors, and angle, and click OK.
4. If you want to create a conditional palette that is based on a numeric data item,
do the following steps:
a. Select the numeric data item to determine the condition and click OK.
b. In the Conditional Palette - Numeric dialog box, click the New Value icon
and type a value to define a threshold. The value appears in the
Range column, and two ranges are created.
c. For each range, in the Style column, click the Edit Palette Entry icon
to define the palette entry fill type, colors, and angle, and then click OK.
d. Repeat the previous steps to add other conditions.
74 IBM Cognos Workspace Advanced Version 10.2.2: User Guide

Tip: Pause the pointer over each range bracket to see the condition that
is produced for that range.
e. To move a value above or below a threshold, click the Move value above
threshold icon
corresponding to the value. For example, you insert a
threshold value of 1,000,000. By default, the ranges are less than or equal to
1,000,000 and greater than 1,000,000. Moving the 1,000,000 value above the
threshold changes the ranges to less than 1,000,000 and greater than or
equal to 1,000,000.
5. To customize the label for a conditional palette, do the following steps:
a. Click the Label button corresponding to the palette entry.
b. In the Conditional Palette Entry Label dialog box, click Specified text, and
click the ellipsis (...) icon.
c. Type the default label text in the Label text box.
d. To add customized labels for other languages, click the Add icon
,
select the other languages, and click the language to define the customized
label for that language.
6. Specify the order in which to evaluate the conditions by clicking a condition
and then clicking the Move up or Move down arrow icons. Conditions are
evaluated from top to bottom, and the first condition that is met is applied.
Add Background Effects to a Chart Object
You can change the look of certain charts and chart objects by applying visual
effects such as drop shadows, borders, fills, texture effects, and bevel effects.
Procedure
1. Select the chart object.
2. To apply a preset background fill effect, from the toolbar, click the background
effects presets
button.
3. To add a custom fill effect and border, do the following:
v In the Properties pane, click Background effects.
v Click Border and specify settings for border style, width, color, corner radius
for rounded rectangles, and transparency.
If the chart object also includes a fill with a transparency setting, select the
Allow transparent bleed check box to apply the same transparency to the
border.
v Click Fill and specify the settings.
The fill effect can either be a solid color, a gradient, or a pattern. You can
define a gradient fill effect as a linear, radial line, or radial rectangle gradient.
4. To add a texture effect, in the Properties pane, under Material effects, click an
effect.
5. To add a drop shadow, do the following:
v In the Properties pane, click Drop Shadow.
v Select the Drop shadow check box.
v From the Shadow color list, click a color.
v Under Blur, click an intensity to set the drop shadow's blur.
Chapter 5. Charts 75

v Under Offset, enter a value and a unit to define the width and height of the
drop shadow.
v Under Transparency, type a percentage to determine the transparency of the
shadow.
6. To add a bevel, in the Properties pane, under Bevel, click a bevel effect.
Related tasks:
“Add Color to an Object” on page 160
You can add background and foreground color to objects in the report.
Add Colored Regions to a Chart
You can define colored regions in the body of a chart.
For example, you can divide the background of a scatter chart into quadrants and
color each quadrant.
You can add colored regions to bubble, bullet, combination, Pareto, progressive
column, and scatter charts.
In bullet charts, colored regions are automatically added.
You can use the following criteria to position the colored regions.
Option Position
Percent on Axis (%) Uses a percentage of the full range of the
axis.
For example, if the axis range is -500 to 1100,
a Percent on Axis value of 25% puts the
baseline at -100 (25% of the range, 1600).
Numeric Value Uses a static numeric value.
Mean Uses the statistical mean plus or minus a
number of standard deviations based on all
charted data values on the specified axis.
Percentile (%) Uses a specified percentile.
Statistical Maximum Uses the following expression:
75th percentile value +1.5*(75th percentile
value - 25th percentile value)
For example, if 2.5 is the 25th percentile and
7.5 is the 75th percentile, the statistical
maximum is 15 [7.5 +1.5(5) = 15].
Statistical Minimum Uses the following expression:
25th percentile value -1.5*(75th percentile
value - 25th percentile value)
For example, if 2.5 is the 25th percentile and
7.5 is the 75th percentile, the statistical
minimum is -5 [2.5 -1.5(5) = -5].
76 IBM Cognos Workspace Advanced Version 10.2.2: User Guide

Option Position
Query Calculation Uses a query calculation from the same
query or from a different query. For more
information, see “Inserting a Query
Calculation” on page 108.
Layout Calculation Uses a layout calculation.
Category Index Specifies a position based on the index value
of the data item in the categories axis. The
value must be between 0 and 100.
For example, a Category index value of 1
indicates that the position is located at the
first data item. This is the default.
You can also combine colored regions with gridlines.
Note: This procedure applies only to the current default charts, and does not
apply to the legacy charts.
Procedure
1. Select the chart object.
2. In the Properties pane, click Colored regions.
3. Click the new button
.
4. Under Region label, type a name for the region.
5. Under Label location, specify whether the label should appear in the legend
or in the chart.
6. If your chart includes multiple charts, such as in a combination chart, under
Based on, select the data item for which you want to specify a colored region.
7. Under Region fill, click the color box to specify the color and fill effects.
8. Specify each of the top, bottom, left, and right positions.
9. If you want to add more colored regions, repeat steps 3 to 8.
10. If you add more than one colored region, specify their order using the up and
down arrows.
The regions are drawn in the same order that they appear in this list. The first
region is drawn first, on the bottom, and the last region is drawn on top of
the other regions.
Tip: To delete a colored region, click the colored region icon and text and click
the delete button
.
Results
The new region appears in the Colored regions box.
Customizing the Axes in a Chart
Chart axes are lines that border the chart area and provide a reference for
measurements. They act as a vehicle for tick marks and scales and form a frame
Chapter 5. Charts 77
around the chart. The Y-axis is usually the vertical axis and contains data. The
X-axis is usually the horizontal axis and contains categories.
To make your chart data easier to understand, you can do the following to
customize each axis:
v customize the title for the axis
v show or hide the axis labels (data values)
v show or hide the axis line
v change the color, style, and weight of the axis line
v show or hide major and minor tick marks and specify where to display them
Procedure
1. Select the axis chart object.
2. To show or hide the axis labels, in the Properties pane, select or clear the Axis
label check box.
3. To show or hide axis lines, in the Properties pane, click Axis lines, and select
or clear the Axis line check box.
4. To change the color, style, and weight of the axis line, in the Properties pane,
click Axis lines.
5. To show or hide minor and major tick marks and specify their location, in the
Properties pane, click Axis lines.
Change the Axis Scale of a Chart
By default, IBM Cognos Workspace Advanced automatically determines the
minimum and maximum scale values for the axes in a chart.
For example, a Y-axis showing revenue values might have an axis range of zero
dollars to one million dollars. You can customize the axis scale, or range, to make
your chart easier to understand. You can specify the following for each axis:
v the maximum and minimum values of the range
v how often major and minor gridlines appear
Procedure
1. Select the axis chart object.
2. In the Properties pane, click Axis range.
3. To set a maximum value for this axis, under Maximum, click Manual, and then
type a maximum value in the Manual box.
Note: You can use either a positive or negative value as the maximum value.
4. To set a minimum value for this axis, under Minimum, click Manual, and then
type a minimum value in the Manual box.
Note: You can use either a positive or negative value as the minimum value.
5. To set the position of major gridlines and tick marks, under Major interval,
click Manual, and then type the distance between major gridlines and tick
marks in the Manual box.
The distance between major gridlines and tick marks is measured in the units
of that axis. For example, if the axis is revenue in dollars, type the dollar value
in the Manual box.
6. To add minor gridlines, type the number of minor gridlines that you want to
see between each major gridline in the Number of minor intervals box.
78 IBM Cognos Workspace Advanced Version 10.2.2: User Guide
Show Gridlines in a Chart
To make the data in a chart that includes axes easier to read, you can show
horizontal and vertical gridlines. You can show gridlines for the major or minor
intervals on the axes.
You can also show alternating bands of color in the chart background that
correspond to your axis gridlines.
You cannot show gridlines for chart types that do not display axes, such as pie and
donut charts.
Procedure
1. Select the axis chart object.
2. To show alternating bands of color as your chart background, do the following:
v In the Properties pane, click Gridlines.
v Select the Show alternating color bands check box.
v Set the color and transparency of the first and second colors.
3. To show major gridlines as your chart background, do the following:
v In the Properties pane, click Gridlines.
v Select the Show major gridlines check box.
v Set the color, style, and weight of the major gridlines.
v If you are working with a gauge chart, specify the length of the gridline.
4. To show minor gridlines as your chart background, do the following:
v In the Properties pane, click Minor gridlines.
v Select the Show minor gridlines check box.
v Set the color, style, and weight of the minor gridlines.
v If you are working with a gauge chart, specify the length of the gridline.
Customize the Legend of a Chart
You can customize the legend and its elements, including its title, position, and
items.
You can hide or show the legend and change its position relative to the chart
object, chart area, or using a specific report expression. For example, in a bar chart
showing revenue for each product line by country or region, you could use the
expression [Country or Region] = 'Canada' to position the legend relative to the
Canada bar.
You can change the title that appears above the legend.
If your legend includes items that are too long, you can truncate long legend items
at a specific number of characters.
For example, if you want an ellipsis (...) to appear at the end of each truncated
legend item, type ... in the Truncation text box.
Procedure
1. Select the chart object.
2. In the Properties pane, click Legend.
3. To show the legend on the chart, select the Show legend check box.
Chapter 5. Charts 79

4. To choose a preset legend position, click Preset and click a position from the
diagram.
Note: When you choose a preset legend position, that position appears inside
any padding that you have added to the chart object. Customized legend
positions do not include any chart padding.
5. To choose a customized legend position, do the following:
v Click Advanced and click the ellipsis (...) button.
v To display the legend at a set distance from the sides of the chart area, from
the Anchor list, click Relative to Chart.
v To display the legend at a set distance from the sides of the chart body, from
the Anchor list, click Relative to Chart Body.
v To display the legend at a set distance from a report expression, from the
Anchor list, click Report Expression, click the ellipsis (...) button beside
Expression, and enter an expression in the Report Expression dialog box.
v Set the horizontal and vertical distances from the anchor.
6. To change the text that appears as the legend title, select the legend object, and
in the Properties pane, click Legend title and specify the title.
7. To truncate the items in the legend, do the following:
v Select the legend object.
v In the Properties pane, click Text truncation.
v To specify the number of characters at which the legend items are truncated,
click Manual and type the number of characters in the Maximum characters
box.
v To shrink the font of the legend item text until all the text fits in the legend,
select the Shrink font as needed check box.
v To specify some text to appear at the end of truncated legend items, type the
text in the Truncation text box.
Adding a Note to a Chart
Add a note to a chart to provide additional detail. Notes appear as text in a chart.
By default, notes are aligned with the upper left corner of the chart object. You can
change the position of a note relative to the chart object, or chart area, or by using
a report expression. For example, in a bar chart showing revenue for each product
line by country or region, you could type [Country or Region] = 'Canada' to
position the note relative to the Canada bar.
Notes overwrite whatever is under them so you must position them properly.
If you apply more than one note, ensure that each note has a different position in
the report so that they do not overwrite each other. You can also specify the order
that they should be drawn in when the report runs. If you have two notes with the
same coordinates, the first one in the list is drawn first and the next one is drawn
on top of the first.
Procedure
1. Click the chart object.
2. In the Properties pane, click Notes.
3. Click the new button
.
80 IBM Cognos Workspace Advanced Version 10.2.2: User Guide

4. Type the note text in the Text box and click OK.
5. To position the note, do the following:
v Select the note object
in the chart.
v In the Properties pane, click Position.
v To align the note horizontally, click the left, center, or right alignment button.
v To align the note vertically, click the top, middle, or bottom alignment
button.
v To set the margins around the chart body, type the desired margin values,
and choose margin units.
v To display the note at a set distance from the sides of the chart area, from the
Anchor list, click Relative to Chart.
v To display the note at a set distance from the sides of the chart body, from
the Anchor list, click Relative to Chart Body.
v To display the note at a set distance from a report expression, from the
Anchor list, click Report Expression, click the ellipsis (...) button beside
Expression, and enter an expression in the Report Expression dialog box.
6. To edit the text, double-click the text next to the note object
in the chart.
If the note contains non-text items, such as calculations or measures, you must
first switch to the Page Design view (View, Page Design).
Adding a Baseline to a Chart
Baselines are horizontal or vertical lines that cut through the chart to indicate
major divisions in the data.
For example, you can add a baseline to show a sales quota or break-even point.
Each baseline represents a value on an axis.
Depending on the type of chart, you can use the following options to position the
baseline.
Option Description
Numeric Value Uses a static numeric value.
Mean Uses the statistical mean plus or minus a
number of standard deviations based on all
charted data values on the specified axis.
Percentile (%) Uses a specified percentile.
Percent on Axis (%) Uses a percentage of the full range of the
axis.
For example, if the axis range is -500 to 1100,
a Percent along axis (%) value of 25 puts
the baseline at -100 (25% of the range, 1600).
If you apply more than one baseline, you can specify in which order they should
be drawn when the report runs. They are drawn from top to bottom. If you have
two baselines with the same coordinates, the first one in the list is drawn first and
the next one is drawn on top of the first one.
By default, the baseline and its label appear in the legend.
Chapter 5. Charts 81

Baselines do not support color transparency.
Procedure
1. Select the chart object.
2. Depending on your chart and the type of baseline you want to add, in the
Properties pane, click Numeric baselines or Category baselines.
3. Click the new button
and choose the type of baseline from the list.
4. Specify the necessary criteria for the baseline position.
5. Under Baseline Properties, type a label for the baseline and specify the line
style.
Tip: To remove the baseline from the legend, delete the label.
6. If you add more than one baseline, specify their order using the up and down
arrows.
Tip: To delete a baseline, click the delete button
.
7. To edit a baseline, select the baseline in the chart, and in the Properties pane,
edit the properties.
Display Trendlines in Current Default Charts
Trendlines, also known as lines of best fit or regression lines, graphically illustrate
trends in data series and are commonly used when charting predictions. A
trendline is typically a line or curve that connects or passes through two or more
points in the series, displaying a trend.
You can display trendlines in the current default bar, line, area, bubble, and scatter
charts.
You can specify the following types of trendlines:
v Linear
Use a linear trendline when your data values increase or decrease along a
straight line at a constant rate. For example, if your chart displays a steady
increase in revenue by product line over time, a linear trendline might be
appropriate.
v Polynomial
Use a polynomial trendline when your data values both increase and decrease.
For example, if your chart displays both increases and decreases in revenue by
product line over time, a polynomial fit trendline might be appropriate.
v Logarithm
Use a logarithmic trendline when your data values increase or decrease rapidly
and then levels out. For example, if your chart displays a rapid decrease in
revenue by product line over time and then a plateau, a logarithmic trendline
might be appropriate.
v Moving Average
Use a moving average trendline when your data values fluctuate and you want
to smooth out the exceptions to see trends. For example, if your chart displays
large fluctuations in revenue by product line over time, but you know that some
data points are exceptions, a moving average trendline might be appropriate.
If you are not sure which trendline type to use, try each type to see which one best
fits most of your data points. For example, a linear trendline will not fit most
points on a scatter chart with widely spread data points.
82 IBM Cognos Workspace Advanced Version 10.2.2: User Guide

Trendlines do not support color transparency.
Procedure
1. Select the chart object.
2. In the Properties pane, click Trendlines.
3. Click the new button
and click a trendline type.
4. Define the trendline by specifying the following options.
The options that are available depend on the type of trendline you chose.
v To set the order, or degree, of a polynomial trendline, in the Order box, type
a value between 2 and 6.
v To set the number of prior periods to include when calculating the moving
average trendline, type a value in the Periods box.
v If you have more than one series on your chart, in the Based on list, click the
data you want to use for the trendline.
v To customize the style of this trendline, click Line Styles and customize the
line color, weight, style, and transparency.
v To customize the trendline label in the legend, click Label and choose None,
Automatic,orCustom.
v To display the trendline equation, click Show equation.
v To display the R-squared value of the trendline, click Show R-squared value.
Showing data values in bar, column, line, and area charts
You can show the data labels or data values within the chart so that the data
values are more clear.
For example, you can display the data values above each column in a column
chart to show the exact height of each column.
Procedure
1. In the chart, under Series, select the chart type icon.
2. In the Properties pane, double-click the Show values property.
3. To specify the data label format, in the Values list, select what values to
display.
v None does not display data values.
v Values displays the non-cumulative value of the data.
v Cumulative values displays the cumulative value of the data.
4. To show lines pointing from data labels to the data marker they apply to, select
the Show leader lines check box.
5. To specify where values and labels are to be rendered in the chart, click the
Value Location list and choose the location that you want.
6. To specify how to display the labels if their positions on the chart overlap, in
the Collision Mode list, click one of the following modes:
v None specifies that labels appear in default positions and might overlap.
v Normal (for pie and donut charts) specifies that labels are placed just above
their corresponding data markers or chart objects. There is no collision
detection, so labels can overlap.
v Coarse Stagger specifies that labels are placed close to their data markers
and staggered so that they do not overlap. This collision mode takes less
Chapter 5. Charts 83
time to render than Fine Stagger but might result in labels being farther
away from their corresponding data markers.
v Fine Stagger specifies that labels are staggered so that they do not overlap.
The labels are as close to the data markers as possible without overlapping.
This collision mode takes more time to render than Coarse Stagger but might
result in labels being closer to their corresponding data markers.
Showing data values in pie and donut charts
You can show the data labels or data values within the chart so that the data
values are more clear.
For example, in a pie chart, show the data values within each pie slice, so that you
know the exact size of each pie slice.
Procedure
1. Select the chart.
2. In the Properties pane, double-click the Show values property.
3. To display data labels for each slice of the pie, under Show, select the Slice
names check box.
4. To show lines pointing from data labels to the slices they apply to, select the
Show leader lines check box.
5. To specify the data label format, in the Values list, select what values to
display.
v Hide does not display data values.
v Absolute displays the absolute value of the data.
v Percentage displays the slice's percentage of the whole pie.
v Absolute and Percentage displays the slice's percentage of the whole pie as
an absolute value.
6. In the Position list, select the placement of data labels.
Showing data values in other charts
You can show the data labels or data values within the chart so that the data
values are more clear.
For example, you can display the data values above each bubble in a bubble chart
to show the exact value of each bubble.
You can show data values for the following chart types: Pareto, progressive, scatter,
and bubble.
Procedure
1. Select the chart.
2. In the Properties pane, double-click the Show values property.
3. For each of the categories, series, and measures, select whether to show only
values, values and labels, or neither.
4. To show lines pointing from data labels to the data marker they apply to, select
the Show leader lines check box.
5. To specify how to display the labels if their positions on the chart overlap, in
the Collision Mode list, click one of the following modes:
v None specifies that labels appear in default positions and might overlap.
84 IBM Cognos Workspace Advanced Version 10.2.2: User Guide
v Normal (for pie and donut charts) specifies that labels are placed just above
their corresponding data markers or chart objects. There is no collision
detection, so labels can overlap.
v Coarse Stagger specifies that labels are placed close to their data markers
and staggered so that they do not overlap. This collision mode takes less
time to render than Fine Stagger but might result in labels being farther
away from their corresponding data markers.
v Fine Stagger specifies that labels are staggered so that they do not overlap.
The labels are as close to the data markers as possible without overlapping.
This collision mode takes more time to render than Coarse Stagger but might
result in labels being closer to their corresponding data markers.
Customizing Lines and Data Points in a Line Chart
You can customize the lines in a line chart to show only lines, only data points, or
both.
Data points represent series values for each category on the Y-axis. You can show
special data markers that represent statistically significant values, such as open,
high, low, and close values.
You can also change the shape of the line that connects the data points to one of
the following:
v Point to Point shows data points connected by straight lines.
v Step at Point shows data points connected by steps that start and end at the
data points.
v Step Between Points shows data points connected by steps that start and end
between the data points.
v Smooth shows data points connected by smooth curves.
You cannot show data points if the configuration of the line chart (Series type)is
set to Stacked or Stacked 100%.
Procedure
1. Select the line object.
2. To select whether to show only the line, the line and data points, or only the
data points, in the Properties pane, under General, select an option in the Line
display type list.
3. To show special data markers, click Value markers. Select the check box for the
special data markers that you want to add and for each marker, specify the
color and shape.
The options you specify in Value markers overwrite the options for Line
display type.
4. To change the shape of the line that connects data points, select an option from
the Line shape list.
5. To change the color of the lines or data points, click Palette.
For more information, see “Customizing the Color Palette of a Chart” on page
71.
Create a Matrix of Charts
You can view a complex chart that includes nested series or categories into a
matrix, or crosstab, that shows multiple small charts arranged in rows and
columns.
Chapter 5. Charts 85

The charts in the rows represent the outer nested levels of the series and
categories, and the charts in the columns represent the categories. Each data item
in the outer nested levels of the series and categories becomes a separate chart. The
numeric scale of all the charts is the same so that you can easily compare.
When working with pie, gauge, and bullet charts, if you include a data item in the
categories, you automatically create a matrix of charts. One chart appears for each
data item in the category. When working with progressive and bullet charts, if you
include a data item in the series, you also automatically create a matrix of charts.
For example, the following column chart shows the revenue for each year (in the
categories or x-axis) for all the regions and product lines (in the series or y-axis).
This chart is very complex and difficult to understand.
The following chart contains the same series and categories. However, when
converted to a matrix of charts, the information is much easier to analyze. The
columns show charts for each year and the rows show charts for each the product
lines. The bars represent the revenue for each region.
Figure 30. An example column chart
86 IBM Cognos Workspace Advanced Version 10.2.2: User Guide

Procedure
1. Click the chart object.
2. In the Properties pane, click Matrix rows and columns.
3. Select the Show outer nested series as matrix rows or Show outer nested
categories as matrix columns check boxes (or both).
4. In the Matrix levels box, select the number of nested levels to include in the
matrix columns or rows.
The remaining nested levels are represented in the chart bodies in the matrix
if the chart supports additional categories. The pie, gauge, and bullet charts
do not support additional categories. The bullet and progressive column
charts do not support additional series.
For example, in the example column chart, Regions are nested under Product
Line. In the matrix chart, a Matrix level of 1 is specified. Therefore, Product
Line appears as the matrix rows (series) and Regions appear within the chart
bodies.
5. If you want labels for the matrix rows and columns to appear on each chart,
select the Show row labels or Show column labels check box.
6. In the Labels location list, select where the nested labels should appear on
each chart.
The default position is on the bottom for columns and on the left for rows.
7. If the labels are too long, click Truncation and specify where to truncate text
or select the Size fonts automatically check box to resize the text to fit.
8. To change the font, color, and data format of the labels, click Style.
Figure 31. An example matrix of charts
Chapter 5. Charts 87

9. To show the title in the row or column axis, select the Show row title or
Show column title check box.
10. If your matrix chart includes only rows or columns, and you want them to
wrap, select the Wrap rows or columns if possible check box.
Customize a Gauge Chart
You can customize the gauge border, axes, lines, pivot, and needle to make the
chart easier to read.
Unless indicated in the user interface, all sizes are a percentage of the maximum
allowed.
If your gauge chart includes a border, long axis labels, such as 250,000,000, might
overlap the gauge border and be difficult to read. To avoid this problem, customize
the data format of your gauge chart measure and reduce the scale so that fewer
zeros are displayed. Or change the gauge border color or size or remove the
border.
Procedure
1. Click the gauge chart object.
2. If you want to change the size, shape, and color of the center pivot point, in the
Properties pane, click Gauge pivot, and specify the style.
3. If you want to customize the border around the gauge, in the Properties pane,
click Gauge border.
4. If you want to change the indicators in the gauge axis, select the gauge axis
object in the chart and do the following steps:
v To customize the gauge needles, in the Properties pane, click Gauge needle
and specify the style
v To change, add, or remove color bands that indicate the data range positions,
in the Properties pane, click Gauge axis colors and specify the color palette.
v To change the gridlines, in the Properties pane, click Gridlines or Minor
gridlines and specify the style.
v To change the appearance of the gauge axis line, click Axis line and specify
the style.
Figure 32. The elements of a gauge chart
88 IBM Cognos Workspace Advanced Version 10.2.2: User Guide

Defining color by value in scatter or bubble charts
In a scatter or bubble chart, you can specify that data points or bubbles appear in
different colors that are based on an additional measure or fact. The color of the
points or bubbles helps you to see relationships in large amounts of data.
For example, the following bubble chart shows the relationship between the unit
cost and unit sale price. The size of the bubbles shows the gross profit and the
color of the bubbles shows whether the quantity sold is above (yellow) or below
(green) 1,000,000 units.
Procedure
1. Drag a measure to the Color drop zone under Measures and then select the
measure.
2. In the Properties pane, click Color by value.
3. To define the colors by percentages instead of actual values, select the
Percentage check box.
For example, if you select the Percentage check box and your values range
from 25 (red) to 50 (green), the bottom 25 percent of values are red and the top
50 percent of values are green. The values between 25 percent and 50 percent
are an interpolated color, such as yellow.
4. If you want to use a preset color palette, click Palette, and select the palette
that you want to use.
5. If you want to customize a palette color or boundary value, select the palette
entry in the Palette box, specify the color and transparency, and type a new
boundary value.
6. To change the color and transparency of the palette definition:
7. To add a palette entry, select the palette entry below which you want to add
the new entry, click the new palette entry icon
, and click Color.
8. If your chart has lines or markers, under Style, set the marker shape, line style,
and line weight.
Figure 33. Example of a bubble chart that shows values in different colors
Chapter 5. Charts 89

9. To choose a color and transparency for missing or null values, under Missing
Values, click Color and type a value in the Transparency box.
Create a Donut Chart from a Pie Chart
You can add a hole to the middle of your pie chart to create a donut chart. You can
then display something in the hole, such as a company logo, a calculation, or the
legend.
Procedure
1. Select the pie chart object.
2. In the Properties pane, set the Hole size (%) property to the percentage of the
pie that you want the hole to take up.
Tip: You can select a value from the Hole size (%) list or type a value that is
not listed.
Pull Out Pie Slices in a Pie Chart
You can highlight pie slices by pulling them out from the rest of the pie.
Because the pie slices represent data items, if you replace or delete the data item,
the slice is no longer pulled out and returns in the pie.
For example, the following chart shows revenue by product line with the Outdoor
Protection slice pulled out.
Procedure
1. Right-click the pie slice that you want to pull out and click Explode Slice.
The slice is pulled away from the chart.
2. To return the pulled-out slice in the pie, right-click the pie chart object and click
Remove Exploded Slices.
Figure 34. Example of a pie chart with a slice pulled out
90 IBM Cognos Workspace Advanced Version 10.2.2: User Guide
Customize a Bullet Chart
After you create a bullet chart, you can customize the shape, color, and size of the
bullet and target indicators.
By default, the bullet chart includes three gray colored regions in the background.
You can edit the colored regions (Properties pane, Colored regions).
Procedure
1. Select the bullet chart object.
2. To change the shape, color, and size of the bullet or target, do the following:
v In the Properties pane, click Bullet indicators.
v Under Bullet, specify how to show the bullet.
The Bar width setting specifies the width of the bullet bar as a percentage of
the space available. For example, if you specify 50 percent, the bar uses half
of the space available. If you specify 100 percent, the bar uses all the
available space.
v Under Target, specify how to show the target.
3. To change the chart orientation, in the Properties pane, under Chart
Orientation, select Vertical or Horizontal.
Related tasks:
“Add Colored Regions to a Chart” on page 76
You can define colored regions in the body of a chart.
Chapter 5. Charts 91
92 IBM Cognos Workspace Advanced Version 10.2.2: User Guide

Chapter 6. Extensible visualizations
You can use extensible visualizations in IBM Cognos reports to visualize data.
Visualizations must be imported into IBM Cognos Administration. The
Visualization Gallery is empty until your administrator imports the visualizations
and makes them available to you. Your administrator can set permissions to restrict
access to only certain report authors.
The visualizations come from the site AnalyticsZone (https://
www.analyticszone.com). For more information about administration and
visualizations, see the IBM Cognos Business Intelligence Administration and Security
Guide.
Because visualizations are extensible, they can be customized by an author with
the necessary skills. You can create client-side visualizations that report consumers
can run when they are not connected to the web. You can also use visualizations
on mobile devices.
Some of the visualizations that you can add to your reports are treemaps,
heatmaps, packed bubble visualizations, and network diagrams.
You can set properties that are available for each visualization type. These
properties are determined by the visualization definition. Typically, you can set
such properties as width, height, animation effect, and fixed-axis scaling.
For more information about visualizations and their uses, go to Many Eyes
®
(http://www-958.ibm.com).
Attention: If you use Microsoft Internet Explorer to view visualizations, you must
have Microsoft Silverlight 5 installed on your computer. Firefox or iPad users do
not need Silverlight.
Adding a visualization to a report
You can add a visualization to a report to efficiently represent your data.
Before you begin
Your administrator must make the visualizations available in the Visualization
Gallery.
If you use Microsoft Internet Explorer to view visualizations, you must have
Microsoft Silverlight 5 installed on your computer. Firefox or iPad users do not
need Silverlight.
About this task
You add data to a visualization by inserting data items in drop zones.
When working with dimensional data sources, if the visualization does not contain
a measure against which to plot data, you must provide one. For example, if you
© Copyright IBM Corp. 2005, 2014 93

add a single member to the values drop zone, such as '2012', the default measure
drop zone appears in which you must insert a measure.
Attention: The supported properties for a visualization are determined by the
visualization definition.
Procedure
1. Create a new report or open an existing report.
2. From the Toolbox tab
, drag a Visualization icon to the work area.
3. From the Visualization Gallery, select a visualization and click OK.
4. From the Source tab
, drag items to the appropriate location in the data
container.
5. Run the visualization.
Adding a treemap visualization
You can use a treemap visualization in reports to identify patterns and exceptions.
Treemaps show relationships among large numbers of components by using size
and color coding in a set of nested rectangles.
A treemap that is colored by category identifies the level 1 category by color. The
sizes of the rectangles represent the values. In a treemap that is colored by value,
the sizes of the rectangles represent one of the values and the color represents a
second set of values.
Attention: The supported properties for a visualization are determined by the
visualization definition.
94 IBM Cognos Workspace Advanced Version 10.2.2: User Guide

Before you begin
Your administrator must make the visualizations available in the Visualization
Gallery.
If you use Microsoft Internet Explorer to view visualizations, you must have
Microsoft Silverlight 5 installed on your computer. Firefox or iPad users do not
need Silverlight.
About this task
You add data to a visualization by inserting data items in drop zones.
When working with dimensional data sources, if the visualization does not contain
a measure against which to plot data, you must provide one. For example, if you
add a single member to the values drop zone, such as '2012', the default measure
drop zone appears in which you must insert a measure.
Attention: The supported properties for a visualization are determined by the
visualization definition.
Procedure
1. From the Toolbox tab , drag a Visualization icon to the work area.
2. From the Visualization Gallery, select a Treemap icon:
v If you are plotting a single measure, select a treemap colored by category.
Figure 35. A treemap visualization
Chapter 6. Extensible visualizations 95

v If you are plotting two measures, select a treemap colored by value.
3. Click OK.
4. From the Source tab
, drag items to the appropriate location in the data
container:
a. Under Values, drag items to define the size and color of the rectangles to
Size and Color.
b. Under Categories, drag items to the different levels. Each level represents
the category within which the subsequent levels are nested. For example,
the levels might be Year, Product Line, and Product Type.
Adding a heatmap visualization
Heatmaps use colors to represent the individual values that are contained in a
matrix.
Similar to treemaps, you can use heatmaps to identify patterns and exceptions.
Unlike treemaps, the sizes of the rectangles are not proportionate to values.
Before you begin
Your administrator must make the visualizations available in the Visualization
Gallery.
If you use Microsoft Internet Explorer to view visualizations, you must have
Microsoft Silverlight 5 installed on your computer. Firefox or iPad users do not
need Silverlight.
Figure 36. A heatmap visualization
96 IBM Cognos Workspace Advanced Version 10.2.2: User Guide

About this task
You add data to a visualization by inserting data items in drop zones.
When working with dimensional data sources, if the visualization does not contain
a measure against which to plot data, you must provide one. For example, if you
add a single member to the values drop zone, such as '2012', the default measure
drop zone appears in which you must insert a measure.
Attention: The supported properties for a visualization are determined by the
visualization definition.
Procedure
1. From the Toolbox tab , drag a Visualization icon to the work area.
2. From the Visualization Gallery, select the Heatmap icon and click OK.
3. From the Source tab
, drag items to the appropriate location in the data
container:
a. Under Values, drag a measure or a single value to define the color shading
of the rectangles.
b. Under Categories, drag items to the Y Category and X Category.
Tip: Ensure that the items in the Y Category and X Category come from
different dimensions.
Adding a packed bubble visualization
A packed bubble visualization is similar to a bubble chart in which the bubbles are
tightly packed rather than spread over a grid. You can use a packed bubble
visualization to display a large amount of data in a small space.
Chapter 6. Extensible visualizations 97

Before you begin
Your administrator must make the visualizations available in the Visualization
Gallery.
If you use Microsoft Internet Explorer to view visualizations, you must have
Microsoft Silverlight 5 installed on your computer. Firefox or iPad users do not
need Silverlight.
About this task
You add data to a visualization by inserting data items in drop zones.
When you work with dimensional data sources, if the visualization does not
contain a measure against which to plot data, you must provide one. For example,
if you add a single member to the values drop zone, such as '2012', the default
measure drop zone appears in which you must insert a measure.
Attention: The supported properties for a visualization are determined by the
visualization definition.
Procedure
1. From the Toolbox tab , drag a Visualization icon to the work area.
2. From the Visualization Gallery, select the Packed Bubble icon and click OK.
3. From the Source tab
, drag items to the appropriate location in the data
container:
a. Drag a measure or a single value to the data container, under Values.
b. Under Categories, drag an item to plot as the bubbles.
Figure 37. A packed bubble visualization
98 IBM Cognos Workspace Advanced Version 10.2.2: User Guide

c. Under Series, drag an item to apply as a category. Each item in the category
gets a different color from the color palette.
Adding a network diagram
You can create a network diagram in reports. The nodes data container defines the
items that you want to link together. The links data container defines relationship
between the items that you want to link together.
Before you begin
Network node drop zones only take numeric data items. Not all data sources have
the appropriate data to create a network diagram.
Your administrator must make the visualizations available in the Visualization
Gallery.
If you use Microsoft Internet Explorer to view visualizations, you must have
Microsoft Silverlight 5 installed on your computer. Firefox or iPad users do not
need Silverlight.
About this task
You add data to a visualization by inserting data items in drop zones.
When working with dimensional data sources, if the visualization does not contain
a measure against which to plot data, you must provide one. For example, if you
add a single member to the values drop zone, such as '2012', the default measure
drop zone appears in which you must insert a measure.
Attention: The supported properties for a visualization are determined by the
visualization definition.
Figure 38. A network diagram in an active report showing employees by region
Chapter 6. Extensible visualizations 99

Procedure
1. From the Toolbox tab , drag a Visualization icon to the work area.
2. From the Visualization Gallery, select the Network diagram icon and click OK.
3. From the Source tab
, drag items to the appropriate location in the data
container:
a. In the Nodes1 data container, drag items to Node (Numeric) and Name.
The nodes data container defines the items that you want to link together,
such as Employees, defined by an employee code.
b. In the Links1 data container, drag items to From node (Numeric) and To
node (Numeric). The links data container defines relationship between the
items that you want to link together, such as Employees and Managers.
Visualization properties
The properties that you can set for each visualization affect how you work with
visualizations that are inserted in a report.
All extensible visualizations have properties in common and properties that are
specific to each visualization. Properties that are specific to a visualization are
defined by the visualization author in the visualization definition. By default,
properties that are defined by the visualization author appear in a group that is
named Custom in the Properties window, unless the author created property
groups in the visualization definition.
To set properties for multiple visualizations, press Ctrl while you click the
visualizations in the report. When multiple visualizations are selected, only the
common properties appear in the Properties window.
Resizing a visualization
You can change the size of a visualization.
Procedure
1. Click and drag the lower right corner of the visualization.
2. To maintain the aspect ratio, press the Shift key while you resize the
visualization.
You can view the changing height and width of the resized visualization in the
Properties pane, under Positioning.
Specifying the range values that are displayed
You can specify the range of values that you want to display in a visualization.
About this task
To control the range of values that is displayed, the following choices are available
to calculate the minimum and maximum values of the range.
v All data
With this choice, minimum and maximum values are calculated to span the
values of the inserted measure.
v All detail data
100 IBM Cognos Workspace Advanced Version 10.2.2: User Guide

This choice is available only when you create sections. With this choice, the
range of data that is displayed is the same in each section.
v Specified values
With this choice, you specify the minimum and maximum values that you want
to display in the visualization.
Note: The minimum and maximum values that are displayed in the
visualization might differ from the values that you specify. For example, if you
specify a range of 0 to 195, IBM Cognos BI might display a range of 0 to 200.
Procedure
To specify the range of values that is displayed, follow these steps.
1. In the visualization data container, click the data item in the Values section that
represents the values in the visualization. For example, in a packed bubble
visualization, click the data item that is inserted in the Size box.
2. In the Properties pane, double-click the Value Range property.
3. In the Range type box, click one of the available choices.
4. If you clicked All data or All detail data and you want the range of values to
include zero, select the Range includes zero check box.
5. If you clicked Specified, type the minimum and maximum values of the range
in the Minimum and Maximum boxes.
Updating visualizations
Update visualizations when a change was made to the visualization definition.
About this task
If any part of a visualization is invalidated by changes that were made to the
visualization definition, the invalidated part is removed. For example, if a field is
renamed, the data items in the field are removed. You must add the data items to
the renamed field for the visualization to run.
Procedure
Open the report in a new Cognos Workspace Advanced window.
Converting visualizations from one type to another
You can convert a visualization from one type to another type.
About this task
The following list describes the conversion process.
v Data items are mapped to fields with the same name.
v If no field with the same name exists, the first field of the same type is used.
Value fields are mapped to value fields. Category fields are mapped to category
fields. Category fields that are ID fields are only mapped to other category fields
that are also ID fields.
v Common properties that are not specific to visualizations, such as Data format,
are preserved.
v No warnings appear for properties that are dropped during the conversion.
Chapter 6. Extensible visualizations 101
When you convert a visualization to a new visualization type, you can preserve
properties that have the same ID and the same type. Or you can choose to use
only the default properties of the new visualization.
If you convert a visualization to a visualization type that has more fields than the
original visualization, you must populate the empty fields in the converted
visualization. For example, if you convert a column chart to a combination chart
that has columns and lines, there are empty fields for the line data container.
You cannot convert a visualization to a current default chart and vice versa.
Procedure
1. Right-click a visualization and click Convert Visualization.
2. Select a new visualization type.
3. To preserve properties that have the same ID and the same type, under
Visualization properties, click the Preserve existing visualization properties
radio button.
4. To use only the default properties of the visualization type that you are
converting to, under Visualization properties, click the Use new visualization
default properties radio button.
5. Click OK.
102 IBM Cognos Workspace Advanced Version 10.2.2: User Guide

Chapter 7. Lists
Use list reports to show detailed information from your database, such as product
lists and customer lists.
A list report is a report that shows data in rows and columns. Each column shows
all the values for a data item in the database or a calculation based on data items
in the database.
List reports automatically include an overall summary in a footer row. The default
summary is used.
You can specify whether to automatically add an overall aggregate summary in the
list footer and a summary for any groups in the list by selecting Automatic group
and summary behavior for lists in the IBM Cognos Workspace Advanced options.
The default aggregation as specified in your enterprise data source is used. For
more information, see “Report Options” on page 26.
Related tasks:
“Summarize Relational Data” on page 110
Summarize data in your reports to obtain a total, count, average, minimum,
maximum, and so on.
“Summarize Dimensional Data” on page 140
Summarize data in your reports to obtain a total, count, average, minimum,
maximum, and so on.
“Change a List into a Crosstab” on page 48
Change a list into a crosstab to view your data from a different perspective.
Group Data
Group data items in a list report to remove duplicate values. For example, you
have a report that shows products purchased. For each product, the product type
is also shown. You group the product type column to show only one instance of
each product type in the list.
Grouping a column automatically moves it to the left as the first column. Grouping
a subsequent column moves it to the left until it follows the last grouped column.
When you ungroup a column, it moves to the right until it follows the last
grouped column.
Figure 39. An example list report
© Copyright IBM Corp. 2005, 2014 103

After a column is grouped, you can move it elsewhere in the report.
In addition to grouping, you can specify the sort order of data items. In lists, you
can sort data items within groups as well as ungrouped items. In crosstabs, you
can sort row and column items.
Procedure
1. Click the column on which to group.
You can click either the column heading or one of the column cells.
Tip: To perform multiple groupings at once, use Ctrl+click or Shift+click.
2. Click the group/ungroup button
.
Related tasks:
“Sorting relational data” on page 111
You can sort items to view them in your preferred order.
“Dividing data into sections” on page 167
Create sections in a report to show a separate list, chart, visualization, or crosstab
for a data item.
104 IBM Cognos Workspace Advanced Version 10.2.2: User Guide

Chapter 8. Exploring Relational Data
Relational data is best represented by lists. This data is organized in IBM Cognos
Workspace Advanced by query items.
In relational reporting, you summarize data by using headers and footers in lists,
summary functions, member summaries, and within detail aggregation. You focus
data in relational reporting with summary or detail filters.
IBM Cognos Query Studio is also available to work with relational data.
Using Relational Calculations
Inserting a calculation makes your report more meaningful by deriving additional
information from the data source. For example, you create an invoice report, and
you want to see the total sale amount for each product ordered. Create a calculated
column that multiplies the product price by the quantity ordered.
You build calculations in the expression editor using functions.
If a calculation is used in multiple reports, or by different report authors, ask your
modeler to create the calculation as a standalone object in the model and include it
in the relevant package.
Calculation Solve Order
When calculations in the rows and columns of a report intersect, calculations are
performed in the following order:
v addition or subtraction
v multiplication or division
v aggregation (rollup)
v remaining arithmetic functions: absolute, round, round down, average,
minimum, maximum, medium, count
v percentage, % difference (growth) or % of total
v rank, quartile, quantile, or percentile
If both calculations have the same precedence, for example, if they are both
business functions, then the row calculation takes precedence.
If you have the necessary permissions, you can open your report in IBM Cognos
Report Studio and override the order of precedence by changing the solve order
property. For more information, see the IBM Cognos Report Studio User Guide.
Limitations of Calculations
Use only the expressions and functions that are available in IBM Cognos
Workspace Advanced, and follow their syntax. For best results, do not build
calculations or summaries over other calculations that were authored in Report
Studio.
© Copyright IBM Corp. 2005, 2014 105

Minimal checking exists for calculations. If your calculation uses an invalid
expression, your report results may contain unexpected values.
In addition, you should define member summaries as follows:
summary_function (currentMeasure within set set_reference)
where set_reference is a level or set inserted from the Source tab
.
Unless otherwise required, use summary_function as the aggregate function. If you
use an explicit summary function, you may encounter problems with measures
and scenario or account dimension members (such as profit margin, distinct count,
and so on) that have complex rollup rules, or members that do not roll up.
Know your data, and confirm with the owner of the cube where overriding the
automatic aggregation is safe.
Because of these limitations, summaries of calculations may not provide reliable
values. For convenience, you may need to build reports where row summaries and
calculated member columns intersect. In such reports, these intersections may
contain unexpected values. In contrast, row calculations intersecting with column
aggregates using the aggregate function are safe because the calculation is
performed on the reliably summarized values.
If you need to create more complex expressions, use Report Studio.
Create a Simple Calculation
You can select items in your report and create simple calculations. In addition to
simple arithmetic calculations, you can perform numeric, string, date and time, and
interval calculations.
The following table defines the available numeric calculations.
Table 10. Descriptions of numeric calculations
Calculation Description
- data item When you select one numeric data item,
inserts the negative of the current value.
Absolute For numeric data items, inserts the absolute
value.
Round For numeric data items, inserts a number
rounded to the nearest integer.
Round up For numeric data items, inserts a number
rounded to the nearest integer.
Round down For numeric data items, inserts a number
rounded to the integer closest to zero.
Rollup Summarizes, or rolls up, all the values in a
hierarchy.
106 IBM Cognos Workspace Advanced Version 10.2.2: User Guide

Table 10. Descriptions of numeric calculations (continued)
Calculation Description
% Calculates the value of the first item selected
as a percentage of the second item.
% Difference Calculates the difference between two items
as a percentage.
% of total Calculates the value of the item as a
percentage of the total for the report.
Note: Expression definition: total(x)/
total(total(x) for report)
% Of Base Takes the first selected member from edge A
and the second selected member from edge
B. The calculation result of a percent of base
compare all of the values for member A to
the intersect value of members A and B.
Note: This calculation is only available if
you select two members from different
hierarchies, each from a different edge.
Custom Allows you to specify your own value when
performing a simple arithmetic calculation.
Also allows you to change the order of
operands, or type a custom name for the
new calculated row or column.
The following table defines the available string calculations.
Table 11. Descriptions of string calculations
Calculation Description
Remove trailing spaces For string data items, removes any extra
spaces that appear after the last character in
the string. Spaces between words are not
removed.
Extra spaces can sometimes cause
unexpected results when you sort, filter, or
search.
First ? characters For string data items, truncates the text to
show only the first number of characters
that you specify.
Last ? characters For string data items, truncates the text to
show only the last number of characters that
you specify.
The following table defines the available date and time calculations.
Chapter 8. Exploring Relational Data 107

Table 12. Descriptions of date and time calculations
Calculation Description
Add ? years
Add ? months
Add ? days
When selecting one date or time data item,
adds the specified number of years, months,
or days to the selected value.
Year, Month, Day, Hour, Minute, and
Second
When selecting one date or time data item,
shows the year, month number, day number,
hour, minute, or second value.
The following table defines the available interval calculations.
Table 13. Descriptions of interval calculations
Calculation Description
Days For interval data items, such as number of
days between two dates
If you want to create a more advanced calculation that uses mathematical
functions, create a query calculation.
Procedure
1. Select the items in your report to calculate.
Tip: Shift+click or Ctrl+click to select multiple items.
2. Click the insert calculation button
and select the calculation to perform.
Note: Only calculations that are applicable to the items that you have selected
appear.
3. To change the order of the operands or the name of the calculated item added
to the report, click Custom.
Results
The calculation appears as a new row or column in your report.
Inserting a Query Calculation
Insert a query calculation into your report to add a new row or column with
values that are based on a calculation. For example, you create a query calculation
named Euros that converts dollars to euros by multiplying an existing dollar
measure by a conversion rate. Euros can then be displayed to end users in a
separate row or column.
Quality of Service Indicators
Not all data sources support functions in the same way. The data modeler can set a
quality of service indicator on functions to give a visual clue about the behavior of
the functions. Report authors can use the quality of service indicators to determine
which functions to use in a report. The quality of service indicators are as follows:
108 IBM Cognos Workspace Advanced Version 10.2.2: User Guide

v not available (X)
This function is not available for any data source in the package.
v limited availability (!!)
The function is not available for some data sources in the package.
v limited support (!)
The function is available for all data sources in the package but is not naturally
supported for that data source, which can result in poor performance and
unexpected results.
v unconstrained (check mark)
The function is available for all data sources.
Using Quotation Marks in Literal Strings
When inserting literal strings in an expression, you must enclose the string in
single quotation marks. If the string contains a quotation mark, it must be
modified. For example, if you want to insert the string ab'c, you must type 'ab''c'.
Insert a Query Calculation
Insert a query calculation into your report to add a new row or column with
values that are based on a calculation.
Important: When creating an expression for use in a double-byte environment,
such as Japanese, the only special characters that work are ASCII-7 and ~ -- || - $
¢£¬.
Tip:
v To show or hide the Available Components pane, click the blue arrow to the
right of the pane.
v To show or hide the Information pane, click the blue arrow above the pane.
v To copy and paste expression components in the Expression Definition pane,
you can use the copy button
and the paste button .
Procedure
1. From the Toolbox tab , drag Query Calculation to the report.
2. Type a meaningful name for your expression in the Name box.
For example, if you are calculating the difference between 2007 revenue and
2006 revenue, you could name your expression 2007 - 2006 Revenue.
3. In the Available Components pane, define the calculation:
v To add data items that are not shown in the report, on the source tab
,
double-click the data items.
v To add data items that are in the report but not necessarily in the model,
such as calculations, on the data items tab
, double-click the data items.
v To add functions, summaries, and operators, on the functions tab
,
double-click elements.
Chapter 8. Exploring Relational Data 109

Tip: To filter the visible functions, summaries, and operators in the
Available Components pane, click the filter button
and filter by the
function type, what the function returns, or what the function acts on.
Tip: You can also type the calculation directly in the Expression Definition
box. When typing date values, ensure that the date format is correct for your
database type.
4. Click the validate button
.
Any validation errors appear on the Errors tab of the Information pane.
Summarize Relational Data
Summarize data in your reports to obtain a total, count, average, minimum,
maximum, and so on.
After you add summary rows or columns, you can move them by dragging them
elsewhere in the report.
You can also use summary functions in custom calculations.
The following table defines the available summaries.
Table 14. Descriptions of types of summaries for relational data
Summary Description
Automatic Summary Uses the default summary for the data item,
as specified in the data source.
For example, a data item that represents part
numbers likely uses count as the default
summary.
Total Adds all values, excluding null and missing
values.
Count Counts all values, excluding null and
missing values.
Average Adds all values, and then divides by the
count of values, excluding null and missing
values.
Minimum Selects the smallest value, excluding null
and missing values.
Maximum Selects the largest value, excluding null and
missing values.
When adding summaries to crosstabs or charts, the default is to use detail
summaries. A detail summary tries to summarize only data that is visible in the
crosstab or chart structure. If it is not clear how to summarize the data, such as
when a report includes ambiguous nesting, the report displays no value (--) or an
error occurs.
110 IBM Cognos Workspace Advanced Version 10.2.2: User Guide

Procedure
1. Click the row or column to summarize.
2. On the toolbar, click the summarize button , and select a summary type.
The summary appears as a new row or column.
3. To change the summary label, right-click the label and type a new name, such
as Total (February sales).
Tip: To remove a summary, select the summary label, and click the delete
button
.
Related concepts:
“Using Relational Calculations” on page 105
Inserting a calculation makes your report more meaningful by deriving additional
information from the data source. For example, you create an invoice report, and
you want to see the total sale amount for each product ordered. Create a calculated
column that multiplies the product price by the quantity ordered.
Sorting relational data
You can sort items to view them in your preferred order.
By default, IBM Cognos Workspace Advanced retrieves items in the order defined
in the data source. Relational data sources may not always have a defined order.
The data modeler defines the sorting options in the model. For more information
about data modeling, see the IBM Cognos Framework Manager User Guide.
Procedure
1. Select the column or row to sort.
2. Click the sort icon
.
3. Under Sort in Layout, click Ascending or Descending.
Tip: To remove a sort order, click Don't Sort.
Sorting multiple rows or columns and grouped columns
If you sort more than one row or column, you can change the order in which they
are sorted. You can also sort grouped columns in a list.
Procedure
1. Select a column or row.
2. Click the sort icon
and click Edit Layout Sorting.
3. To sort a list column within a group, do the following:
a. In the Groups pane, under the Groups folder, expand the folder of the
grouped column.
b. In the Data Items pane, drag the data items to sort to the Sort List folder.
You can also drag data items from the Detail Sort List folder.
c. Click the sort order button
to specify ascending or descending order.
4. To change the sort order when multiple columns are sorted, in the Groups
pane, change the order of columns in either the Sort List folder of a group or
in the Detail Sort List folder.
Chapter 8. Exploring Relational Data 111
Tip: Add items to the Detail Sort List folder to sort items that are not groups.
Related tasks:
“Group Data” on page 103
Group data items in a list report to remove duplicate values. For example, you
have a report that shows products purchased. For each product, the product type
is also shown. You group the product type column to show only one instance of
each product type in the list.
Sorting lists based on a data item not in the report
You can sort columns in a list using a data item from the source tree to sort based
on a data item that is not included in the list.
For example, a list shows all products in your product line. You want to sort them
by production cost without having to add the production cost measure to the
report.
For relational data sources, you can use measures
and query items to
sort.
For dimensional data sources, you can use measures
and levels to sort.
Procedure
1. Select a column.
2. From the Source tab
, right-click the measure, query item, or level and
click Sort for report.
3. From the Data items column, move the data item to the Detail Sort List in the
Groups column.
4. Click the sort order icon
to specify ascending or descending order.
Format Relational Data
Format data in a report to improve readability. For example, you can show all date
values in the order year, month, and day. If you do not specify formatting, data is
formatted according to the properties set in the model. If the properties were not
set in the model, data is formatted according to the International Components for
Unicode (ICU) formats.
You can also format data based on a condition.
Data formats are not applied in delimited text (CSV) and XML report outputs.
Procedure
1. In the work area, right-click a data item and click Style, Data Format.
Tip: You can also use the data format button
on the style toolbar.
2. In the Format type box, click a format type.
The properties that you can set for the selected format type appear in the
Properties box.
3. Set the properties that you want.
112 IBM Cognos Workspace Advanced Version 10.2.2: User Guide
For properties in which you type meta-characters that represent certain types of
information, such as YYYY-MM-DD for dates, the meta-characters required
depend on the authoring language specified for the report.
If you specify a value for the Pattern property, all other formatting properties
are ignored, with the following exceptions:
v Missing Value Characters
v Zero Value Characters
v Negative Pattern
Be aware that some properties are locale-sensitive.
Results
The data formatting properties are applied. If a data item contains values in
multiple currencies, but only a subset of those currencies have defined formats, the
default format for the locale you are working in is applied to values for which no
format is specified.
Related concepts:
“Support for bidirectional content” on page 169
You can author reports that support bidirectional content. You can specify base text
direction, digit shaping, and container direction.
Specifying the Number of Decimals in Numbers
When specifying the number of decimals, IBM Cognos Business Intelligence uses
the IEEE 754 default rounding mode known as half even. With half even rounding,
numbers are rounded toward the nearest truncated value, unless both truncated
values are equidistant, in which case the value ending in an even digit is chosen,
as follows:
v If the digit immediately after the precision to be shown is greater than 5, the
number is rounded up.
v If the digit immediately after the precision to be shown is less than 5, the
number is rounded down.
v If the digit immediately after the precision is a 5, the number is rounded down
when the preceding digit is even and rounded up when the preceding digit is
odd.
For example, the number 78.5 is rounded to 78, while the number 73.5 is
rounded to 74.
In addition, if the maximum number of decimals is lower than the actual number
of decimals in the number, the number is rounded to the maximum number of
decimals.
Locale-sensitive Properties
IBM Cognos Workspace Advanced contains an extensive library of customized
properties adapted to users from different regions who speak different languages.
For example, if a modeler specifies that a given data item is a currency, you must
specify only the proper currency symbol. When reports are created, Cognos
Workspace Advanced automatically adapts the format of the currency numbers to
each user according to the content language specified in IBM Cognos Connection.
When modelers or report authors specify properties, these properties override user
preferences and risk creating inconsistent formatting for users of other cultures. It
is usually much easier and safer to let Cognos Workspace Advanced do the
Chapter 8. Exploring Relational Data 113
formatting. For example, for the date format type, different regions use different
characters to represent the date separator. If you specify a date separator, you may
confuse users in other regions.
The following data formatting properties are locale-sensitive:
v Currency Symbol Position
v Date Separator
v Date Ordering
v Calendar Type
v Time Separator
v Display AM/PM Symbols
v Clock
v Decimal Symbol
v Negative Sign Position
v Thousands Separator
v Group Size (digits)
v Secondary Group Size (digits)
v Missing Value Characters
v Zero Value Characters
v Pattern
v Negative Pattern
Digit shaping in charts
When working with bidirectional content, you cannot specify digit shaping at the
chart level. You can specify digit shaping for the objects in charts.
To understand how digit shaping is applied to charts, you must know which chart
objects are considered text and which objects are considered numeric values.
The following list describes those chart objects that are considered text.
v chart title
v subtitle
v footer
v notes
v legend item
v legend title
v regression label
v marker label
v background image label
v axis titles
v discrete axis label (for example, category axis label, x-axis)
v baseline labels
The following list describes those chart objects that are considered numeric values.
v numeric axis label (for example, measure axis label, y-axis)
v numeric values that appear in the legend (you can select to show the first, last,
maximum, minimum value for each item in legends)
v numeric values that appear in the chart
114 IBM Cognos Workspace Advanced Version 10.2.2: User Guide

The following list describes the different digit shaping options and how digit
shaping is applied to charts.
v The digit shape options for text objects, which include titles, footers, and labels,
are Default, None, National, and Contextual. Digit shape options for numeric
values are Default, None, and National. There is no Contextual option for
numeric values.
v By default, digit shaping is not applied to numbers that appear on an object that
is considered text. For example, if a chart shows year data on the x-axis and the
content language specified in IBM Cognos Connection is Arabic (Egypt), no digit
shaping is applied because the x-axis label is considered a string.
The following list describes the default digit shaping behavior for charts when the
content language is Arabic (Egypt).
v Numeric values that have a specific format, such as decimal or currency, are
displayed as Arabic-Indic.
v Except for matrix charts, numeric axis labels for charts are displayed in
European digits.
This is due to the way that charts are rendered. The engine used to render charts
does not perform any formatting for numeric axis labels. No locale information
is passed, and consequently the labels are displayed as European digits. To
display the labels as Arabic-Indic, select the digit shaping option National.
Matrix charts are rendered using International Components for Unicode (ICU) to
format numbers. Locale information is passed and the numbers are shaped
accordingly. For example, when the content language is Arabic (Egypt), ICU
displays numbers as Arabic-Indic.
v Numbers within text labels are displayed as is. That is, no digit shaping is
applied.
The following list describes the default digit shaping behavior for charts when the
content language is Thai.
v Numeric values that have a specific format, such as decimal or currency, are
displayed as European digits.
v Numbers within text labels are displayed as is. That is, no digit shaping is
applied.
Filtering relational data
Use filters to remove unwanted data from reports. Data is displayed in the report
only if it meets the filter criteria. When working with relational data sources, the
available filtering options are determined by the data that you select.
You can combine two or more filters into a complex filter, create a context filter,
and create top or bottom filters.
If you filter values that are floating-point numbers, you may encounter imprecise
filtering results due to rounding or data truncation. Floating-point numbers may
appear differently in the report than how they are stored in the data source. To
ensure accurate results, your filter criteria should account for any rounding issues.
By default, filters on measures are applied after automatic aggregation. You can
change whether filters are applied before or after aggregation using the Edit filters
option.
Chapter 8. Exploring Relational Data 115

You can also use filters to suppress null cells in your reports. Using filters ensures
that calculations take suppression into account. If you want to perform calculations
before suppression is applied, use the Suppress option.
Procedure
1. Select the data item on which you want to filter.
Tip: If you select two or more items, you can filter using a range.
2. Click the filter icon
.
3. Select a filter condition from the list.
4. Click OK.
Related concepts:
“Relational and dimensional reporting styles” on page 17
You can create reports in IBM Cognos Workspace Advanced using either a
relational reporting style or a dimensional reporting style depending on the type of
data source you use.
Related tasks:
“Suppress Empty Cells in Dimensional Reporting” on page 139
Sparse data may result in crosstabs showing empty cells. For example, a crosstab
that matches employees with products results in many rows of empty values for
the revenue measure if the employee does not sell those products.
Creating a custom filter
Create custom filters when the values you want to use in your filter conditions do
not occur in your report.
You can use filters to create prompts in the report. Prompts provide questions that
help users to customize the information in a report to suit their own needs. For
example, you create a prompt so that users can select a region. Only data for the
specified region is retrieved and displayed in the report.
Procedure
1. Select the data item on which you want to filter.
Tip: If you select two or more items, you can filter by using a range.
2. On the toolbar, click the filter icon
.
3. Click Create Custom Filter.
4. Under Condition, select the type of condition you want.
5. Optional: Type a value to search for in the Keywords box. You can also paste a
list of values from a spreadsheet into the Keywords box. Optionally, modify the
search criteria by clicking the arrow beside the Keywords button. Then, click
Search.
6. Optional: If you are reporting on relational data, you can apply more text-based
filtering.
a. To choose specific data item values for the filter condition, in the Values
box, click Specific values and choose the values that you want to filter on.
Tip: You can search for values by typing a string in the Keywords box.
Click the arrow beside Search and select the search parameter that you
want to use. If you select Use Tab as keyword delimiter, you can add a tab
116 IBM Cognos Workspace Advanced Version 10.2.2: User Guide
in the Keywords box only by copying and pasting a tab (or the string you
want to search on with a tab in it), from another application, such as
Notepad.
b. To filter values based on a pattern, in the Values box, click Starts with,
Ends with, Contains,orMatches SQL pattern, and type the pattern in the
Value box.
With the Matches SQL pattern choice, you can filter values by using
standard SQL syntax to create a SQL supported pattern. You can use a %
(percent) symbol to substitute for zero or more characters, or _ (underscore)
to substitute for one single character. For example, the pattern '%a_b_c%'
returns every value that contains the sequence 'a, any character, b, any
character, c' anywhere in the string.
If you search for patterns that include the '%' or '_' characters, specify an
escape character in the Escape character (optional) box. The value must be
a single character. When specified, each occurrence of the escape character
causes the next character to be treated as text and not as a special character.
For example, if you specify '\' as the escape character, entering TEST\% in
the Value box searches for the string 'TEST%' rather than a string that
begins with 'TEST' followed by any other characters. Similarly, entering
TEST\\\% searches for strings that begin with 'TEST\%'.
You can specify whether the filter condition is case-sensitive or not. A
case-sensitive filter is applied only when the data source supports
case-sensitive filtering.
Note: When a filter based on a pattern is converted into a prompt, users are
prompted to specify a pattern when the report is run.
7. Under Values, select your values. If you filter numeric data, select the type of
filter condition that you want to create: Specific values, Comparison,orRange.
8. If you want users to be prompted when they run the report, select the Prompt
for values when report is run in viewer check box.
9. If you want the filter to include null values, select the Include missing values
(NULL) check box.
Creating relational custom groups
Create custom groups to classify existing data items into groups that are
meaningful to you.
You can use custom groups to convert numeric values into broader categories. For
example, you can break down sales results into low, medium, and high categories.
Or you can reduce the number of values into a smaller, more meaningful groups.
For example, you can change a list of employees into separate teams or
departments.
When you create custom groups in a list, a new column is added to the report,
with the name data item (Custom). You can use this new column to group or sort
the report. If you want to show only the new groups, you can delete the original
column.
Procedure
1. Click the column that you want to group on and, from the Data menu, click
Calculate > Define Custom Groups.
Tip: You can click either the column heading or one of the column cells.
Chapter 8. Exploring Relational Data 117

2. Click the New Group Entry icon .
3. To group by values that you select, click New Select Values Group, type a
New group name, select the required values from the Values box, and move
the values to the Selected values box.
4. To group by a range of values, click New Range Group, type a New group
name, and enter the From and To values.
5. If you do not want a group name to appear for remaining values, select Do not
show remaining values. Clicking this option will produce empty cells for
remaining values.
6. If you want the group name for remaining values to match each value, select
Use each remaining value as a group name.
7. If you want to specify your own group name for all remaining values, select
Group remaining values into a single group and type the name that you
want.
8. If you are adding custom groups in a list, under New data item name, select
either the default data item name or type a new data item name.
Combining filter conditions
You can combine two or more filter conditions to do more complex filtering.
Combined filters allow you to create compound conditions that are grouped with
AND or OR conditions.
For example, you want to filter the columns Product line and Year in a report. The
specific data you want to retrieve is the quantity of Camping Equipment sold in
2010 and the quantity of Golf Equipment sold in 2009. To do this, you must create
a complex filter that combines several filter conditions.
Procedure
1. On the toolbar, click the filter icon .
2. Click Edit filters.
3. Click the new button
, select Combined, and click OK.
4. In the Create Filter window, select the data item on which you want to filter
and click OK.
5. Under Condition, select the type of condition you want.
6. Under Values, select your values. If you filter numeric data, select the type of
filter condition that you want to create: Specific values, Comparison,or
Range.
7. If you want users to be prompted when they run the report, select the Prompt
for values when report is run in viewer check box.
8. If you want the filter to include null values, select the Include missing values
(NULL) check box.
9. Click the operator that appears between the filters and click AND, OR,or
NOT to combine them.
10. Click the new condition button
, and specify a second filter condition.
11. Click the operator that appears between the filters and click AND, OR,or
NOT to combine them.
118 IBM Cognos Workspace Advanced Version 10.2.2: User Guide

Filtering based on data items not in the report
You can create a filter using a data item in the source tree that is not included in
your report.
For example, a crosstab shows the sales revenue of all your product line for each
year. You want to filter the crosstab to show the revenue for only one country or
region, which does not appear in the report.
For relational data sources, you can use measures
and query items to
filter.
Procedure
1. Select the data container (list, crosstab, or chart) or the data item within the
container that you want to filter.
2. From the Source tab
, right-click the measure, query item, or level and
click Filter for report.
3. Under Condition, select the type of condition that you want.
4. Optional: If you are reporting on relational data, you can apply more text-based
filtering.
a. To choose specific data item values for the filter condition, in the Values
box, click Specific values and choose the values that you want to filter on.
Tip: You can search for values by typing a string in the Keywords box.
Click the arrow beside Search and select the search parameter that you
want to use. If you select Use Tab as keyword delimiter, you can add a tab
in the Keywords box only by copying and pasting a tab (or the string you
want to search on with a tab in it), from another application, such as
Notepad.
b. To filter values based on a pattern, in the Values box, click Starts with,
Ends with, Contains,orMatches SQL pattern, and type the pattern in the
Value box.
With the Matches SQL pattern choice, you can filter values by using
standard SQL syntax to create a SQL supported pattern. For example, the
pattern '%a_b_c%' returns every value that contains the sequence 'a, any
character, b, any character, c' anywhere in the string.
You can specify whether the filter condition is not case-sensitive or case
sensitive. A case-sensitive filter is applied only when the data source
supports case sensitive filtering.
Note: When a filter based on a pattern is converted into a prompt, users are
prompted to specify a pattern when the report is run.
5. Under Values, select your values. If you filter numeric data, select the type of
filter condition that you want to create: Specific values, Comparison,orRange.
Tip: If you filter text data and want to use your own value, under Selected
Value, click the new button
and specify your value.
6. If you want users to be prompted when they run the report, select the Prompt
for values when report is run in viewer check box.
7. If you want the filter to include null values, select the Include missing values
(NULL) check box.
Chapter 8. Exploring Relational Data 119

Editing filters
You can specify whether filters are mandatory and whether to apply them before
or after automatic aggregation.
Procedure
1. On the toolbar, click the filter button .
2. Click Edit filters.
3. To edit an existing filter, select the filter that you want to edit and click the edit
button
.
Tip: Click the new button
to add new filters.
4. To specify whether the filter is mandatory, in the Usage box, select an option.
5. To specify whether to apply filters before or after automatic aggregation, in the
Application box, select an option.
Removing filters
You can remove a single filter or all filters for your report if they are no longer
needed.
Procedure
1. On the toolbar, click the filter icon .
2. To remove all the filters in your report, click Remove all filters.
3. To remove a single filter, click Edit filters.
4. Select the filter that you want to remove and click the delete icon
.
Suppress Empty Cells in Relational Reporting
Sparse data may result in crosstabs showing empty cells. For example, a crosstab
showings employees and products with a measure of revenue results in empty
cells when the employee does not sell the product.
You can suppress rows, columns, or rows and columns based on divide by zero,
missing, and overflow values. Suppressing rows or columns without data gives
you a more concise view of your report.
IBM Cognos Workspace Advanced performs calculations before applying
suppression. If you have multiple crosstabs or charts, you must select one to access
suppression options.
Access to the suppression feature depends on the settings in your modeling
component, IBM Cognos Transformer, Framework Manager, and IBM
Cognos Administration.
Procedure
1. From the Data menu, click Suppress and click Suppression Options.
2. Under Suppress, choose what sections to suppress.
3. Under Suppress the following, choose which values to suppress.
120 IBM Cognos Workspace Advanced Version 10.2.2: User Guide

Limitations When Formatting Empty Cells in SAP BW Data
Sources
When working with SAP BW data sources, if the SAP BW server administrator
configured custom formatting for empty cells on the SAP BW server, this custom
format does not appear in IBM Cognos Business Intelligence reports. Ask your
administrator to configure the formatting of empty cells in IBM Cognos BI.
Example - Suppress Zeros in Rows and Columns in an
Existing Report
You are a report writer at The Sample Outdoors Company, which sells sporting
equipment. You have a report that compares current year data to previous year
data. You want to suppress zeros in the report to make it more concise. You use
the zero suppression tool to set the level of suppression.
Procedure
1. Open the Sample Outdoors Company Balance Sheet as at Dec. 31, 2012 report.
2. From the Data menu, click Suppress
and click Suppression Options.
3. Under Suppress the following, click Rows and columns.
4. Under Suppress the following type of values, select the Zero values check
box.
5. Run the report.
Rows and columns containing zeros are hidden.
Figure 40. Balance sheet with zero suppression applied in rows and columns
Chapter 8. Exploring Relational Data 121
122 IBM Cognos Workspace Advanced Version 10.2.2: User Guide

Chapter 9. Exploring Dimensional Data
Dimensional data sources include OLAP and dimensionally-modeled relational
(DMR) data sources. The Source tab
in the content pane shows a
member-oriented view of the data.
For dimensional and mixed model data sources, you can view the full data tree by
clicking the View Metadata Tree icon
in the Source tab of the content
pane. You can switch to the dimensional-only data tree by clicking the View
Members Tree icon
.
Note: The names of levels and members in a dimension come from the model. It is
the responsibility of the modeler to provide meaningful names.
1. Package
Packages are subsets of a model, containing items that you can insert in a
report.
2. Dimension
Dimensions are broad groupings of descriptive data about a major aspect of a
business, such as products, dates, or markets.
3. Level hierarchy
Level hierarchies are more specific groupings within a dimension. For example,
for the Years dimension, data can be organized into smaller groups, such as
Years, Current Month, and Last Month.
4. Members folder
Figure 41. A dimensional-only data tree
© Copyright IBM Corp. 2005, 2014 123

Members folders contain the available members for a hierarchy or level. For
example, the Members folder for the Years level hierarchy contains everything
found in the Year, Quarter, and Month levels.
5. Level
Levels are positions within the dimensional hierarchy that contain information
at the same order of detail and have attributes in common. Multiple levels can
exist within a level hierarchy, beginning with a root level. For example, the
Years level hierarchy has the following related levels.
Table 15. The Years level hierarchy
Level Level name Description
Root Years The root level.
First Year Years in the Years root level. For example,
2004, 2003, and 2002.
Second Quarter Quarters for each year in the Year level. For
example, 2004 Q1, 2004 Q2, and 2004 Q3.
Third Month Months for each quarter in the Quarter
level. For example, Jan., Feb., and Mar.
Tip: The Measures dimension contains the measures available in the data
source.
6. Member property
Member properties are attributes that each member possesses. For example,
gender could be a property for all employee members. For more information,
see “Insert a Member Property” on page 127.
Customize the Source Tree
When using dimensional data, you can customize how you see data in the source
tree. You can select a full package tree view that shows dimensions, hierarchies,
levels, an optional members folder, and member properties.
Or you can select a members-only tree view, such as the one in IBM Cognos
Analysis Studio. This view allows you to add only members in your report.
Procedure
1. Click the Source tab .
2. To view the members-only tree view, click the view members tree button
.
3. To view the full package tree, click the view package tree button
.
4. To change what is included in the tree, right-click and click Package Tree
Settings.
Use the Preview pane to choose the appropriate settings.
124 IBM Cognos Workspace Advanced Version 10.2.2: User Guide

Insert a Member
By default, when you insert members from the source tree into your report with
IBM Cognos Workspace Advanced, members are inserted with their children and
are inserted as sets. You can change how members are inserted. For example, you
may want to insert a member without its children or insert only the member's
children.
You can set your report options to insert a member's children when you
double-click a member that you have already inserted in your report. You can
control whether the children are inserted before or after, nested, or not inserted at
all. To do this, from the Tools menu, click Options, and then choose a setting on
the Edit tab.
You can set the default behavior for replacing members to replace individual
nodes, replace the entire edge, or not to replace anything. To do this, from the
Tools menu, click Options, and then choose a setting on the Edit tab.
Note: You cannot change these member insertion and replacing behaviors when
you have opened a widget from a workspace in IBM Cognos Workspace to edit it
in Cognos Workspace Advanced. In this case, double-clicking a member drills
down and replacing members replaces the entire edge.
When inserting members into a crosstab, ensure that you insert members from the
same hierarchy on only one of the crosstab edges. If you insert members from the
same hierarchy on both edges of the crosstab, you may encounter unexpected
results. For example, a report that uses members from years in the rows and
Quarters in the columns is very difficult to read because the useful numbers are
distributed over a large area of mostly blank cells.
Calculated members from the data source also appear in the source tree. However,
calculated members in Microsoft SQL Server Analysis Services (SSAS) cubes do not
appear in the list of descendants in the query. If you want these calculated
members to appear in a report or a prompt, you must insert them explicitly.
Procedure
1. From the Source tab , click the insert member with children button
and select how to insert members.
2. If you want to insert individual members instead of inserting members within
a set, click the insert individual members button
.
3. Do one of the following:
v To insert a member above or below another member, drag the new member
above or below a cell.
A flashing black bar appears where you can drop the new member.
v To replace an entire edge, drag the new member to the cell with the member
to replace.
A flashing black box appears where you can drop the new member.
Search for a Member
You can perform a member search to quickly find the data you want.
Chapter 9. Exploring Dimensional Data 125

You can control the number of members that are returned in a search by specifying
a value for the Member display count limit (in source tree) option.
Procedure
1. From the Source tab , select and then right-click a hierarchy or level
and click Search.
2. In the Keywords box, type the words or characters for which to search.
3. Click the search parameter to use.
4. To search all descendants instead of just the immediate children, select the
Search all descendants check box.
For example, when performing a search in a hierarchy, selecting this check box
returns members found in all the levels of the hierarchy.
5. Click Search.
Results
The search results appear in a hierarchical structure on the Search tab .You
can browse the hierarchy to explore members at lower levels.
Tip: You can insert members directly from the Search tab into a report. This can
save you time, because you do not have to define a filter. For example, instead of
inserting Product line from the Source tab and adding a filter for Camping
Equipment, you can insert Camping Equipment from the Search tab.
Nest Members
When you insert members in your report, you may want to nest them in another
row or column to make your report easier to use. You can nest members from
different dimensions. You can also nest sets.
For example, in the following report, the quarters (Q1 to Q4) were selected from
the Time dimension and nested only for the GO Americas member, which is from
a different dimension.
When you filter out children from nested sets, the parent set still appears in your
report. To avoid this, filter only the top level set and nest only the complete set of
descendants at the desired levels.
Figure 42. Crosstab showing the year to date amount for all four quarters nested beside GO
Americas
126 IBM Cognos Workspace Advanced Version 10.2.2: User Guide

Procedure
From the Source tab , drag the members to the work area.
A flashing black bar indicates where you can drop an item.
Insert a Hierarchy
You can quickly insert entire hierarchies in a report.
When using an IBM Cognos PowerCube, a SSAS cube, or a dimensionally-modeled
relational data source, you can insert multiple hierarchies from the same dimension
in a crosstab. For example, you can place one hierarchy from a dimension on an
edge of the crosstab and nest another hierarchy from the same dimension on the
same edge, on another edge, or in the Context filter area.
You can also perform arithmetic, percentage, and ranking calculations using
multiple hierarchies.
Summary or analytic calculations that refer to different hierarchies from the same
dimension, such as total, count, average, minimum, and maximum, are not
supported. These calculations cause an OP-ERR-0250 error.
Procedure
1. From the Source tab , drag the hierarchy to the report.
2. In the Insert Hierarchy dialog box, choose which members to insert:
v To insert only the root members of the hierarchy, click Root members.
v To insert all members of the hierarchy, click All members.
Tip: The default Level Indentation property for all members is to show the
hierarchical structure when the report is run.
Insert a Member Property
You can insert member properties, which are attributes of a member, in your
report. Member properties provide additional information about the member. For
example, an employee level may have a property named gender.
About this task
In the data tree of the Source tab , member properties are identified by the
icon
.
You can only insert properties. You cannot group them. Do not insert member
properties in the series or categories of a chart because by default, IBM Cognos
Report Studio groups items that are inserted in these areas. Grouping member
properties produces a warning when you validate the report.
Procedure
From the Source tab , drag the member property to the report.
Chapter 9. Exploring Dimensional Data 127

Create a Set of Members
Use sets to group members that are logically related for various actions, such as
formatting, nesting, and sorting.
Creating sets is also useful when members may be dynamic over time. For
example, the child accounts of a total assets account may change from year to year.
By creating a set, you do not have to modify the report each time accounts are
added or removed.
By default, IBM Cognos Workspace Advanced creates sets when you add members
in a report.
After you create a set of members, you can add or remove members within the set.
Procedure
1. From the Source tab , click the create sets for members button to
toggle between adding individual members and creating sets for members.
2. Select the items to include in the set and drag them to the work area.
3. To add or remove members from the set, right-click the set and click Edit
Members.
Excluding members from a set
You can choose to remove individual items that are not needed in your analysis.
You can exclude one or more members from the original set you added to your
report, or you can exclude one or more members from the set as it is displayed in
your report.
Procedure
1. To exclude members from the original set, click the members, click the Explore
icon
, click Exclude Members, and click From Initial Set.
2. To exclude members from the current set, click the members, click the Explore
icon, click Exclude Members, and click From Current Set.
Tip: To edit a set, regardless of whether you exclude members, click the
Explore icon and click Edit Set.
Moving members within a set
You can move one or more members to the top or bottom of a set.
Procedure
1. Select the member or members that you want to move.
2. Click the Explore icon
.
Tip: You can also right-click the selected members, then click Explore.
3. Click Move Members, then click To Top or To Bottom.
128 IBM Cognos Workspace Advanced Version 10.2.2: User Guide

Results
The members are moved to the bottom or top of the set. You might need to repeat
these steps to achieve the order for the members that you want.
Tip: To undo the move, click the Explore icon, then click Edit Set.
Replace a Member or Set
You can replace an individual member or a set of members with a preset
combination of members.
You can replace an individual member or a set of members with any of the
following:
v its child members
v members on its level
v a new set made up of some members from the original set
v individual members from the set that have been separated from the set
v an intersection
Procedure
1. To replace a member with its child members or a set of members with the child
members of the selected member, click a member, click the explore button
,
click Replace, and click With Children Members.
2. To replace a member with its level members or a set of members with the level
members of the selected member, click a member, click the explore button, click
Replace, and click With Level Members.
3. To replace a set of members with one or more individual members, select the
members you want to keep, click the explore button, click Replace, and click
With Individual Members.
4. To replace a set of members with a set made of a few members, select the
members you want in the new set, click the explore button, click Replace, and
click With Set of Selected Members.
5. To replace members or sets with an intersection, select a member or set on each
edge of the crosstab, click the explore button, click Replace, and click With
Intersection (Tuple).
Create Members and Intersections
You can create individual and combinations of members that are separate from the
set.
You can add any of the following to your report:
v duplicates of individual members separate from the set
v child members of each of the members in the set as a new column
v an intersection of two or more members from different hierarchies as a new row
or column
Procedure
1. To create individual members, select the members, click the explore button
, click Create, and click Individual Members.
Chapter 9. Exploring Dimensional Data 129

2. To add child members, click a member, click the explore button, click Create,
and click Next Level Down.
3. To create an intersection, select the two data members you want to intersect,
click the explore button, click Create, and click Intersection (tuple).
Expand and Collapse a Member
You can expand a member to add its child members indented below it as new
rows or columns and you can collapse expanded members.
Procedure
1. To add a member's child members, click the member, click the explore button
, and click Expand Member.
Tip: You can also right-click the member.
2. To remove the expanded member's child members, click the member, click the
explore button, and click Collapse Member.
Sharing sets between reports
When you are working with dimensional data, you can share a set to make it
available for inclusion in multiple reports.
You must first create a set in a source crosstab report, create a shared set definition,
then refer to it in a target report.
A shared set definition is copied from one report to another. As a result, the set
definition must not depend on any context from the source report. For example, it
must meet the following criteria:
v It cannot reference other shared sets.
v It cannot reference other data items.
v It cannot contain calculated members.
You cannot change the definition of a shared set from within the target report.
However, you can carry out other set operations on it, such as excluding a member
or creating a top 10 list.
Procedure
1. In the source crosstab report, create a set that you want to share.
2. Select the set. In the Properties pane, in the Sharing property, enter a name
and description for the set.
3. Save the report.
4. In the Source tab
, right-click the model. Click Add Shared Set Report.
5. In the Open box, select the source report that contains the shared set
definition. If it does not exist, a new folder that is called Shared Sets is
created. It is displayed at the bottom of the source tree.
6. Optional: To add, delete, or change the order of reports in the Shared Sets
folder, right-click the folder and click Manage Shared Set Reports.
7. Create or open a crosstab target report that you want to refer to the shared set
definition.
130 IBM Cognos Workspace Advanced Version 10.2.2: User Guide

8. In the Source tab , open the Shared Sets folder. Open the source report
that contains the shared set definition that you want to use.
9. Add the shared set definition into your target report.
10. Right-click the shared set in the target report and click Edit Set.
11. In the Set Definition box, select the shared set.
12. Click Edit
. The Set Reference Properties window opens.
13. Set the Inclusion property.
a. Select Run time to retrieve the latest shared set definition every time that
the report runs.
b. Select Design time to store the shared set definition in the target report.
This definition is used until you refresh it.
14. Click OK, then save the report.
Managing shared set references
After you share a set to make it available for inclusion in multiple reports, you can
manage references to it. You can also copy it locally.
You can manage set references in the following ways:
v Create a copy of a shared set to be used in a report.
Converting a shared set reference into a copy replaces the reference with a set
definition that is stored in the report. The report does not reference the shared
set from the source report. Any changes that are made to the shared set in the
source report are not reflected in the target report. Instead of converting the
reference to a copy, you can change the Inclusion property of the reference to
Design time. Design time references use a static stored version of the shared set
definition. However, you can later change the Inclusion property to be Run
time to use the latest shared set definition.
v Modify the properties of a set reference in the target report, including its
Inclusion property. You can also modify a set reference in the target report by
changing the set definition it refers to.
v Refresh an existing set reference after a set changed in a source report and you
want to use the updated set. To use the updated set if the Inclusion property is
set to Design time, you must refresh its reference.
v Review problems with an existing set reference.
Procedure
1. Open the target report that contains the reference to the shared set that you
want to work with.
2. Click Tools > Manage Shared Set References.
3. To create a copy of a shared set to be used in a report, do the following steps:
a. Select the shared set reference that you want to copy.
b. Click Convert Reference to Copy. The Confirm Convert window is
displayed.
c. If you want to convert the set reference into a copy that is stored in this
report, click Yes. If you do not want to create a copy, click No.
Important: If you convert the set reference into a copy, it is not updated
when the set in the original report changes.
4. To modify an existing set reference in a target report, do the following steps:
Chapter 9. Exploring Dimensional Data 131

a. Select the shared set reference that you want to modify.
b. Click Edit Reference.
c. To modify the set reference properties, select the reference, then click Edit
. The Set Reference Properties window opens. You can now modify the
set reference properties.
d. To modify the definition of the set, click New
. The Set Definition
window opens. You can now modify the set definition.
5. To refresh an existing set reference after a set changed in a source report, do the
following steps:
a. Select the set reference that you want to refresh.
b. Click Refresh Reference.
6. To review problems with an existing set reference in a target report, do the
following steps:
a. Select the set reference that is causing the problem.
b. Review and act upon the message that is displayed.
7. Save the report.
Join Multiple Sets
If you have more than one set in your report and you want to perform operations
on both sets, you can join multiple sets into one large set.
Procedure
Select the sets, click the explore button , click Union into One Set, and click
Remove Duplicates or Keep Duplicates.
Tip: To edit the union, click the explore button
, and click Edit Set.
Edit the Operations Performed on a Set
You can view the definition of a set to see, change, add, or delete operations that
are performed on the set.
The definition of a set shows you, in the graphical tree, the history of all the
operations that are performed on the set.
You can see and change the order in which the operations are performed. For
example, you apply a top three filter and then exclude one member. Your set now
contains only two members. You can choose to exclude the member before the top
three filter so that your set still contains three members.
Procedure
1. Select a set.
2. Click the explore button
and click Edit Set.
Tip: You can also right-click the set and click Edit Set.
A graphical tree shows all the operations that are performed on the set of
members.
132 IBM Cognos Workspace Advanced Version 10.2.2: User Guide

3. To see the details of an operation, hover your mouse over an operation node.
4. To change the order of an operation, click the operation node, and click the
right or left arrow.
5. To edit an operation, click the operation node and click the edit button
.
6. To add a new operation, click the new button
.
Create Page Layers
When working with dimensional data, you can create page layers in a report to
show values for each member on a separate page. For example, your report
contains payroll information for the entire company. You want to view values for
each department on a separate page.
After you create page layers, a caption appears in the header to indicate the
contents of each page. You can navigate between the different pages using links
below the report.
Creating page layers is similar to using context filters. However, with context
filters, values are filtered according to the member you add to the Context filter
area. With page layers, the report is split into a separate page for each child of the
member you add to the Page layers area.
When you produce reports in Excel 2007 format, you can configure IBM Cognos
Business Intelligence to dynamically name the Excel worksheet tabs, based on the
data items that are used to break pages. For example, you specify to break pages
by Product line. In Excel 2007 output, the five worksheet tabs that are generated
are named Camping Equipment, Mountaineering Equipment, Personal Accessories,
Outdoor Protection, and Golf Equipment. To dynamically name Excel worksheet
tabs, ask your administrator to add the
RSVP.EXCEL.PAGEGROUP_WSNAME_ITEMVALUE advanced setting to the
report service. For more information, see the IBM Cognos Business Intelligence
Administration and Security Guide.
Procedure
1. In the source tree, select or search for one or more items on which to filter.
2. Drag the item into the Page layers section of the overview area.
The crosstab shows the results for the children of the selected item on separate
pages, and a list appears under Page layers.
Tip: To navigate between pages, click Page down and Page up below the
report.
3. To replace the page breaks with items from the same dimension, select an item
from the list. To delete the page breaks, from the list, click Delete. To delete all
the page breaks, right-click the Page layers area and click Delete All.
Related tasks:
“Dividing data into sections” on page 167
Create sections in a report to show a separate list, chart, visualization, or crosstab
for a data item.
Chapter 9. Exploring Dimensional Data 133

Sort Dimensional Data
You can sort items to view them in your preferred order. For example, if your bar
chart shows revenue for each product line by sales region, you can display product
lines from the most revenue to the least across the x-axis.
By default, IBM Cognos Workspace Advanced retrieves items in the order defined
in the data source. OLAP data sources always have a defined order.
Dimensionally-modeled relational data sources may not always have a defined
order; the data modeler defines the sorting options in the model. For more
information about data modeling, see the IBM Cognos Framework Manager User
Guide.
Sorting members in a set by their labels
You can sort the members within a set based on their labels or captions.
For example, a set contains geographical regions and you want to sort the regions
within the set in descending alphabetical order.
By default, when you select Sort Set - Ascending or Sort Set - Descending, sets
are sorted based on captions. You can also perform advanced sorting to sort sets
using an intersection (tuple) or using a member property.
Only extended data items that represent sets support set sorting. This type of
sorting is performed in the query.
Note: Before you can perform this sorting, you must first create sets for the
members in your report.
You cannot sort data items from different dimensions that are intermixed.
Procedure
1. Select a set to sort.
2. Click the sort button
and under Sort by Label, click Ascending or
Descending.
Tip: To remove a sort order, click Don't Sort.
Related tasks:
“Create a Set of Members” on page 128
Use sets to group members that are logically related for various actions, such as
formatting, nesting, and sorting.
Sorting sets by value
You can sort members in the sets on the opposite axis based on the value of a
member or measure that you select.
For example, a crosstab contains years inserted as individual members in the
columns, product lines inserted as a member set in the rows, and revenue as the
measure. You select 2012, click the sort button
and sort by value in
descending order. The values in the 2012 column are sorted.
134 IBM Cognos Workspace Advanced Version 10.2.2: User Guide

Note: Before you can perform this sorting, you must first create sets for the
members in your report.
In nested crosstabs, items are sorted based on the values of the innermost nested
row or column of the opposite axis. For example, a crosstab contains years in the
columns and retailers nested within product line in the rows. Select 2012, sort in
descending order, and you see retailers listed from the largest value to the smallest
value for each product line.
Procedure
1. Select a member or measure to sort.
For example, to sort a set in the row axis, select a member or measure in the
column axis.
2. Click the sort button
, and under Sort by Value, click Ascending or
Descending.
Tip: To remove a sort order, click Don't Sort by Value.
Related tasks:
“Create a Set of Members” on page 128
Use sets to group members that are logically related for various actions, such as
formatting, nesting, and sorting.
Sorting sets by member properties or tuples
You can perform advanced sorting in a report to sort a row or column by a
member property or tuple.
You can sort using the property of a member. For example, your report includes
employee names and you want to sort the employees using the gender property.
You can also sort using an intersection of members, also known as a tuple. For
example, you want to sort the employees using the value of sick days taken for the
year 2006.
Before you begin
Before you can perform this sorting, you must first create sets for the members in
your report.
Procedure
1. Select a set to sort.
2. Click the sort button
on the toolbar, and click Edit Set Sorting.
3. Specify the sorting options that you want.
Figure 43. A crosstab sorted in descending order by revenue in 2012
Chapter 9. Exploring Dimensional Data 135

4. If you are sorting members from different levels and want to preserve the
hierarchy, select the Hierarchized sorting check box.
5. If you want to sort items using a member property, under Sort by, click
Property and click the drop down arrow to select the member property you
want to use.
6. If you want to sort items using an intersection of members, or tuple, under Sort
by, click Intersection (tuple) and click the ellipsis (...) button. Then, from
Available members and measures, select the items you want to use and click
the right arrow to move them to the Intersection members and measures list.
Related tasks:
“Create a Set of Members” on page 128
Use sets to group members that are logically related for various actions, such as
formatting, nesting, and sorting.
Format Dimensional Data
Format data in a report to improve readability. For example, you can show all date
values in the order year, month, and day. If you do not specify any formatting,
data is formatted according to the properties set in the model. If the properties
were not set in the model, data is formatted according to the International
Components for Unicode (ICU) formats.
You can also format data based on a condition.
When using an IBM Cognos cube or a SAP BW as a data source, mixed currency
values use the asterisk character (*) as the unit of measure. Mixed currency values
occur when you calculate values with different currencies.
Data formats are not applied in delimited text (CSV) and XML report outputs.
Procedure
1. In the work area, right-click a data item and click Style, Data Format.
Tip: You can also use the data format button
in the style toolbar.
2. In the Format type box, click a format type.
The properties that you can set for the selected format type appear in the
Properties box.
3. Set the properties that you want.
For properties in which you type meta-characters that represent certain types of
information, such as YYYY-MM-DD for dates, the meta-characters required
depend on the authoring language specified for the report.
If you specify a value for the Pattern property, all other formatting properties
are ignored, with the following exceptions:
v Missing Value Characters
v Zero Value Characters
v Negative Pattern
Some properties are locale-sensitive and should only be changed with caution.
Results
The data formatting properties are applied. If a data item contains values in
multiple currencies, but only a subset of those currencies have defined formats, the
136 IBM Cognos Workspace Advanced Version 10.2.2: User Guide
default format for the locale you are working in is applied to values for which no
format is specified.
Related concepts:
“Support for bidirectional content” on page 169
You can author reports that support bidirectional content. You can specify base text
direction, digit shaping, and container direction.
Specifying the Number of Decimals in Numbers
When specifying the number of decimals, IBM Cognos Business Intelligence uses
the IEEE 754 default rounding mode known as half even.
With half even rounding, numbers are rounded toward the nearest truncated value,
unless both truncated values are equidistant, in which case the value ending in an
even digit is chosen, as follows:
v If the digit immediately after the precision to be shown is greater than 5, the
number is rounded up.
v If the digit immediately after the precision to be shown is less than 5, the
number is rounded down.
v If the digit immediately after the precision is a 5, the number is rounded down
when the preceding digit is even and rounded up when the preceding digit is
odd.
For example, the number 78.5 is rounded to 78, while the number 73.5 is
rounded to 74.
In addition, if the maximum number of decimals is lower than the actual number
of decimals in the number, the number is rounded to the maximum number of
decimals.
Locale-sensitive Properties
IBM Cognos Workspace Advanced contains an extensive library of customized
properties adapted to users from different regions who speak different languages.
For example, if a modeler specifies that a given data item is a currency, only the
proper currency symbol must be specified. When reports are created, Cognos
Workspace Advanced automatically adapts the format of the currency numbers to
each user according to the content language specified in IBM Cognos Connection.
When modelers or report authors specify properties, these properties override user
preferences and risk creating inconsistent formatting for users of other cultures. It
is usually much easier and safer to let Cognos Workspace Advanced take care of
formatting. For example, for the date format type, different regions use different
characters to represent the date separator. If you specify a date separator, you may
confuse users in other regions.
The following data formatting properties are locale-sensitive:
v Currency Symbol Position
v Date Separator
v Date Ordering
v Calendar Type
v Time Separator
v Display AM/PM Symbols
v Clock
Chapter 9. Exploring Dimensional Data 137
v Decimal Symbol
v Negative Sign Position
v Thousands Separator
v Group Size (digits)
v Secondary Group Size (digits)
v Missing Value Characters
v Zero Value Characters
v Pattern
v Negative Pattern
Digit shaping in charts
When working with bidirectional content, you cannot specify digit shaping at the
chart level. You can specify digit shaping for the objects in charts.
To understand how digit shaping is applied to charts, you must know which chart
objects are considered text and which objects are considered numeric values.
The following list describes those chart objects that are considered text.
v chart title
v subtitle
v footer
v notes
v legend item
v legend title
v regression label
v marker label
v background image label
v axis titles
v discrete axis label (for example, category axis label, x-axis)
v baseline labels
The following list describes those chart objects that are considered numeric values.
v numeric axis label (for example, measure axis label, y-axis)
v numeric values that appear in the legend (you can select to show the first, last,
maximum, minimum value for each item in legends)
v numeric values that appear in the chart
The following list describes the different digit shaping options and how digit
shaping is applied to charts.
v The digit shape options for text objects, which include titles, footers, and labels,
are Default, None, National, and Contextual. Digit shape options for numeric
values are Default, None, and National. There is no Contextual option for
numeric values.
v By default, digit shaping is not applied to numbers that appear on an object that
is considered text. For example, if a chart shows year data on the x-axis and the
content language specified in IBM Cognos Connection is Arabic (Egypt), no digit
shaping is applied because the x-axis label is considered a string.
138 IBM Cognos Workspace Advanced Version 10.2.2: User Guide

The following list describes the default digit shaping behavior for charts when the
content language is Arabic (Egypt).
v Numeric values that have a specific format, such as decimal or currency, are
displayed as Arabic-Indic.
v Except for matrix charts, numeric axis labels for charts are displayed in
European digits.
This is due to the way that charts are rendered. The engine used to render charts
does not perform any formatting for numeric axis labels. No locale information
is passed, and consequently the labels are displayed as European digits. To
display the labels as Arabic-Indic, select the digit shaping option National.
Matrix charts are rendered using International Components for Unicode (ICU) to
format numbers. Locale information is passed and the numbers are shaped
accordingly. For example, when the content language is Arabic (Egypt), ICU
displays numbers as Arabic-Indic.
v Numbers within text labels are displayed as is. That is, no digit shaping is
applied.
The following list describes the default digit shaping behavior for charts when the
content language is Thai.
v Numeric values that have a specific format, such as decimal or currency, are
displayed as European digits.
v Numbers within text labels are displayed as is. That is, no digit shaping is
applied.
Related concepts:
“Support for bidirectional content” on page 169
You can author reports that support bidirectional content. You can specify base text
direction, digit shaping, and container direction.
Suppress Empty Cells in Dimensional Reporting
Sparse data may result in crosstabs showing empty cells. For example, a crosstab
that matches employees with products results in many rows of empty values for
the revenue measure if the employee does not sell those products.
You can suppress rows, columns, or rows and columns based on divide by zero,
missing, and overflow values. Suppressing rows or columns without data gives
you a more concise view or your report.
Calculations are performed before suppression is applied. If you have multiple
crosstabs or charts, you must select one in order to access suppression options.
Access to the suppression feature depends on the settings in your modeling
component, IBM Cognos Transformer, IBM Cognos Framework Manager, and IBM
Cognos Administration.
You can also use filters to suppress null cells in your reports. Using filters ensures
that calculations take suppression into account. You may also obtain better report
performance because the filtering is done at the data source.
Procedure
1. From the Data menu, click Suppress and click Suppression Options.
2. Under Suppress, choose what sections to suppress.
Chapter 9. Exploring Dimensional Data 139

3. Under Suppress the following, choose which values to suppress.
Related tasks:
“Filtering dimensional data” on page 150
Use filters to remove unwanted data from reports. Data is shown in the report
only if it meets the filter criteria.
Limitations When Formatting Empty Cells in SAP BW Data
Sources
When working with SAP BW data sources, if the SAP BW server administrator
configured custom formatting for empty cells on the SAP BW server, this custom
format does not appear in IBM Cognos Business Intelligence reports. Ask your
administrator to configure the formatting of empty cells in IBM Cognos Business
Intelligence.
Example - Suppress Zeros in Rows and Columns in an
Existing Report
You are a report writer at The Sample Outdoors Company, which sells sporting
equipment. You have a report that compares current year data to previous year
data. You want to suppress zeros in the report to make the report more concise.
You use the zero suppression tool to set the level of suppression.
Procedure
1. Open the Sample Outdoors Company Balance Sheet as at Dec. 31, 2012 report.
2. From the Data menu, click Suppress
and click Suppression Options.
3. Under Suppress the following, click Rows and columns.
4. Under Suppress the following type of values, select the Zero values check
box.
5. Run the report.
Rows and columns containing zeros are hidden.
Summarize Dimensional Data
Summarize data in your reports to obtain a total, count, average, minimum,
maximum, and so on.
Figure 44. Balance sheet with zero suppression applied in rows and columns
140 IBM Cognos Workspace Advanced Version 10.2.2: User Guide

After you add summary rows or columns, you can move them by dragging them
elsewhere in the report.
You can also use summary functions in custom calculations.
The following table defines the different types of summaries.
Table 16. Descriptions of types of summaries for dimensional data
Summary Description
Automatic Summary Uses the default summary for the data item,
as specified in the data source.
For example, a data item that represents part
numbers likely uses count as the default
summary.
Total Adds all values, excluding null and missing
values.
Count Counts all values, excluding null and
missing values.
Average Adds all values, and then divides by the
count of values, excluding null and missing
values.
Minimum Selects the smallest value, excluding null
and missing values.
Maximum Selects the largest value, excluding null and
missing values.
Procedure
1. Click the row or column to summarize.
2. On the toolbar, click the summarize button
and select a summary type.
The summary appears as a new row or column.
3. To change the summary label, right-click the label and type a new name, such
as Total (February sales).
Tip: To remove a summary, select the summary label, and click the delete
button
.
Related concepts:
“Using Dimensional Calculations” on page 143
Insert a calculation to make your report more meaningful by deriving additional
information from the data source. For example, you create an invoice report, and
you want to see the total sale amount for each product ordered. Create a calculated
column that multiplies the product price by the quantity ordered.
Creating dimensional custom groups
Create custom groups to classify existing data items into groups that are
meaningful to you.
Chapter 9. Exploring Dimensional Data 141

You can reduce the number of values into smaller, more meaningful groups. For
example, you can change a list of employees into my team and others.
When you are working with dimensional data and crosstabs or charts, you can
create custom groups only on sets of members. After you create a custom group in
a set, the members in the set are replaced by the custom groups.
When you create custom groups in a list, a new column is added to the report,
with the name data_item (Custom). You can use this new column to group or sort
the report. If you want to show only the new groups, you can delete the original
column.
When you are creating custom groups on sets of members, consider the following
constraints:
v Members included in a custom group must be from the same level in a
hierarchy.
v If you insert a hierarchy that is used in a custom group elsewhere in the data
container, it must be inserted as a sibling of the custom group.
v Automatic aggregation on a custom group might not work as expected. For
example, you might encounter error cells (- -).
Procedure
1. To quickly add custom groups in a crosstab that includes sets of members, do
the following steps:
a. Select the members that you want to include in a custom group.
b. Right-click one of the selected members, then click Explore > Create a
Custom Group from selected items. The custom group is created.
c. To change the name or composition of the custom group, right-click it,
then click Explore > Edit custom_group_name.
2. To quickly add members to a custom group in a crosstab that includes sets of
members, do the following steps:
a. Select the members that you want to include in an existing custom group
and select the custom group.
b. Right-click the custom group, then click Explore > Add to
custom_group_name.
3. To quickly ungroup a custom group in a crosstab that includes sets of
members, do the following steps:
a. Right-click the custom group, then click Explore > Ungroup
custom_group_name.
4. To add custom groups in a crosstab or chart that includes sets of members, do
the following steps:
a. Right-click a set and click Edit Set.
b. Click New
and select Custom Grouping.
c. In the Custom Grouping window, click New Custom Group
.
d. Type a New group name.
e. Select members from the Available members list and move them to the
Members list.
5. To add custom groups to a list, do the following steps:
142 IBM Cognos Workspace Advanced Version 10.2.2: User Guide

a. Click the column that you want to group on and from the Data menu,
select Calculate > Define Custom Groups.
Tip: You can click either the column heading or one of the column cells.
b. Click New Group Entry
.
c. To group by values that you select, click New Select Values Group, type a
New Group Name, select the required values from the Values box, and
move the values to the Selected Values box.
d. To group by a range of values, click New Range Group, type a New
Group Name, and enter the From and To values.
6. To quickly make other changes, do the following steps:
a. Right-click the custom group and click Edit set.
b. In the Set Definition window, select the custom grouping and click Edit
.
The Custom Grouping window opens.
7. If you do not want a group name to be displayed for remaining values, select
Do not show remaining values. Clicking this option produces empty cells for
remaining values.
8. If you want the group name for remaining values to match each value, select
Use each remaining value as a group name.
9. If you want to specify your own group name for all remaining values, select
Group remaining values into a single group and type the name that you
want.
10. If you are adding custom groups in a list, under New data item name, select
either the default data item name or type a new data item name.
Using Dimensional Calculations
Insert a calculation to make your report more meaningful by deriving additional
information from the data source. For example, you create an invoice report, and
you want to see the total sale amount for each product ordered. Create a calculated
column that multiplies the product price by the quantity ordered.
You build calculations in the expression editor using functions.
If a calculation is used in multiple reports, or by different report authors, ask your
modeler to create the calculation as a standalone object in the model and include it
in the relevant package.
Calculation Solve Order
When calculations in the rows and columns of a report intersect, calculations are
performed in the following order:
v addition or subtraction
v multiplication or division
v aggregation (rollup)
v remaining arithmetic functions: absolute, round, round down, average,
minimum, maximum, medium, count
v percentage, % difference (growth) or % of total
v rank, quartile, quantile, or percentile
Chapter 9. Exploring Dimensional Data 143
If both calculations have the same precedence, for example, if they are both
additions, then the row calculation takes precedence.
If you have the necessary permissions, you can open your report in IBM Cognos
Report Studio and override the order of precedence by changing the solve order
property for a data item. For more information, see the Report Studio User Guide.
Limitations of Calculations
Use only the expressions and functions available in Cognos Workspace Advanced,
and follow their syntax. For best results, do not build calculations or summaries
over other calculations that were authored in Report Studio.
Minimal checking exists for calculations. If your calculation uses an invalid
expression, your report results may contain unexpected values.
In addition, you should define member summaries as follows:
summary_function (currentMeasure within set set_reference)
where set_reference is a level or set inserted from the Source tab
.
Unless otherwise required, summary_function should be the aggregate function. If
you use an explicit summary function, you may encounter problems with
measures (such as profit margin, distinct count, and so on) that have complex
rollup values, and/or scenario or account dimension members that do not roll up.
Know your data, and confirm with the owner of the cube where overriding the
automatic aggregation is safe.
Because of the these limitations, summaries of calculations may not provide
reliable values. For convenience, you may need to build reports where row
summaries and calculated member columns intersect. In such reports, these
intersections may contain unexpected values. In contrast, row calculations
intersecting with column aggregates using the aggregate function are safe because
the calculation is performed on the reliably summarized values.
If you need to create more complex expressions, use Report Studio.
Create a Simple Member Calculation
When working with dimensional data sources, you can select members in your
report and create simple calculations. In addition to simple arithmetic calculations,
you can perform numeric, string, date and time, and interval calculations.
The following table defines the available numeric calculations.
Calculation Description
- data item When you select one numeric data item ,
inserts the negative of the current value.
Absolute For numeric data items, inserts the absolute
value.
144 IBM Cognos Workspace Advanced Version 10.2.2: User Guide

Calculation Description
Round For numeric data items, inserts a number
rounded to the nearest integer.
Round up For numeric data items, inserts a number
rounded to the nearest integer.
Round down For numeric data items, inserts a number
rounded to the integer closest to zero.
Rollup Summarizes, or rolls up, all the values in a
hierarchy.
% Calculates the value of the first item selected
as a percentage of the second item.
% Difference Calculates the difference between two items
as a percentage.
% Of Base Takes the first selected member from edge A
and the second selected member from edge
B. The calculation result of a percent of base
compare all of the values for member A to
the intersect value of members A and B.
Note: This calculation is only available if
you select two members from different
hierarchies, each from a different edge.
Custom Allows you to specify your own value when
performing a simple arithmetic calculation.
Also allows you to change the order of
operands, or type a custom name for the
new calculated row or column.
The following table defines the available string calculations.
Calculation Description
Remove trailing spaces For string data items, removes any extra
spaces that appear after the last character in
the string. Spaces between words are not
removed.
Extra spaces can sometimes cause
unexpected results when you sort, filter, or
search.
First ? characters For string data items, truncates the text to
show only the first number of characters
that you specify.
Last ? characters For string data items, truncates the text to
show only the last number of characters that
you specify.
Chapter 9. Exploring Dimensional Data 145

The following table defines the available date and time calculations.
Calculation Description
Add ? years, Add ? months, Add ? days,
Add ? hours, Add ? minutes,orAdd ?
seconds
When selecting one date or time data item,
adds the specified number of years, months,
days, hours, minutes, or seconds to the
selected value.
Year, Month, Day, Hour, Minute, and
Second
When selecting one date or time data item,
shows the year, month number, day number,
hour, minute, or second value.
Years between, Months between, Days
between, Hours between, Minutes
between, and Seconds between
When selecting two date or time data item,
shows the number of years, months, days,
hours, minutes, or seconds between the two
value.
The following table defines the available interval calculations.
Calculation Description
Days For interval data items, such as number of
days between two dates
If you want to create a more advanced calculation that uses mathematical functions
or if you want to create a calculated member, calculated measure, set expression, or
value expression, instead create a query calculation.
Procedure
1. Select the items in your report to calculate.
Tip: Shift+click or Ctrl+click to select multiple items.
2. Click the insert calculation button
and select the calculation to perform.
Note: Only calculations that are applicable to the items that you have selected
appear.
3. To change the order of the operands or the name of the calculated item added
to the report, click Custom.
Results
The calculation appears as a new row or column in your report.
Limitations When Summarizing Measures in DMR Data
Sources
There are limitations when summarizing dimensionally-modeled relational (DMR)
measures and semi-additive measures in crosstabs using the aggregation function
count distinct, median, standard-deviation,orvariance. The following
limitations can produce empty or error cells when the report is run:
146 IBM Cognos Workspace Advanced Version 10.2.2: User Guide
v The aggregation function must apply to all members of a level or all children of
a member.
v Error cells are produced when drilling down on a crosstab that has two nested
levels.
If you do not consider these limitations in a calculation, the report may return
inaccurate results.
Creating a Query Calculation
When working with dimensional data, insert a query calculation into your report
to add a new row or column with values that are based on a calculation. For
example, you create a query calculation named Euros that converts dollars to euros
by multiplying an existing dollar measure by a conversion rate. Euros can then be
displayed to end users in a separate row or column.
In IBM Cognos Workspace Advanced, you can create the following types of
calculations:
v Create calculated members or calculated measures where the expression is a
member or a tuple-based (as opposed to property-based) value expression. For
example, [2005] - [2004] is a calculated member and [Revenue] - [Planned
Revenue] is a calculated measure.
v Use set expressions to create calculated sets of members. For example, children
([2004]) is a set expression that displays the child members of 2004.
You must base each set expression on a hierarchy and the set expression must
contain only members from this hierarchy.
v Create value expressions when you want to insert a string, number, date, or
interval value.
You can also create a calculation that uses an intersection (tuple) that you already
defined.
Assigning a Hierarchy or Dimension
You must assign each query calculation to a hierarchy or dimension. For best
results, select the hierarchy or dimension upon which your calculation focuses. For
example, if your calculated member is based on years, select the Time hierarchy. If
you create a calculated measure, select the Measures dimension.
Select only a hierarchy that cannot affect the value of the calculation. For example,
the hierarchy Camping Equipment has the same value regardless of its Products
context as it appears in the report. Therefore,
v the calculation ([Camping Equipment]-[Mountaineering Equipment]) has a
well-defined meaning only in the Products hierarchy, so select that hierarchy.
v the calculation tuple ([Revenue], [Camping Equipment]) can be assigned to
either the Products or Measures hierarchy, as it is not affected by either context.
v the calculation ([Revenue] - [Camping Equipment]) does not have a well-defined
meaning in any hierarchy, and is not reliable.
Automatic Database Aggregation
You can use automatic database aggregation only when using IBM Cognos
PowerCubes and Microsoft SQL Server 2005 Analysis Services (SSAS) data sources.
Chapter 9. Exploring Dimensional Data 147

Quality of Service Indicators
Not all data sources support functions the same way. The data modeler can set a
quality of service indicator on functions to give a visual clue about the behavior of
the functions. Report authors can use the quality of service indicators to determine
which functions to use in a report. The quality of service indicators are as follows:
v not available (X)
This function is not available for any data source in the package.
v limited availability (!!)
The function is not available for some data sources in the package.
v limited support (!)
The function is available for all data sources in the package but is not naturally
supported for that data source. IBM Cognos Business Intelligence uses a local
approximation for that function. This approximation may cause poor
performance and unexpected results.
v unconstrained (no symbol)
The function is available for all data sources.
Using Quotation Marks in Literal Strings
When inserting literal strings in an expression, you must enclose the string in
single quotation marks. If the string contains a quotation mark, it must be
modified. For example, if you want to insert the string ab'c, you must type 'ab''c'.
Create a Query Calculation
If you are using a IBM DB2
®
data source, the subtract operator is invalid if you
combine the datatypes timestamp2 and packed decimal.
When creating an expression that for use in a double-byte environment, such as
Japanese, the only special characters that work are ASCII-7 and ~ -- ||-$¢£¬.
Procedure
1. From the Toolbox tab , drag Query Calculation to the report.
2. In the Name box, type a meaningful name for your expression.
For example, if you are calculating the difference between 2007 revenue and
2006 revenue, you could name your expression 2007 - 2006 Revenue.
3. Click the type of calculation that you want to create, and select the hierarchy or
dimension that contains the data that is the focus of your calculation.
4. In the Available Components pane, define the calculation:
v Specify how you want to view the available data items in your data package
by clicking the view member tree button
or the view package tree
button
.
v To add data items that are not shown in the report, on the source tab
,
double-click the data items.
v To add data items that are in the report but not necessarily in the model,
such as calculations, double-click the data items on the data items tab
.
148 IBM Cognos Workspace Advanced Version 10.2.2: User Guide

v To add functions, summaries, and operators, on the functions tab ,
double-click elements.
Tip: To filter the visible functions, summaries, and operators in the
Available Components pane, click the filter button
and filter by the
function type, what the function returns, or what the function acts on.
Tip: You can also type the calculation directly in the Expression Definition
box. When typing date values, ensure that the date format is correct for your
database type.
5. Click the validate button
.
Any validation errors appear on the Errors tab of the Information pane.
Tip:
v To show or hide the Available Components pane, click the blue arrow to the
right of the pane.
v To show or hide the Information pane, click the blue arrow above the pane.
v To copy and paste expression components in the Expression Definition
pane, use the copy button
and the paste button .
Create an Intersection (Tuple)
When working with dimensional data, an intersection, also known as a tuple, is
useful for obtaining a value from the combination of two or more members that
you specify. Each member must be from a different hierarchy. The intersection can
include only one measure.
For example, the intersection (Revenue, 2004, Cooking Gear) shows the revenue
value for the year 2004 and for the product line Cooking Gear.
Procedure
1. From the Toolbox tab , drag the Intersection (Tuple) object to the report.
2. From the Available members and measures pane, select items and click the
right arrow to move them to the Intersection members and measures box. You
can also use items from the Calculated Members and Measures tab
.
3. To define the hierarchy for this intersection, click a parent object in the
Intersection hierarchy box.
Drill on a Member or Set
You can drill up or down on members and sets within IBM Cognos Workspace
Advanced.
In crosstabs, drilling down on a member adds the member's children so the
crosstab displays both the member and its children. Drilling up on a member adds
the member's parent set so the crosstab displays both the member and its parent
set.
Chapter 9. Exploring Dimensional Data 149

In charts, drilling down on a legend member or x-axis member displays that
member's children. Drilling up on a legend title or axis title displays the parent set
of the member you drilled on.
Note: You can enable drill-up or drill-down links or double-click drilling in the
Edit Options.
To allow drilling in the report output, such as HTML output, you must enable
drilling (Data, Drill Options).
Procedure
1. Double-click a member to drill down.
Tip: You can also click a member, click the explore button
, and click Drill
Down or Drill Up. Or you can right-click a member and click Drill Down or
Drill Up.
2. Double-click the parent to drill up.
Related tasks:
“Create a Drill-up and Drill-down Report” on page 157
When working with dimensional or dimensionally-modeled relational (DMR) data
sources, you can create reports that allow the reader to drill down to lower-level
data sets or drill up to higher-level data sets.
Filtering dimensional data
Use filters to remove unwanted data from reports. Data is shown in the report
only if it meets the filter criteria.
When working with dimensional data sources, you can filter only by members and
measures. Filtering is not available for data items that represent a single member
or calculated member.
For predictable results, when using the dimensional reporting style, use context
filters, limit data to top or bottom values, and filter the members within a set. Not
following these guidelines might yield unexpected results. In addition, the results
may change depending on what else is in the report, the data source used, and
whether the package uses the dynamic query mode.
You can use filters to suppress null cells in your reports. Using filters ensures that
calculations take suppression into account. If you want to perform calculations
before suppression is applied, use the Suppress option.
If you filter values that are floating-point numbers, you may encounter imprecise
filtering results due to rounding or data truncation. Floating-point numbers may
appear differently in the report than how they are stored in the data source. To
ensure accurate results, your filter criteria should account for any rounding issues.
By default, filters on measures are applied after automatic aggregation because, by
definition, dimensional data is aggregated. For members, filters are applied before
aggregation, which reduces the amount of data received from the data source. You
can change whether filters are applied before or after aggregation using the Edit
filters option.
150 IBM Cognos Workspace Advanced Version 10.2.2: User Guide

Procedure
1. Click the data item on which you want to filter.
Tip: If you select two or more items, you can filter using a range.
2. On the toolbar, click the filter button
.
3. Select a filter condition from the list.
Results
The filter is applied to the report.
Related concepts:
“Relational and dimensional reporting styles” on page 17
You can create reports in IBM Cognos Workspace Advanced using either a
relational reporting style or a dimensional reporting style depending on the type of
data source you use.
Related tasks:
“Suppress Empty Cells in Dimensional Reporting” on page 139
Sparse data may result in crosstabs showing empty cells. For example, a crosstab
that matches employees with products results in many rows of empty values for
the revenue measure if the employee does not sell those products.
Creating a context filter
When you are working with dimensional data, you can use context filters, or slicer
filters, to quickly focus your report on a particular view of the data.
For example, the following crosstab contains product lines in the rows, years in the
columns, and revenue as the measure. You want to filter the values to show the
revenue for only Web orders from Asia Pacific. To change the context, you drag
Asia Pacific and Web from the source tree to the Context filter section of the
overview area. The crosstab then shows the revenue for only Asia Pacific and Web.
Changing context changes only the values that appear. It does not limit or change
the items in the rows or columns.
The members that are used as the context filter appear in the report header when
you run the report.
Any summary values in the report are recomputed to reflect the results that are
returned by the context filter.
You can create multiple context filters to filter across two or more different
hierarchies.
Figure 45. A crosstab with a context filter that is applied
Chapter 9. Exploring Dimensional Data 151

Context filters are different from other filters. When you filter data, members that
do not meet the filter criteria are removed from the report. A context filter does not
remove members from a report. Instead, their values are filtered and you see blank
cells.
Important: When you create a context filter, use only data items that are not
contained in the rows or columns of your report or in the axes of your chart. If
you use data items in your context filter that are already present in your report or
chart, the result set is sparse. A result set is sparse if it contains many null values
relative to the number of values with actual numbers. Because null values still
must be processed, the time to run the report is extended unnecessarily. For
example, you create a crosstab report that contains Product Line in the rows, then
apply a context filter that includes only the Camping Equipment product line. The
resulting report contains many null values and might take a long time to run.
You can apply only one member per hierarchy in a context filter. If you add more
than one member into a context filter, a list of all members from that hierarchy is
displayed. You can choose which one to include in the filter. For example, you
have a crosstab that contains product lines in the rows, years in the columns, and
revenue as the measure. If you add the Web orders and Telephone order methods
into a context filter, a list appears that contains all Order Methods. You choose the
specific Order Method that you want to include in the context filter.
Procedure
1. From the Source tab , select or search for one or more items on which to
filter.
2. Drag the item that you want to filter on into the Context filter section of the
overview area.
3. To change context, select a new item from the Context filter box.
Limiting data to top or bottom values
You want to focus your report on the items of greatest significance to your
business question. For example, you want to identify your top 100 customers and
what that group of customers is worth.
You can limit the data to the top or bottom values of a set. This keeps the amount
of data shown in the work area small, even when using large data sources.
You can define a top or bottom rule by specifying
v a number, such as the 50 top or bottom performing sales people
v a percentage, such as customers who contribute to the top 10% of overall
revenue
v a cumulative sum, such as customers who contribute to the first ten million
dollars of overall revenue
If the selected set contains a user-defined filter, the top or bottom rule applies only
to the included values. For example, if you apply a filter to show only retailers
with revenue greater than one million dollars, the bottom rule applies to the lowest
values within those results.
You can filter a set of members to show only those at the top or bottom and base
the filter on the measure you are using and the set of members on the opposite
edge. You can also specify a custom filter.
152 IBM Cognos Workspace Advanced Version 10.2.2: User Guide

Procedure
1. Click the set that you want to filter, click the explore button , click To p o r
Bottom, and then click one of the filtering options.
Tip: You can also right-click the member.
2. If the filtering option that you want is not listed, click Custom.
3. In the Top or Bottom dialog box, click To p to filter to the top values or Bottom
to filter to the bottom values.
4. To choose how and how much you want to filter, click Count, Percent,orSum
and type the number of data items to show, the percent of data items to show,
or the value to sum.
5. Choose the intersection on which to base your filter by clicking the ellipsis (...)
button and selecting the members and measure for the intersection from either
the Source tab or the Calculated Members and Measures tab.
Tip: To edit the top or bottom filters, click the explore button
, and click
Edit Set.
Filtering the members within a set
You can remove members from within a set by specifying filter conditions so that
only the members that you require remain.
You can filter a set based on
v member captions
For example, your set includes employee names and you want to keep only the
employees with names that begin with a specific letter.
v properties that are numeric or strings
For example, your set includes employee names and you want to filter
employees using the gender property.
v intersection of values (tuple)
For example, you want to keep only the employees who used less than ten sick
days for the year 2008.
If you want to create a more complex filter, you can combine multiple conditions
using AND, OR, and NOT operators. By default, multiple conditions are combined
with an AND operator, which means that all conditions must be met for the filter
to take effect.
Filtering the members in a set is not the same as relation detail or summary filters.
Procedure
1. Select a set.
2. From the toolbar, click the explore button
and click Filter Set.
3. Select how you want to filter.
v If you want to filter the set using a caption, click Caption.
v If you want to filter the set using a member property, click Property and
select from the drop-down list.
v If you want to filter the set using an intersection of members, or tuple, click
Intersection (tuple) and click the ellipsis (...) button. Then, from Available
Chapter 9. Exploring Dimensional Data 153

members and measures, select the desired items and click the right arrow to
move them to the Intersection members and measures list.
4. Specify the Operator and Value to complete your condition and click OK.
5. To add additional conditions, click the new button
.
6. If you include multiple conditions in your filter, use the AND, OR, and NOT
operators to combine them.
v To add an operator, select the conditions that you want to combine, and click
an operator.
v To change an operator, double-click the operator to toggle among available
ones or select the operator and then select a different one from the list.
v To remove an operator, select it in the condition string, and then click the
delete button
.
7. To change a condition, click the edit button
.
Tip: To edit a filter, click the explore button
, and click Edit Set.
Creating a custom filter
Create custom filters when the values you want to use in your filter conditions do
not occur in your report.
You can use filters to create prompts in the report. Prompts provide questions that
help users to customize the information in a report to suit their own needs. For
example, you create a prompt so that users can select a region. Only data for the
specified region is retrieved and displayed in the report.
Procedure
1. Select the data item on which you want to filter.
Tip: If you select two or more items, you can filter by using a range.
2. On the toolbar, click the filter icon
.
3. Click Create Custom Filter.
4. Under Condition, select the type of condition you want.
5. Optional: Type a value to search for in the Keywords box. You can also paste a
list of values from a spreadsheet into the Keywords box. Optionally, modify the
search criteria by clicking the arrow beside the Keywords button. Then, click
Search.
6. Optional: If you are reporting on relational data, you can apply more text-based
filtering.
a. To choose specific data item values for the filter condition, in the Values
box, click Specific values and choose the values that you want to filter on.
Tip: You can search for values by typing a string in the Keywords box.
Click the arrow beside Search and select the search parameter that you
want to use. If you select Use Tab as keyword delimiter, you can add a tab
in the Keywords box only by copying and pasting a tab (or the string you
want to search on with a tab in it), from another application, such as
Notepad.
154 IBM Cognos Workspace Advanced Version 10.2.2: User Guide

b. To filter values based on a pattern, in the Values box, click Starts with,
Ends with, Contains,orMatches SQL pattern, and type the pattern in the
Value box.
With the Matches SQL pattern choice, you can filter values by using
standard SQL syntax to create a SQL supported pattern. You can use a %
(percent) symbol to substitute for zero or more characters, or _ (underscore)
to substitute for one single character. For example, the pattern '%a_b_c%'
returns every value that contains the sequence 'a, any character, b, any
character, c' anywhere in the string.
If you search for patterns that include the '%' or '_' characters, specify an
escape character in the Escape character (optional) box. The value must be
a single character. When specified, each occurrence of the escape character
causes the next character to be treated as text and not as a special character.
For example, if you specify '\' as the escape character, entering TEST\% in
the Value box searches for the string 'TEST%' rather than a string that
begins with 'TEST' followed by any other characters. Similarly, entering
TEST\\\% searches for strings that begin with 'TEST\%'.
You can specify whether the filter condition is case-sensitive or not. A
case-sensitive filter is applied only when the data source supports
case-sensitive filtering.
Note: When a filter based on a pattern is converted into a prompt, users are
prompted to specify a pattern when the report is run.
7. Under Values, select your values. If you filter numeric data, select the type of
filter condition that you want to create: Specific values, Comparison,orRange.
8. If you want users to be prompted when they run the report, select the Prompt
for values when report is run in viewer check box.
9. If you want the filter to include null values, select the Include missing values
(NULL) check box.
Combining filter conditions
You can combine two or more filter conditions to do more complex filtering.
Combined filters allow you to create compound conditions that are grouped with
AND or OR conditions.
For example, you want to filter the columns Product line and Year in a report. The
specific data you want to retrieve is the quantity of Camping Equipment sold in
2010 and the quantity of Golf Equipment sold in 2009. To do this, you must create
a complex filter that combines several filter conditions.
Procedure
1. On the toolbar, click the filter icon .
2. Click Edit filters.
3. Click the new button
, select Combined, and click OK.
4. In the Create Filter window, select the data item on which you want to filter
and click OK.
5. Under Condition, select the type of condition you want.
6. Under Values, select your values. If you filter numeric data, select the type of
filter condition that you want to create: Specific values, Comparison,or
Range.
Chapter 9. Exploring Dimensional Data 155
7. If you want users to be prompted when they run the report, select the Prompt
for values when report is run in viewer check box.
8. If you want the filter to include null values, select the Include missing values
(NULL) check box.
9. Click the operator that appears between the filters and click AND, OR,or
NOT to combine them.
10. Click the new condition button
, and specify a second filter condition.
11. Click the operator that appears between the filters and click AND, OR,or
NOT to combine them.
Editing filters
You can specify whether filters are mandatory and whether to apply them before
or after automatic aggregation.
Procedure
1. On the toolbar, click the filter button .
2. Click Edit filters.
3. To edit an existing filter, select the filter that you want to edit and click the edit
button
.
Tip: Click the new button
to add new filters.
4. To specify whether the filter is mandatory, in the Usage box, select an option.
5. To specify whether to apply filters before or after automatic aggregation, in the
Application box, select an option.
Removing filters
You can remove a single filter or all filters for your report if they are no longer
needed.
Procedure
1. On the toolbar, click the filter icon .
2. To remove all the filters in your report, click Remove all filters.
3. To remove a single filter, click Edit filters.
4. Select the filter that you want to remove and click the delete icon
.
Extended Data Items
Extended data items differ from the traditional, expression-based text strings by
enabling you to view details, select sets, sort sets, and apply contextual
calculations.
You can do the following with extended data items that are not available with
traditional data items:
v View details
You can select an extended data item and then, from the Data menu, click Data
Properties to see where the data item appears in the package and in the report
queries.
156 IBM Cognos Workspace Advanced Version 10.2.2: User Guide

v Select member sets
You can select a member in a set to highlight it as the primary selection and the
other members as secondary selections.
v Sort sets
You can select an extended data item, click the sort button
, and click
Advanced Set Sorting to sort a set in ascending or descending order, to sort
hierarchically, and to sort by caption, by a property, or by an intersection (tuple).
v Apply contextual calculations
You can select an extended data item and then, from the Data menu, click
Calculate to see a contextual list of calculations that are available for this
extended data item.
Create a Drill-up and Drill-down Report
When working with dimensional or dimensionally-modeled relational (DMR) data
sources, you can create reports that allow the reader to drill down to lower-level
data sets or drill up to higher-level data sets.
Drilling up and down allows you to view more general or more detailed
information on your data within a predefined dimensional hierarchy (such as Years
- Year - Quarter - Month), without having to create different reports.
You must run the report before you can drill up or down.
Note: You cannot set drill options when you have opened a widget from a
workspace in IBM Cognos Workspace to edit it in IBM Cognos Workspace
Advanced.
Procedure
1. From the Data menu, click Drill Options.
2. In the Report output drill capabilities box, select the Allow drill-up and
drill-down check box.
By default, Cognos Workspace Advanced determines which items can be
drilled on, based on the dimensional structure.
Tip: If you want the report to be used as the source during a package
drill-through, select the Allow this report to be a package-based drill-through
source check box and click OK. For more information about package
drill-through, see the IBM Cognos Business Intelligence Administration and
Security Guide.
Related tasks:
“Drill on a Member or Set” on page 149
You can drill up or down on members and sets within IBM Cognos Workspace
Advanced.
Chapter 9. Exploring Dimensional Data 157
158 IBM Cognos Workspace Advanced Version 10.2.2: User Guide

Chapter 10. Formatting Reports
Format your report to make it more readable and to reflect company standards.
When you format a report in IBM Cognos Workspace Advanced, the formatting is
stored in a layout.
You can also format a report based on conditions.
Add a Header or Footer to a Report
Add a header or footer to make a report easier to read. Headers and footers are
containers in which you can add objects like text, images, and report expressions
such as the current date and page numbers.
When you create a new report, a header and footer is included by default. You can
insert a table in the header or footer to split it into multiple cells.
Before you begin
To see the headers and footers, ensure that the visual aids are turned on.
Procedure
1. From the Structure menu, click Headers & Footers, and then click Page Header
& Footer.
2. Select the appropriate check boxes, and click OK.
3. If you want to add objects to a header or footer, drag the object that you want
from the Toolbox tab
to the appropriate location.
Add Borders to an Object
You can add borders to objects in a report such as a cell, a column, a row, a header,
a footer, or to the whole report.
Once you define a style for an object, you can copy and reuse it on another object.
Procedure
1. In the work area, click the object to which you want to add a border.
Tip: To quickly select the parent of an object, click the object, and then click the
select ancestor button
in the Properties pane title bar.
2. From the style toolbar, use the all borders button
to specify the border
properties that you want.
Add Text
You can add text to a report. You can insert text in other objects, such as a block or
table cell, or directly in the report page.
You can also add multilingual text to a report.
© Copyright IBM Corp. 2005, 2014 159

Procedure
1. From the Toolbox tab , drag the Text Item object to the report.
2. Type the text and click OK.
Tip: You can also paste text from another part of the report.
Results
You can now format the text by changing the font, color, size, style, justification,
and alignment.
Specify the Font for a Report
You can specify the font properties for objects in a report.
Once you define a style for an object, you can copy and reuse it for another object.
Procedure
1. Click the object for which you want to specify the font.
Tip: To specify the default font for the entire report, click the page body.
2. From the style toolbar, specify the font properties that you want.
You can also right-click the object, and click Style and Font.
Tip: Type a list of fonts in the Family box if you are not sure whether a
specific font is installed on a user's computer. For example, if you type, Times
New Roman, IBM Cognos Workspace Advanced checks to see if Times New
Roman is installed. If it is not, Cognos Workspace Advanced checks for Arial. If
Arial is not installed, the monospace font used by the computer is used.
Results
If you clicked (Default) for any of the font properties, the default value for the
property is used. Default values are stored in a style sheet that is used across all
IBM Cognos Business Intelligence tools. You can modify default values by
applying different style classes.
Add Color to an Object
You can add background and foreground color to objects in the report.
Procedure
1. Select the object to which you want to add color.
Tip: To quickly select the parent of an object, click the object, and then click the
select ancestor button
in the Properties pane title bar.
2. From the Style menu, click Style.
3. Click Background Color or Foreground Color.
4. To apply an existing color, click the Web Safe Colors tab or Named Colors tab
and choose one of the available colors.
Use a named color to select a color from a small set of colors. Use Web safe
colors to select from 216 available colors.
160 IBM Cognos Workspace Advanced Version 10.2.2: User Guide

5. To apply a custom color, click the Custom Color tab and type values in the
Red, Green, and Blue boxes.
The values must be hexadecimal.
Copy Object Formatting
You can quickly copy the formatting of items in your report, such as fonts, colors,
borders, and number formats, and apply that formatting to other items.
Procedure
1. Click an item that has the formatting to copy.
2. Do one of the following:
v To copy all the formatting applied to the item, click the pick up style button
, click the item to format, and then click the apply style button .
v To copy only one of the formatting styles, click the down arrow to the right
of the pick up style button and click the style to copy. Then click the item to
format and click the apply style button.
3. If you want to make changes to a style that you copied, click the down arrow
to the right of the pick up style button and click Edit Dropper Style.
4. In the Style dialog box, specify basic and advanced style characteristics.
Insert an Image in a Report
You can insert an image in a report. You can insert images in other objects, such as
blocks or table cells, directly in the report page or as the background image of
another object.
Before you begin
The images that you insert must first be uploaded to the IBM Cognos Business
Intelligence server or another Web server and must be .gif or .jpg format.
Procedure
1. From the Toolbox tab , drag the Image object to the report and then
double-click it.
2. In the Image URL dialog box, type the URL of the image to insert or click
Browse to go to the location containing the image.
To browse images on a Web server, you must enable Web-based Distributed
Authoring and Versioning (WebDAV) on your Web server. For more
information about configuring Web servers, see the IBM Cognos Business
Intelligence Installation and Configuration Guide.
Add Background Effects
You can add background effects to enhance the appearance of your report.
You can enhance objects, such as data containers (lists, crosstabs, and charts),
headers, footers, page bodies, and so on with borders, gradient fill effects, drop
shadows, and background images. You can also apply background effects as a class
style.
Chapter 10. Formatting Reports 161

The background effect is rendered within the rectangle area that bounds the object.
To use a generated background in a chart, the chart must have a fixed size.
If the background image is complex and large, the size of the report output may be
affected proportionately.
Background effects are rendered only if the data container has a fixed height and
width; if a percentage size is used, the effects are ignored.
Resizing or overflow behavior is ignored for generated images in HTML reports.
Procedure
1. Click the object.
2. To choose a preset background effect, click the background effects presets
button
on the style toolbar, and then click a background.
3. Click the style button
.
4. Click the Advanced tab.
5. Click the edit button
beside the Background effects box.
6. Select one or more of the following:
v To apply a border, click Border and specify settings for border style, width,
color, corner radius for rounded rectangles, and transparency.
If the element also includes a fill with a transparency setting, select the
Allow transparent bleed check box to apply the same transparency to the
border.
v To apply a fill effect, click Fill and specify the settings. The fill effect can
either be a solid color, a gradient, or a pattern. You can define a gradient fill
effect as a linear, radial line, or radial rectangle gradient.
v To apply a drop shadow effect, click Drop Shadow and specify the shadow
color, transparency value, color, and offset settings. The default horizontal
and vertical offset is 5 pixels.
v To specify one or more images as a background, click Images. You can
specify the transparency value and the position for each defined image. You
can also specify a custom position for each image.
Related tasks:
“Add Background Effects to a Chart Object” on page 75
You can change the look of certain charts and chart objects by applying visual
effects such as drop shadows, borders, fills, texture effects, and bevel effects.
Insert Page Numbers in a Report
You can insert page numbers in a report and specify the number style to use.
You can select a predefined page numbering scheme or create a custom scheme.
You can easily insert page numbers using the Page Number object.
Procedure
1. From the Toolbox tab , drag Page Number to the report.
162 IBM Cognos Workspace Advanced Version 10.2.2: User Guide

Tip: When you create a new report using one of the existing report layouts,
Page Number is already inserted in the page footer.
2. Right-click the page number symbol and click Edit Number Style.
3. Choose the style to use.
The first three choices apply only to vertical page numbers. The remaining
choices specify how vertical and horizontal page values appear.
Note: The 1 of 3 number style works only for reports produced in PDF or
non-interactive HTML format. In HTML format, the 1 of 3 number style works
when viewing saved report outputs, as the entire report appears in a single
HTML page.
4. If you want to customize the choice that you made in the previous step, click
the edit button
, make your changes, and click OK.
A custom number style is created. If you later choose a different number style,
the custom style is removed from the list.
Tip: In the Custom Number Style dialog box, when you pause the pointer
over a box, a tooltip describes how that box affects page numbers. For example,
the Separator Text box contains the text, such as a hyphen, that separates page
values for both vertical and horizontal pages.
Insert Other Objects
In addition to text and images, the Toolbox tab contains other objects that you can
add to the report layout.
Object Description
Text item Inserts text.
Block Inserts an empty block, a container in which
you can insert other objects. This is useful
for controlling where objects appear.
Tip: You can use blocks to add space
between objects. However, empty blocks are
not rendered. You must insert an object or
specify the height and width.
Table Inserts a table, a container in which you can
insert other objects. This is useful for
controlling where objects appear.
Query Calculation Inserts a calculation.
Intersection (Tuple) Inserts an intersection (tuple).
Image Inserts an image.
Chapter 10. Formatting Reports 163

Object Description
Crosstab Space Inserts an empty cell on a crosstab edge.
Allows for the insertion of non-data cells on
an edge. Blank cells appear for the edge
when the report is run.
Insert this object when a crosstab edge does
not produce useful data and you want
blanks to appear in the cells instead.
Crosstab Space (with fact cells) Inserts an empty cell on a crosstab edge.
Allows for the insertion of non-data cells on
an edge. The contents of the fact cells for the
edge are rendered when a measure is added
or the default measure is specified.
If the crosstab space is nested, the scope of
the fact cells is the scope of the item that is
at the level before the space.
If the crosstab space is not nested and there
are no items nested below it, the scope of
the fact cells is the default measure.
List Inserts a list.
Crosstab Inserts a crosstab. You can insert multiple
crosstabs in your report layout.
Chart Inserts a chart. You can insert multiple
charts in your report layout.
Hyperlink Inserts a hyperlink so that users can jump to
another place, such as a Web site.
Date Inserts the date when the report runs.
Time Inserts the time when the report runs.
Page Number Inserts page numbers that you can
customize.
Before you begin
Before you can add a hyperlink, HTML item, or hyperlink button, you must have
the HTML Items in Report capability. For more information, see the IBM Cognos
Business Intelligence Administration and Security Guide, or contact your
administrator.
Procedure
To add an object, drag it to the work area or double-click it from the Toolbox tab
.
164 IBM Cognos Workspace Advanced Version 10.2.2: User Guide

Align an Object
You can specify an alignment for an object in a report to determine where it
appears.
Tables can also be used to determine where objects appear in a report.
Procedure
1. Select the object that you want to align.
2. From the style toolbar, click an available horizontal or vertical alignment
button.
Lay Out Report Pages
You can divide your report pages into various layouts, including two columns, two
rows, and four quarters. You can then drag report objects to the report sections.
Procedure
Click the page layout button
, and then click a report layout.
If report objects are already in the report, they will move to fit the new layout.
Using a table to control where objects appear
You can use tables in your report to control where objects appear. Tables can be
inserted anywhere in a report, such as a header, a footer, or the page body. After
you create a table, insert the objects you want in the cells.
You can also apply a predefined table style to tables.
The alignment buttons can also be used to determine where objects appear in a
report.
Procedure
1. From the Toolbox tab
, drag Table to the report.
The Insert Table dialog box appears.
2. In the Number of columns and Number of rows boxes, type the number of
columns and rows for the table.
3. If you want to have the table span the width of the report page, select the
Maximize width check box.
4. If you want to add borders to the table, select the Show borders check box.
5. If you want to merge cells in the table, select the cells and click the merge cells
icon
.
6. Select the table object.
7. In the Properties pane, under Positioning, double-click the Table Properties
property.
8. To display both the inside and outside borders, do the following:
v Clear the Collapse borders check box.
v Type a number in the Cell spacing text box to define how much space to
add between the table cells.
Chapter 10. Formatting Reports 165

v Select the Show empty cell borders check box to display the borders even
for empty cells.
9. To fix the size of the columns in the table, check the Fixed size check box.
When this check box is cleared, the table columns expand to fit the text.
Applying table styles
Apply a table style to quickly format tables. You can also apply a table style to lists
and crosstabs.
About this task
By default, when a new object is inserted in a list or crosstab, the object inherits
the style from an object of the same type in the data container. For example, if you
insert a measure in a list, the measure inherits the style of a measure that is
already in the list, if there is one. If you do not want objects to inherit styles, clear
the Table Style inheritance option in the Tools menu (Tools, Options, Report tab).
The following rules explain how style inheritance is applied to lists and crosstabs.
v Styles are inherited in the following order: custom, client default, and server
default.
A custom style is a style that you manually apply. A client default style is one of
the styles available in the Apply Table Style dialog box. The server default style
is the style applied when Default is selected in the Apply Table Style dialog
box.
v When a new column or row is inserted, it inherits the style from the sibling of
the same type that is on its right or below it.
v If there is no sibling of the same type on its right or below it, then the style of
the nearest sibling that is on its left or above is applied.
v If there is no sibling of the same type in the container, then the client or server
default table style is applied.
v If a custom style is applied to a column or row and the object is then moved to
another location, the object retains the custom style.
Custom styles applied to part of an object, such as the header, body, or footer,
may be lost. For example, if a container has a footer, the footer is recreated when
a column is moved. The recreated footer is rendered using the style that was
applied to the footer before you customized its style.
v Deleting a column or row has no impact on the styles of the other objects in the
container.
v Styles are preserved if a column is grouped or ungrouped. The same applies
when creating or removing sections.
v When drilling up or down, the style of the parent item is applied.
Procedure
1. Click the table, list, or crosstab to which you want to apply a table style.
Tip: To quickly select the parent of an object, click the object, and then click the
select ancestor button
in the Properties pane title bar.
2. From the Style menu, click Apply Table Style.
3. In the Table styles box, click a table style.
Tip: Some styles are unique to tables, lists, or crosstabs.
166 IBM Cognos Workspace Advanced Version 10.2.2: User Guide

4. If you are applying a table style to a table or list, in the Apply special styles to
section, select or clear the various column and row check boxes based on how
you want to treat the first and last columns and rows.
Some options may not be available for particular table styles or for particular
columns or rows.
5. If you are applying a table style to a list or crosstab, and you want the style to
be applied to all lists or crosstabs in the report, select the Set this style as the
default for this object type check box.
For a list, you may need to clear the First column and Last column check
boxes in the Apply special styles to section before you can select this check
box. In addition, some table styles cannot be set as the default.
Dividing data into sections
Create sections in a report to show a separate list, chart, visualization, or crosstab
for a data item.
For example, you have a list that shows products that were purchased. For each
product, the product type is also shown. You section the product type column to
show a separate list for each product type. The product type is displayed as the
heading for each list.
Creating sections is similar to grouping data. The difference is that when you
create sections, a separate list, crosstab, visualization, or chart is displayed for each
data item and a section header is displayed outside the list, crosstab, visualization,
or chart. In addition, you can group data items only in lists but you can create
sections in lists, crosstabs, visualizations, and charts.
For dimensional data, you can also create page layers to show values on a separate
page for each member.
When you remove a section, the data item is returned to the original list, crosstab,
visualization, or chart. For crosstabs, if you created sections for both rows and
columns simultaneously (with Ctrl+click or Shift+click), when you remove the
section, all data items are returned to one edge of the crosstab for the first data
item that you selected. For example, you Ctrl+click the rows and then the columns,
and you create a section. When you remove the section, all data items are returned
to the rows. You can then drag the data items that belong in the columns back into
the Columns area.
Procedure
1. Click the data item on which to section.
Tip: To create multiple sections simultaneously, use Ctrl+click or Shift+click.
2. Click the Section/Unsection icon
.
3. To remove a section, click the data item and click the Section/Unsection icon.
Related tasks:
“Group Data” on page 103
Group data items in a list report to remove duplicate values. For example, you
have a report that shows products purchased. For each product, the product type
is also shown. You group the product type column to show only one instance of
each product type in the list.
Chapter 10. Formatting Reports 167

“Create Page Layers” on page 133
When working with dimensional data, you can create page layers in a report to
show values for each member on a separate page. For example, your report
contains payroll information for the entire company. You want to view values for
each department on a separate page.
Apply Padding to an Object
Apply padding to an object to add white space between the object and its margin
or, if there is a border, between the object and its border.
Tip: You can quickly apply left or right padding by either pressing Tab and
Shift+Tab or by clicking the increase indent
and the decrease indent
buttons in the style toolbar. When using the toolbar buttons, you can indent an
object by up to nine times the indentation length. You can specify the indentation
length to use by clicking the arrow beside either button and clicking Set Default
Indent Length.
Procedure
1. Select the object to which you want to apply padding.
2. From the Style menu, click Style.
3. Under Padding, click the edit button
.
4. Specify top, bottom, left, and right padding by typing values in the
corresponding boxes and choosing the unit of measure you want.
Set Object Margins
Set the margins for objects in a report to add white space around them.
For Date, Time, Row Number, and Page Number objects, you can only set the left
and right margins. If you want to set the top or bottom margins for these objects,
place them in a table or a block. Then set the margin or padding properties on the
table or block object.
Procedure
1. Select the object for which you want to set margins.
2. From the Style menu, click Style.
3. Under Margin, click the edit button
.
4. Specify the top, bottom, left, and right margins by typing values in the
corresponding boxes and choosing the unit of measure you want.
Rename a Row or Column
Change the row or column title to provide a more meaningful name.
By default, when you run a report, the column title is taken from one of the
following:
v if defined, the Data item label property of the data item. This is the label seen
in the report output.
v if defined, the label of the data item in the model
168 IBM Cognos Workspace Advanced Version 10.2.2: User Guide

v the Data item name property of the data item. This is the name of the data item
in the query.
Consequently, the column title you see in the layout may not be the column title
you see when you run the report. For example, if you modify the Data item name
property of the data item, the column title in the layout will change to the new
name. However, when you run the report, the column title that appears will be, if
defined, the data item label in the report or the data item label in the model. If
neither of these are defined, only then will the modified name be used as the
column title.
When you insert a member calculation or summary in a crosstab, row or column
headings use the data item label.
Procedure
Right-click the row or column heading you want to change and select one of the
following:
v To show the label that is seen in the report output, click Data Item Label.
Tip: To change the data item label, click Edit Data Item Label.
v To use static text that you type, click Show Text and type the new name in the
Edit Label dialog.
v To restore the default name, click Show Default Contents.
v To leave the heading blank, click Show Empty Cell.
Support for bidirectional content
You can author reports that support bidirectional content. You can specify base text
direction, digit shaping, and container direction.
Arabic, Hebrew, Urdu, and Farsi are languages written from right to left, using the
Arabic or Hebrew scripts. However, numbers in those languages, as well as
embedded segments of Latin, Cyrillic, or Greek text, are written from left to right.
Using the bidirectional settings in IBM Cognos Workspace Advanced, you can
control the direction in this type of text in reports.
Report formats
Bidirectional content is supported for reports produced in HTML, PDF, and
Microsoft Excel formats.
Enabling bidirectional support
To enable support for bidirectional languages when a report is run, in IBM Cognos
Connection, users must open their My Preferences page and select the Enable
bidirectional support check box.
To enable support for bidirectional languages when a report is run from Cognos
Workspace Advanced, select the Enable bidirectional support check box in the
Run Options window.
Tip: If you enable bidirectional support in Cognos Connection and you then start
Cognos Workspace Advanced, the bidirectional support run option in Cognos
Chapter 10. Formatting Reports 169
Workspace Advanced is selected. If you disable bidirectional support in Cognos
Connection and you then start Cognos Workspace Advanced, the run option in
Cognos Workspace Advanced is cleared.
Base text direction
Base text direction sets the text direction as left-to-right or right-to-left. You can
specify the base text direction for any text object in a report. You specify the base
text direction for text by clicking the Direction & Justification property for the text
or for the object that contains the text, such as a list column.
A contextual option also exists in the Direction & Justification property that sets
the text direction based on the first letter in the text.
For compound objects that contain text, such as a chart, you specify the base text
direction of the text contained in the object by clicking the Contained text
direction property for the object.
Digit shaping
Digit shaping allows users to consume reports in the numeric shaping that they
can read after they select the content language in IBM Cognos Connection. You can
specify digit shaping at the following levels:
v Report
v Container (except for charts)
v Text
v Number
You specify digit shaping for an object by clicking the Data Format property for
the object. To specify digit shaping at the report level, click the Default Data
Formats option in the Data menu.
Tip: Digit shaping has no impact on reports produced in Excel format, since the
shaping of digits in Excel depends on Windows regional settings.
Container direction
Container direction sets the direction of container objects in a report as left to right
or right to left. You specify container direction for an object by clicking the
Direction & Justification property for the object.
Tip: Container direction is not supported in reports produced in Excel format.
Excel spreadsheets do not natively support mirroring at the container level.
Related concepts:
“Digit shaping in charts” on page 138
When working with bidirectional content, you cannot specify digit shaping at the
chart level. You can specify digit shaping for the objects in charts.
Related tasks:
“Running a report” on page 33
Run your report to see how the report will appear to report consumers.
“Specifying text and container direction” on page 171
You can specify text flow properties by choosing any of these options.
170 IBM Cognos Workspace Advanced Version 10.2.2: User Guide

“Format Relational Data” on page 112
Format data in a report to improve readability. For example, you can show all date
values in the order year, month, and day. If you do not specify formatting, data is
formatted according to the properties set in the model. If the properties were not
set in the model, data is formatted according to the International Components for
Unicode (ICU) formats.
“Format Dimensional Data” on page 136
Format data in a report to improve readability. For example, you can show all date
values in the order year, month, and day. If you do not specify any formatting,
data is formatted according to the properties set in the model. If the properties
were not set in the model, data is formatted according to the International
Components for Unicode (ICU) formats.
Specifying text and container direction
You can specify text flow properties by choosing any of these options.
Option Description
Direction Sets the reading order of an object, such as right-to-left. If
Inherit is selected, the direction is inherited from the
parent object. The default is left-to-right.
For text objects, an additional choice named Contextual
exists. This choice sets the text direction based on the first
letter in the text. If the letter belongs to a right-to-left
script, the text direction is right-to-left. Otherwise, the text
direction is left-to-right. Numbers and special characters do
not influence the text direction. For example, if the text
starts with a number followed by an Arabic letter, the
direction is right-to-left. If the text starts with a number
followed by a Latin letter, the direction is left-to-right.
Tip: You can also set the direction of text items by clicking
the Text direction icon
in the toolbar. This icon is
visible only when the IBM Cognos Connection user
preference Enable bidirectional support is selected.
Writing mode Sets the direction and flow of content in an object.
Bi-directional Sets the level of embedding in an object.
For text objects, if the Direction option is set to a value
other than (Default) and no value is selected for this
option, this option is set to Embed. Setting this option to
Embed ensures that the base text direction specified for the
text is applied.
Justification Sets the type of alignment used to justify text in an object.
Kashida space (%) Sets the ratio of kashida expansion to white space
expansion when justifying lines of text in the object. This
property is used in Arabic writing systems.
Chapter 10. Formatting Reports 171

About this task
Specifying text direction and container direction depends on the object selected in
the report. The following list describes the types of objects in IBM Cognos
Workspace Advanced that you can specify text or container direction.
v Compound objects
Compound objects are container objects that contain text, such as charts. You
cannot set text direction for specific text objects in a compound object.
To specify container direction for compound objects, click the Direction &
Justification property for the object. To specify text direction for text in
compound objects, click the Contained Text Direction property for the object.
v Container objects
You can specify only container direction for container objects, such as a report
page. Click the Direction & Justification property for the object to specify
container direction.
By default, the text direction of text in a container object is inherited from the
container.
v Text objects
For all text objects, the Direction & Justification property specifies the text
direction.
In charts, container direction impacts all aspects of a chart. The following list
describes the parts of a chart that are affected by container direction.
v The chart itself.
v The location of the Y-axis and the horizontal run direction of the X-axis.
v The labeling, including the orientation of angled labels on axes.
v The location of the legend as well as the legend content.
Container direction has no impact on rotary axes. For example, the slices in a pie
always progress in the same direction around the pie. However, container direction
does affect labelling as well as position and direction of the legend.
Note: You cannot specify base text direction and container direction for legacy
charts.
Procedure
1. Click the object you want.
2. From the Style menu, click Style and click the Advanced tab.
3. Under Direction & justification, click the edit button
.
4. Choose how you want text to flow by specifying the options that you want.
Related concepts:
“Support for bidirectional content” on page 169
You can author reports that support bidirectional content. You can specify base text
direction, digit shaping, and container direction.
172 IBM Cognos Workspace Advanced Version 10.2.2: User Guide

Specify Line Spacing and Breaking
You can specify text properties by choosing any of these options.
Option Description
Line Height Sets the distance between lines of text in an
object.
Letter Spacing Sets the amount of additional space between
letters in an object.
Text Indent Sets the indentation of the first line of text in
an object.
Note: This property works with HTML
output but does not apply to PDF output.
Word Break Sets line-breaking behavior within words.
Break words when necessary Sets whether to break words when the
content exceeds the boundaries of an object.
Enforce stricter line-breaking rules for
Japanese Text
Sets line-breaking rules for Japanese text.
Procedure
1. Click the object you want.
2. From the Style menu, click Style and click the Advanced tab.
3. Under Spacing & breaking, click the edit button
.
4. Specify the text properties.
Specify the Height and Width of an Object
You can specify the height and width of objects using various units of
measurement. In addition, if the object is a block, you can specify how to handle
content overflow. Specify the height and width by choosing any of these options.
Option Description
Height Sets the height of the object.
Width Sets the width of the object.
Content is not clipped If the contents of the block exceed the height
or width of the block, the block
automatically resizes to fit the contents.
Content is clipped If the contents of the block exceed the height
or width of the block, the content is clipped.
Note: The clipped content still exists. It is
just not visible in the block.
Chapter 10. Formatting Reports 173

Option Description
Use scrollbars only when necessary If the contents of the block exceed the height
or width of the block, scrollbars are added
to the block.
Always use scrollbars Scrollbars are added to the block.
When you use a percentage to specify the size of an object, the percentage is
relative to the object's parent. In some cases, setting the size of an object using
percentages will not give you the results that you want unless you also specify the
size of the parent container.
Procedure
1. Click the object you want.
2. From the Style menu, click Style and click the Advanced tab.
3. Under Size & overflow, click the edit button
.
4. Specify the options that you want.
Control How Other Objects Flow Around an Object
For each object in your report, you can specify how other objects flow around the
object.
The following options are available:
Option Description
Float Sets how other objects flow around the object.
Allow floating objects on
both sides
Allows other objects to flow on both sides. The Float
property must be set.
Move below any floating
object on the left side
If there are other objects to the left of the object, the object
moves below those objects. The Float property must be
set.
Move below any floating
object on the right side
If there are other objects to the right of the object, the
object moves under those objects. The Float property must
be set.
Move below any floating
object
Moves the object under any other object in which the
Float property was set.
Procedure
1. Click the object you want.
2. From the Style menu, click Style and click the Advanced tab.
3. Under Floating, click the edit button
.
4. Specify how you want other objects to flow around the object by specifying the
options that you want.
174 IBM Cognos Workspace Advanced Version 10.2.2: User Guide

Highlight Data Using a Conditional Style
Add conditional styles to your report to better identify exceptional or unexpected
results. A conditional style is a format, such as cell shading or font color, that is
applied to objects if a specified condition is true.
For example, you want to automatically highlight in green the departments in your
organization that meet their budget quotas and highlight in red the departments
that go over budget. Creating conditional styles color-codes information in your
reports so that you can find areas that need attention.
You can apply multiple conditional styles to objects. For example, you can apply
one style in specific cells and another style for the overall report. If multiple styles
set the same property, such as font color, the last style in the list is applied.
You can apply conditional styles based on any data item in your report.
You can create the following types of conditional styles.
Type Description
Numeric Range Highlights straight numerical data, such as
revenues and losses.
Date/Time Range Highlights data from specific dates and
times.
Date Range Highlights data from specific dates.
Time Range Highlights data from specific times.
Interval Highlights data falling between set intervals.
String Highlights specific alphanumeric items in a
report. For example, you can highlight all
instances of a specific word or phrase, such
as Equipment. String criteria are
case-sensitive.
If multiple string conditions are met, only
the first conditional style is applied.
Advanced Creates conditional styles that use
calculations or expressions.
If multiple advanced conditions are met,
only the first conditional style is applied.
Note: Conditional styles and conditional data formatting do not work on chart
axis labels. If you apply a conditional style or conditional data formatting to a
chart axis, only the first style defined is applied.
Create a New Conditional Style
You can apply conditional styles based on any data item in your report.
Procedure
1. Click the object for which you want to define a conditional style and click the
conditional styles button
.
Chapter 10. Formatting Reports 175

Tip: You can also right-click the object and click Style, Conditional Styles or
click the object, and then, in the Properties pane, set the Conditional Styles
property.
2. Click the add button
and click New Conditional Style.
3. Select the data item to determine the condition and click OK.
The type of conditional style that you can use depends on the type of data item
you select.
4. In the Name box, type a name for the conditional style.
5. To define a numeric value, date/time, date, time, or interval condition:
v Click the new button
and select a value to define a threshold.
The value appears in the Range column, and two ranges are created.
v For each range, under Style, click one of the predefined styles to apply to the
range or click the edit button
and create a new style.
Tip: You can also define a style for the cells in your report that have missing
values.
v Repeat the steps above to add other conditions.
Tip: Under Style, pause the pointer over each range
to see the condition
produced for that range.
v To move a value above or below a threshold, click the arrow button
next
to the value.
For example, you insert a threshold value of five million. By default, the
ranges are less than or equal to five million and greater than five million.
Moving the five million value above the threshold changes the ranges to less
than five million and greater than or equal to five million.
6. To define a string condition:
v Click the new button and select how to define the condition.
v To select more than one individual value, click Select Multiple Values and
click the values.
v To type specific values, click Enter Values and type the values.
v To specify your own criteria, such as values that begin with the letter A, click
Enter String Criteria and specify the condition.
v For each condition, under Style, click one of the predefined styles to apply
or click the edit style button and create a new style. Specify the style to
apply to remaining values by clicking one of the predefined styles beside
Remaining values (including future values).
v Specify the order in which to evaluate the conditions.
Conditions are evaluated from top to bottom, and the first condition that is
met is applied.
Reuse an Existing Conditional Style
You can create a conditional style once and reuse it on multiple objects in your
report. You can specify the order in which conditional styles are applied. You can
also use existing local classes as your conditional styles.
176 IBM Cognos Workspace Advanced Version 10.2.2: User Guide

Procedure
1. Click the data item for which you want to define a conditional style, and then
click the conditional styles button .
Tip: You can also right-click the data item and click Style, Conditional Styles
or click the data item, and then, in the Properties pane, set the Conditional
Styles property.
2. Click the add button
, click Use Existing Conditional Style, and select the
style.
Create an Advanced Conditional Style
You can create advanced conditional styles that use calculations or expressions.
If multiple advanced conditions are met, only the first conditional style is applied.
Procedure
1. Click the data item for which you want to define a conditional style, and then
click the conditional styles button
.
Tip: You can also right-click the data item and click Style, Conditional Styles
or click the data item, and then, in the Properties pane, set the Conditional
Styles property.
2. Click the add button
and click Advanced Conditional Style.
3. Type a name for the conditional style.
4. Click the add button
and specify the expression that defines the condition.
5. For each condition, under Style, click one of the predefined styles to apply or
click the edit button
and create a new style. Specify the style to apply to
remaining values by clicking one of the predefined styles beside Remaining
values (including future values).
6. Specify the order in which to evaluate the conditions by clicking a condition
and then clicking the move up or move down arrow.
Conditions are evaluated from top to bottom, and the first condition that is met
is applied.
Example - Add a Conditional Style to an Existing Report
You are a report writer at The Sample Outdoors Company, which sells sporting
equipment. You have a report that compares current year data to previous year
data and highlights negative percentage variances in red (Poor) and positive
percentage variances in green (Excellent). You want to add a third conditional style
to indicate percentage variances above 0 but less than 10. You create a conditional
style that highlights percentage variances between 0 and 10% in yellow (Average).
Procedure
1. Open the GO Balance Sheet as at Dec 31 2012 report from the GO Data
Warehouse (analysis) package.
2. Right-click any cell in the % Variance column and click Style, Conditional
Styles.
Chapter 10. Formatting Reports 177

3. Select Conditional Style 1 and click the edit button .
4. Select the first advanced condition listed and click the edit button.
5. Delete =0 from the expression definition.
6. Click the Functions tab, and then expand the Operators folder.
7. Double-click between, and then click after between in the expression, add a
space, and type 0.
8. Double-click and, and then click after and in the expression, add a space, type
.1, and click OK.
9. From the Style box associated with this condition, click Average.
10. Select the second advanced condition listed and click the edit button.
11. Replace >0 in the expression with >.1 and click OK.
12. Leave the style associated with this condition as is.
13. Run the report.
The new conditional style appears in the % Variance column.
Specify what appears for data containers that contain no data
You can specify what appears in a data container when no data is available from
the database.
When no data is available, you can show one of the following options:
v An empty data container, such as a blank list.
v Alternate content, such as another data container or an image. You can insert
any object from the Toolbox tab.
In IBM Cognos Workspace Advanced, to insert alternate content, you must be in
the Page Design mode (View > Page Design).
v Text, such as There is no data available for this month. If you show text, you can
format it. By default, the text No Data Available appears.
You can specify what appears when no data is available for the following data
containers: lists, crosstabs, charts, maps, repeaters, repeater tables, and tables of
contents.
Figure 46. Conditional styles that are applied to a report
178 IBM Cognos Workspace Advanced Version 10.2.2: User Guide

If your report includes multiple data containers, you can specify different no data
contents for each container.
Procedure
1. Select a data container.
2. In the Properties pane, click the select ancestor icon
and click the data
container type.
3. Click the ellipsis button next to the No Data Contents property and select what
should appear for data containers that contain no data:
v To show an empty data container, click No Contents.
v To show alternate content, click Content specified in the No data tab.
Two tabs appear at the top of the data container and the No Data Contents
tab
is selected automatically.
From the Toolbox tab
, insert the objects to appear when there is no data
available into the No Data Contents tab.
v To show text, click Specified text and type the text that you want to appear.
Modifying Report and Object Styles
Objects in reports are assigned a Cascading Style Sheet (CSS) class that provides a
default style for the object. For example, when you create a new report, the report
title has the class property Report title text assigned to it. In addition, objects
inherit the classes set on their parent objects.
You can apply a different class to an object to change its appearance.
You can also use classes to highlight data using conditional styles.
Modify the report properties
You can change the styles in the style sheet to make your entire report appear
differently.
You cannot edit the report style when you have opened a widget from a
workspace in IBM Cognos Workspace to edit it in IBM Cognos Workspace
Advanced.
Procedure
1. Click File > Report Properties.
2. In the Report styles list, select one of the following options:
v To work with classes in the default style sheet, click 10.x styles.
v To work with classes that were used in IBM Cognos 8, click 8.x styles.
Use 8.x report styles when you are working with reports created in IBM
Cognos 8 and you want to preserve their original appearance.
v To work with classes that were used in IBM Cognos ReportNet, click 1.x
styles.
Use 1.x report styles when you are working with reports created in
ReportNet and you want to preserve their original appearance.
v To work with classes that have minimal styling defined, click Simplified
styles.
This option is useful when creating financial reports.
Chapter 10. Formatting Reports 179

3. When producing reports in Excel 2007 format, if you do not want to group
repeating cells in lists and crosstabs, clear the Group repeating cells when
exporting to Excel check box.
When this check box is selected, grouped cells in crosstab rows and columns
and grouped columns in lists are merged into a cell area in the Excel output.
When the check box is cleared, merged cells are split.
Related concepts:
“Option to group repeating cells in reports produced in Excel 2007 format” on
page 36
When you produce reports in Excel 2007 format, you can specify whether
repeating cells are grouped, or merged, into a single cell.
Modify Object Styles
You can change the style of specific objects in your report to change its appearance.
Procedure
1. Click the object for which you want to change the style.
2. From the Style menu, click Style and click the Advanced tab.
3. Under Classes, click the edit button
.
4. Click the classes that you want to apply from the Local classes and Global
classes panes and then click the right arrow button.
5. If you applied more than one class, in the Selected classes pane, specify the
order in which the classes are applied by clicking each class and clicking the up
or down arrow button.
Classes in the Selected classes pane are applied from top to bottom. The style
properties from all classes are merged together when they are applied.
However, if the classes have style properties in common, the properties from
the last class applied override those from previous classes.
(Don't Print) Class
The (Don't Print) class allows HTML items to display in the Web browser but not
to print.
The (Don't Print) class behaves as follows in the various report output formats:
v HTML
The Web browser defines the behavior. The HTML standard is that the item
appears on the screen in the Web browser but is excluded by the print operation
of the Web browser.
v PDF
The item is excluded from the output.
v Microsoft Excel 2002 spreadsheet software
The class is specified in the HTML that IBM Cognos uses to render Microsoft
Excel 2002 output. However, Microsoft Excel 2002 does not appear to honor it
and displays the item as missing some or all other style definitions.
v Microsoft Excel 2007 spreadsheet software
The item is excluded from the output.
v CSV
The item is included in the output.
v XML
180 IBM Cognos Workspace Advanced Version 10.2.2: User Guide
The item is included in the output.
An alternative way to consistently exclude a report object from HTML, PDF and
Microsoft Excel output is to set the Box Type property for the object to None. CSV
and XML report outputs will still contain the object.
Modifying the Default Layout Style Sheet
In addition to modifying classes in a report, you can create and modify classes that
will apply to all reports. Default styles are stored in a style sheet named
GlobalReportStyles.css.
For information about modifying the style sheet, see the IBM Cognos Business
Intelligence Administration and Security Guide, or contact your administrator.
Chapter 10. Formatting Reports 181
182 IBM Cognos Workspace Advanced Version 10.2.2: User Guide

Chapter 11. Managing Existing Reports
You can save existing reports on your computer, copy them to the clipboard or
open them from the clipboard, and update them when your data package changes.
Copying the result of an analysis to a Microsoft Excel spreadsheet
You can copy the result of an analysis in IBM Cognos Workspace Advanced to a
Microsoft Excel spreadsheet. The data retains its table structure and simple
text-based formatting.
About this task
You can only paste the result of an analysis into a Microsoft Excel 2007 or later
version spreadsheet.
You can copy and paste an entire container, an outer container, or an inner
container of an object. For example, you can copy an entire crosstab or just part of
one.
Supported containers are:
v Lists
v Crosstabs
v Repeater tables
v Tables
Procedure
1. Select a container object.
2. From the Edit menu, click Copy Data.
3. In a Microsoft Excel spreadsheet, paste the data.
Copy a Report to the Clipboard
You can copy a report specification to the clipboard so you can open it from the
clipboard later.
This process is different for the Microsoft Internet Explorer and Mozilla Firefox
Web browsers because the clipboard works differently in each Web browser.
Related tasks:
“Open a Report from the Clipboard” on page 184
You can open a report specification that was previously copied to the clipboard.
Copy a Report to the Clipboard in Internet Explorer
This process is different for the Microsoft Internet Explorer and Mozilla Firefox
Web browsers because the clipboard works differently in each Web browser.
Procedure
From the Tools menu, click Copy To Clipboard.
© Copyright IBM Corp. 2005, 2014 183

Copy a Report to the Clipboard in Firefox
This process is different for the Microsoft Internet Explorer and Mozilla Firefox
Web browsers because the clipboard works differently in each Web browser.
Procedure
1. From the Tools menu, click Copy To Clipboard.
2. In the Copy Report to Clipboard dialog box, copy the entire report
specification.
3. Open a text editor and paste the report specification.
4. Copy all the text from the text editor report specification.
Now the text is saved on your computer's clipboard.
Open a Report from the Clipboard
You can open a report specification that was previously copied to the clipboard.
This is useful for importing an XML report specification from outside the IBM
Cognos Business Intelligence environment.
Although IBM Cognos Workspace Advanced attempts to validate the report
specification, it is your responsibility to ensure that it is correct. For more
information, see the IBM Cognos Software Development Kit Developer Guide.
Note: You cannot open a report from the clipboard when you have opened a
widget from a workspace in IBM Cognos Workspace to edit it in Cognos
Workspace Advanced.
Procedure
From the Tools menu, click Open Report from Clipboard.
Related concepts:
“Copy a Report to the Clipboard” on page 183
You can copy a report specification to the clipboard so you can open it from the
clipboard later.
Managing Changes in the Package
If changes were made to the package used to create a report, the report must be
updated. When you open a report, IBM Cognos Workspace Advanced
automatically checks to see if the package has changed. If it has, a message
appears indicating that the report will be updated to the latest version of the
package.
184 IBM Cognos Workspace Advanced Version 10.2.2: User Guide

Chapter 12. Working with your external data
You can supplement your enterprise data with your own external or personal data
file.
You can create a report that uses an external file that contains data that is not part
of your IBM Cognos Business Intelligence enterprise data. For example, you are an
analyst and you receive a spreadsheet that contains what-if data about opening
new branches of your retail store. You are asked to analyze the impact of these
possible new branches on existing sales volumes. You link this scenario data with
your enterprise data and create a professional report in IBM Cognos BI.
You import your own data file and start reporting on it right away. After you
import the file, it is protected by the same IBM Cognos security as your enterprise
data. As a result, you can report on your data in a secure and private environment.
You can import your external data in different tools.
My Data Sets tool
You can import the following types of files:
v Microsoft Excel (.xls and .xlsx) spreadsheet software files
v Delimited text files, such as .csv files
After you import your data, it is saved in a database. You then publish a
package that contains your data and you can then report on your data. You
can grant other users access to your personal data by sharing the
corresponding packages.
Manage External Data tool
You can import the following types of files:
v Microsoft Excel (.xls and .xlsx) spreadsheet software files
v Tab-delimited text (.txt) files
v Comma-separated (.csv) files
v XML (*.xml) files
After you import your data, you then publish a package that contains your
data in addition to the data contained in an existing package. You can then
report on your data.
To review an up-to-date list of the environments that are supported by IBM
Cognos products, including information about operating systems, patches,
browsers, web servers, directory servers, database servers, and application servers,
see Supported Software Environments (www.ibm.com/support/
docview.wss?uid=swg27042164).
My Data Sets
Use the My Data Sets tool to create reports that are based on your personal data
that is contained in delimited text files and Microsoft Excel (.xls and .xlsx)
spreadsheet software files.
© Copyright IBM Corp. 2005, 2014 185

You can access the My Data Sets tool from the IBM Cognos Welcome page and
from the My Area Options menu
in IBM Cognos Connection.
First, you import your Microsoft Excel (.xls and .xlsx) spreadsheet software files
and delimited text files, such as .csv files, into My Data Sets. Your data is then
saved in a database and is protected by the same IBM Cognos security as your
enterprise data. You then publish a stand-alone package to any location in IBM
Cognos Connection for which you have write permissions. As a result, you can
report on your data in a secure environment. You can see only your personal data
sets and can delete any packages or data sets that you created. You can grant other
users access to your personal data by sharing the corresponding packages.
The My Data Sets feature must be enabled by your Cognos Business Intelligence
administrator before you can use it.
For more information, see the following documents.
v IBM Cognos Connection User Guide
v IBM Cognos Business Intelligence Administration and Security Guide
Manage external data
You can supplement your enterprise data with your own external or personal data
file by using the Manage External Data tool in IBM Cognos Report Studio and
IBM Cognos Workspace Advanced.
You import your own data file and start reporting on it right away. After you
import the file, it is protected by the same IBM Cognos security as your enterprise
data. As a result, you can report on your data in a secure and private environment.
You can use the following types of files:
v Microsoft Excel (.xls) spreadsheet software files
The Manage External Data tool supports external data sources from Microsoft
Excel up to version Microsoft Excel 2007.
To review an up-to-date list of the environments that are supported by IBM
Cognos products, including information about operating systems, patches,
browsers, web servers, directory servers, database servers, and application
servers, see Supported Software Environments (www.ibm.com/support/
docview.wss?uid=swg27042164).
v Tab-delimited text (.txt) files
v Comma-separated (.csv) files
v XML (*.xml) files
Your XML files must adhere to the IBM Cognos schema specified at
c10_location/bin/xmldata.xsd. For more information, contact your IBM Cognos
administrator.
This schema consists of a dataset element, which contains a metadata element
and a data element. The metadata element contains the data item information in
item elements. The data element contains all the row and value elements.
For example, the following simple XML code produces a table with two columns
(Product Number and Color) and two rows of data.
<?xml version="1.0" ?> <dataset xmlns="http://developer.cognos.com/
schemas/xmldata/1/" xmlns:xs="http://www.w3.org/2001/XMLSchema-instance">
<metadata> <item name="Product Number" type="xs:string" length="6"
186 IBM Cognos Workspace Advanced Version 10.2.2: User Guide
scale="0" precision="2" /> <item name="Color" type="xs:string"
length="18" scale="0" precision="8" /> </metadata> <data> <row>
<value>1</value> <value>Red</value> </row> <row> <value>2</value>
<value>Blue</value> </row> </data> </dataset>
To work with your external data by using the Manage External Data tool, you
start with an existing IBM Cognos package. You import data from your external
file into the package and create links between data items in your file and data
items in your enterprise data source. You then publish a new package that you can
use to create reports that use your data and your enterprise data, or reports that
use only your data. You can link your external data with both dimensional and
relational data sources.
Before you can import your own external data file, your IBM Cognos administrator
must grant you permission for the Allow External Data capability that is found
within the Report Studio capability. You must also have permissions to use IBM
Cognos Report Studio or IBM Cognos Workspace Advanced. For more information,
see the IBM Cognos Business Intelligence Administration and Security Guide.
Packages that contain external data
When you import external data into a package with the Manage External Data
tool, you do not overwrite the original package. You create a new package that
includes the original package, the new external data, and any links or relationships
that you defined between the two. By default, the new package is saved in the My
Folders area of IBM Cognos Connection, with External Data appended to the
original package name. You can change where your package is published.
Note: The current content language is used to create the new package, and users
cannot select the language for the package. For example, the content language in
Cognos Connection is set to English. External data is imported into the GO Sales
(query) package, and a new package called GO Sales (query) External Data is
created. If the content language is changed to a different language, the package
name is not translated, even though GO Sales (query) is a multilingual package.
IBM Cognos samples
Sample external data sources in Microsoft Excel (.xls) format are provided with
IBM Cognos BI. You can import these sample files into the Sample Outdoors
Company sample reports that are found within the Cognos Workspace Advanced
folder of the GO Data Warehouse (analysis) or GO Data Warehouse (query)
package.
You can find sample external data source files on the server where IBM Cognos BI
is installed in the c10_location/webcontent/samples/datasources/other directory.
To obtain these files, contact your IBM Cognos administrator.
Preparing to Work with your External Data
To work with your external data, follow the process in this section.
There are four steps to preparing to work with your external data. The following
diagram details these steps.
Chapter 12. Working with your external data 187

1. Prepare your external data file for import.
Ensure that your external data file matches your enterprise data for your
reporting needs. For example, if your external data file contains sales values by
month, ensure that the formatting of months in your file matches the
formatting used in your enterprise data source. Ensure that you can uniquely
link at least one column from your external data file, such as product codes or
years, with your enterprise data source.
The maximum file size that you can import is 2.5 MB, with a maximum of
20000 rows. You can import a maximum of one external data file per package.
Your IBM Cognos modeler can override these governors in IBM Cognos
Framework Manager.
2. Import your external data.
You import your external data file from your own computer or from a location
on your network into an existing IBM Cognos package.
A step-by-step wizard guides you through importing your data. If you want to
create reports that contain data from both your external data file and your
enterprise data source, you must link data items from the two data sources.
You can import all or a subset of data columns from your external file.
By adding external data, you extend an existing IBM Cognos package definition
with the new data items from your file and you create a new package.
3. Create reports with your external data file.
After you import and link your external data, it appears as a new namespace in
the data tree of the Source tab
and is integrated with the IBM Cognos
content.
You can then create reports with your data and perform any operation, such as
filtering, sorting, grouping, or adding calculations. When you run the report, it
uses data items from your external data file.
You can save reports that contain your external data within the My Folders
area of the IBM Cognos portal.
4. Determine whether you want to share your reports that use external data with
other people in your organization. If you decide to share, take into account
these considerations.
Working with Date Data
If the data that you import contains dates, ensure that the dates use the format
yyyy-mm-dd.
Figure 47. Process to prepare to work with external data
188 IBM Cognos Workspace Advanced Version 10.2.2: User Guide

Working with Dimensional Data Sources
If your enterprise data source is dimensional, such as OLAP or
dimensionally-modeled relational, and you want to link your external data with
your enterprise data, you must first create a tabular or list report. Create and save
a list report with your enterprise data that contains the data items that you want to
use to link with your external data. Ensure that you remove the aggregate rows
that are automatically added in the footer of the list. This list is a projection of
your dimensional data source.
When you import your external data, use the list report that you created to link
your external data with the query subject from your enterprise data.
Data in your external file is relational by nature because it consists of tables and
rows. If your enterprise data source is dimensional, you can still import and work
with your external data. However, you cannot mix relational data from your
external data files, and dimensional data from your enterprise data source within
the same query. For example, a data container, such as a list, crosstab, or chart,
uses one query and you cannot mix relational and dimensional data within the
same list, crosstab, or chart. Doing so will cause an error.
If you want to use data from both the external data file and the original package
within the same query, you must link the external data to a query subject within
the current package instead of another report.
Working with External Data in an Unsecured IBM Cognos
Application
If your IBM Cognos application is not secured, and users can log on anonymously,
you may encounter issues if multiple people import external data in the same
package.
For example, Robert imports his external data into package A and saves the
package and reports he created in My Folders. Then, Valerie also imports her
external data into the same package A and saves the package in My Folders.
Valerie has therefore overwritten Robert's external data in package A. Now, if
Robert tries to run one of his reports, he encounters errors because his external
data is no longer in package A.
To avoid this problem,
v save packages that contain external data with a unique name.
v apply security to your IBM Cognos applications so that users do not share the
same My Folders area.
Import Data
You select the file to import from your own computer, or from your local area
network.
You select which columns to import.
You then specify a namespace to use. The namespace provides a unique name to
associate with the data items that you import. The namespace appears in the data
tree in the Source tab
and is used to organize the data items. By default, the
namespace is the imported file name without the extension.
Chapter 12. Working with your external data 189

If you change the default name for the namespace, you are prompted to select the
external data file each time that you run the report. To avoid this prompt, select
the Allow server to automatically load file check box.
Procedure
1. From the Tools menu, click Manage External Data.
Tip: You can also click the Manage External Data icon
at the top of the
Source tab .
2. On the Select Data page of the wizard, under External data file, click Browse
and select your external data file to import.
If you want the server to load the file without prompting users when they run
the report, select the Allow the server to automatically load the file check box.
If selected, you must use the Universal Naming Convention (UNC) path, such
as \\servername\filename, and you must ensure that the IBM Cognos server
has access to the file.
3. Under Data items, select the check box for the data items that you want to
import.
4. Type a name for the namespace and click Next.
The namespace appears in the Source tree, and identifies the external data
within the package. By default, the name is the name of your imported external
data file.
5. If you do not want to link your data or change the data attributes, click Finish
now.
Related tasks:
“MSR-PD-0012 error when importing external data” on page 209
When you try to import an external data file, you receive an MSR-PD-0012 error.
“MSR-PD-0013 error when importing external data” on page 209
When you try to import an external data file, you receive an MSR-PD-0013 error.
Map Data
If you want to create reports that contain data from both your external file and
from your enterprise data, you must link at least one query subject from your
package or from an existing report to a data item in your external data. This
mapping creates a relationship between your external data and your enterprise
data. For example, your external data contains information about employees,
including an employee number. You map the employee number from your external
data file to the employee number in your enterprise data. This ensures that your
data is integrated smoothly.
About this task
Mapping a data item in your external data to a query subject that references other
query subjects is not supported. For example, the query subject cannot contain a
calculation that references a query item from another query subject. Such a
mapping produces the following error message:
MSR-PD-0001 Failed to relate external data to objects in the underlying package. The item
[query item] does not lead to a query subject.
190 IBM Cognos Workspace Advanced Version 10.2.2: User Guide

Procedure
1. On the Data Mapping page, link existing query subjects in your enterprise data
to data items in your external data file.
2. Under Existing query subject / report, click the ellipsis button and do one of
the following:
v If you want to select a query subject from the data tree, click Choose Query
Subject and select a query subject.
Note: This option is not available when working with dimensional packages.
v If you want to select from the query subjects included in a report, click
Choose a Report and select a report.
3. Click the two data items that you want to link and click the New link button.
You cannot link a data item in your external data to a calculation in a query
subject.
A link appears linking two data items.
Tip: You can create multiple links for multiple data items. To delete a link,
select the link and click Delete Link.
4. If your report is using the dynamic query mode, specify the type of filter to
generate for the join relationship by clicking the Join filter type (DQM only)
menu and choosing one of the available values.
A join relationship is created when you link data items. The filter type is used
to optimize the join relationship. In generates an IN predicate of constant
values. Between generates a BETWEEN predicate using the minimum and
maximum values of the join keys. Table generates a table row constructor form
of the IN predicate. The default value is In.
5. Click Next.
Finish Importing Data
You can change how query items from your external data file appear after they are
imported into IBM Cognos Business Intelligence. For example, you can change the
number of decimal places or the default summary.
If you want to use numeric data from your external data source as a measure in a
crosstab, you must assign that data item a default summary other than
Unsupported. A specified default summary makes the data item appear as a
measure in the data tree in the Source tab
. Otherwise, if you add the data
item with an Unsupported default summary as the measure in a crosstab, no
values appear.
Attribute Description
Data type Identifies whether data in the file is one of the following types:
Integer, which represents numeric values.
Decimal, which represents integer values that are scaled by a
variable power of 10.
Text, which represents values that contain letters and symbols.
Date or Date Time, which represent dates and times.
Chapter 12. Working with your external data 191

Attribute Description
Default summary Identifies Sum, Average, Max, Min, Count or Unsupported as the
default type of summary for the data item.
Applies only to Integer and Decimal data types.
Decimal places Specifies the number of decimal places for the data item.
Applies only to the Decimal data type.
If you mapped links between data items in your external data and data items in
your enterprise data, specify the options that define the relationships between the
data items.
For each data item that you import and link, specify whether values are unique or
exist more than once in both your external data and in your enterprise data. You
can also specify how to handle rows that contain missing values in the report
results.
Procedure
1. On the Data Attributes page, specify the attributes for each data item after it is
imported and click Next.
For example, if you import numeric data items, you can change the default
summary and number of decimal places.
2. On the Mapping Options page, specify the relationships between the linked
data items and how to process the results in the report output.
3. Click Finish.
Publish the Package
You can change the name and location of the package with your external data to
help you differentiate between data packages.
Procedure
1. If you want to rename the package that will be published or change the
location where it is published, do the following:
v In the Manage External Data dialog, under Package name, click the ellipsis
button.
v Type a new name for the package and select the location where to save it.
v Click Save.
2. Click Publish.
Results
IBM Cognos Business Intelligence imports your external data into a new package.
A namespace with the data items from your external file appears in the data tree in
the Source tab
.
You can now create reports with your external data.
Edit Your External Data
After you import your data, you can change the data mappings and options that
you originally specified and republish the package.
192 IBM Cognos Workspace Advanced Version 10.2.2: User Guide

You can
v Rename the namespace, which renames the organizational folder that appears in
the data tree in the Source tab
. If you change the namespace, you are
prompted for the external data file when you run the report.
v Change which columns to import.
v Change the data mapping links.
v Change the data attributes.
v Change the mapping options.
You can also import multiple external data files into the same package. To do this,
your data modeler must modify governors in the model and republish the package
that contains your enterprise data. For more information, see the IBM Cognos
Framework Manager User Guide.
Procedure
1. From the Tools menu, click Manage External Data .
2. In the Manage External Data dialog box, select the external data to edit and
click the Edit icon
.
3. In the left pane, select the options that you want to change.
4. Click OK and then republish the package.
Results
IBM Cognos Business Intelligence reimports your external data and updates the
data items that appears in the data tree in the Source tab
.
You can now create and update reports with your external data.
Delete Your External Data
You can delete your external data from within the package that you created if you
no longer need it.
Procedure
1. From the Tools menu, click Manage External Data .
2. In the Manage External Data dialog box, select the external data package to
delete and click the delete button
.
3. Click Publish.
Results
The external data namespace is removed from the package.
If you also no longer require the external data package or any reports created with
the package, you can delete it from within IBM Cognos Connection.
Chapter 12. Working with your external data 193
Running a Report That Contains External Data
Reports that contain external data run the same way as reports that contain only
enterprise data. If you have access to the report, you will also have access to the
external data included within the report.
You may be prompted to select the location of the external data file when you run
the report if either
v the report author did not specify to automatically load the file.
v the IBM Cognos Business Intelligence server cannot locate the file.
However, you are not re-prompted within the same Web browser session.
You can determine whether data in a report uses external data by tracing its
lineage. For more information, see “View Lineage Information for a Data Item” on
page 41.
Making your Reports Public
After you create a report that uses your external data, you may want to make it
public to share it with coworkers. They can run your report using your external
data file that you made available on a public network drive that the IBM Cognos
server can access. They can also use their own version of the file. If they use their
own version, the file must contain the same columns as your original external data
file that you used to import the data and create the report. In addition, you must
clear the Allow server to automatically load file check box in the Select Data
page of the Manage External Data wizard.
To make reports public, you must save them in the Public Folders area of the IBM
Cognos portal. To save content in Public Folders, you must have the appropriate
permissions. Contact your IBM Cognos administrator to obtain permissions and to
inform him or her that you are sharing a package or files.
If you share your reports, ensure that you maintain the reports.
194 IBM Cognos Workspace Advanced Version 10.2.2: User Guide

Chapter 13. Upgrading Reports
When you open a report that was created in a previous version of IBM Cognos
Business Intelligence, it is automatically upgraded.
Any problems detected during the upgrade process appear as information
messages
and error messages in the Upgrade Information dialog box.
You must fix any errors in the report and then validate the report before you can
run it. In some cases, the information or error message is linked to the location of
the issue in your report. To go to the location of the issue, click the message, and
then click Select. If only warnings and information appear in the dialog box, these
will disappear when you click OK.
Tip: To view this dialog box again, from the File menu, click Upgrade
Information.
After you upgrade a report to the most recent version of IBM Cognos BI, you can
no longer open it with a previous version.
Lifecycle Manager
You can download IBM Cognos Lifecycle Manager from http://www.ibm.com/ to
help you test your reports. Lifecycle Manager is a verification tool that checks that
your reports run and produce the same results in the new environment.
Lifecycle Manager is a Microsoft Windows operating system-based application for
auditing upgrades to the latest version of IBM Cognos BI from IBM Cognos
ReportNet 1.1 MR3 or MR4, and from IBM Cognos 8 versions 8.2, 8.3, or 8.4.
It provides a verification feature that validates, executes, and compares report
results from two different IBM Cognos BI releases. This helps to identify upgrade
and compatibility issues between releases. User interface design and status
reporting functionality provide both a proven practice process and support for
upgrade project planning and status reporting. Lifecycle Manager also automates
much of the process of bundling the required files, such as reports and models, for
the test case. For more information, see the Lifecycle Manager User Guide.
Upgrading Reports from IBM Cognos Business Intelligence Version 8.4
When you upgrade IBM Cognos BI to version 10.1.0 or later, some reports may
look or behave differently after the upgrade. This section describes changes that
you may encounter in your reports.
Tips for Report Studio Express Authoring Users
IBM Cognos Workspace Advanced is both an extension of and a replacement for
IBM Cognos Report Studio Express authoring mode, which allowed financial
analysts to create statement-style reports. The Report Studio Express authoring
mode allowed you to create only crosstabs with dimensional data sources, with no
relational or charting support.
© Copyright IBM Corp. 2005, 2014 195

Cognos Workspace Advanced is a unified authoring and analysis environment for
the more advanced business users who want additional insight into their business.
It offers full support for list reports, charts, and relational data sources, and offers
an entirely different user experience.
Because the user interface of Cognos Workspace Advanced is designed for data
exploration, some default behaviors have changed from the Report Studio Express
authoring mode in version 8.4.
If you prefer to use the defaults from version 8.4, you can configure Cognos
Workspace Advanced to behave like the Report Studio Express authoring mode
(Tools, Options).
Below is a list of changed behaviors.
Action
Behavior in Report Studio
Express Authoring Mode
version 8.4
Behavior in Cognos
Workspace Advanced
versions 10.1.0 and later
Double-clicking a data item
(for dimensional data
sources).
Also applies to Report
Studio.
Inserts children. Drills down.
You can change the behavior
of double-clicking a member
(Tools, Options, Edit tab,
Double-click on member
action).
Inserting members from the
data tree (for dimensional
data sources).
Inserts individual members
(not in sets).
Inserts the member and its
children, and creates a set.
To change how members are
inserted, in the Source tab
, click the insert
member with children button
and select how to
insert member.
To toggle between adding
individual members and
creating sets for members, in
the Source tab
, click
the create sets for members
button
.
Location of the content pane. Content pane is on the left
side.
Content pane (Insertable
Objects) is on the right side.
You can move the pane to
the left side (Tools, Options,
View tab, Position pane on
the right (requires restart)).
196 IBM Cognos Workspace Advanced Version 10.2.2: User Guide
Upgrading Report Styles
IBM Cognos Business Intelligence Version 10.1.0 and later includes a new default
report style with updated colors and gradients. If your report uses a custom report
template, your report will appear the same in this version of IBM Cognos BI as it
did in previous versions. By default, new reports and new report objects, such a
lists and crosstabs, appear in the new report style.
If you want to continue to work with the previous 8.x report style, set the
Override 10.x styles with 8.x styles on new reports option (Tools, Options,
Advanced tab).
To update the style of an upgraded report to use the new 10.x style click File >
Report Properties, then from the Report styles list, select 10.x styles.
Note: You cannot edit the report style when you have opened a widget from a
workspace in IBM Cognos Workspace to edit it in IBM Cognos Workspace
Advanced.
Related concepts:
“Modifying Report and Object Styles” on page 179
Objects in reports are assigned a Cascading Style Sheet (CSS) class that provides a
default style for the object. For example, when you create a new report, the report
title has the class property Report title text assigned to it. In addition, objects
inherit the classes set on their parent objects.
Chapter 13. Upgrading Reports 197
198 IBM Cognos Workspace Advanced Version 10.2.2: User Guide

Chapter 14. Samples
Sample reports are included with IBM Cognos BI. When installed, you can find
them in the Public Folders tab in IBM Cognos Connection.
The Sample Outdoors Company
The Sample Outdoors Company samples illustrate product features and technical
and business best practices.
You can also use them for experimenting with and sharing report design
techniques and for troubleshooting. As you use the samples, you can connect to
features in the product.
The Sample Outdoors Company, or GO Sales, or any variation of the Sample
Outdoors name, is the name of a fictitious business operation whose sample data is
used to develop sample applications for IBM and IBM customers. Its fictitious
records include sample data for sales transactions, product distribution, finance,
and human resources. Any resemblance to actual names, addresses, contact
numbers, or transaction values, is coincidental. Unauthorized duplication is
prohibited.
Samples outline
The samples consist of the following:
v Two databases that contain all corporate data, and the related sample models for
query and analysis
v Sample cubes and the related models
v A metrics data source including associated metrics and a strategy map for the
consolidated company, and a model for Metric extracts.
v Reports, queries, query templates, and workspaces
To run interactive reports, scripts are required. To see all the reports included in
the samples packages, copy the files from the samples content installation into
deployment folder and then import the deployments into the IBM Cognos
Business Intelligence product.
Security
Samples are available to all users.
Samples in the GO Data Warehouse (analysis) Package
The following reports are some of the reports found in the GO Data Warehouse
(analysis) package.
Sample reports that were created in Report Studio are located in the Active Report
folder and the Report Studio Report Samples folder.
© Copyright IBM Corp. 2005, 2014 199

Promotion Success
This report shows the financial results of the company’s promotional campaigns,
including how much of the company’s total revenue is attributable to each
promotional campaign. This report can be used as an existing report for the
external data sample files.
This report uses the following features:
v lists
v grouping
v summarizing
v text items
v tables
v custom headers and footers
Retailer sales target
This report shows sales targets by year and retailer site. This report can be used as
an existing report for the external data sample files.
This report uses the following features:
v lists
v foreground colors
v font sizes
v custom headers
Samples in the GO Data Warehouse (query) Package
The following reports are some of the reports found in the GO Data Warehouse
(query) package.
Sample reports that were created in Report Studio are located in the Active Report
folder and the Report Studio Report Samples folder.
Employee Expenses by Region
This report shows the employee expenses result by regions. This report can be
used as an existing report for the external data sample files.
This report uses the following features:
v lists
v grouping
v custom footers
Returns by Product Brand
This report provides information about the returned items situation by returns
reason and product brand. This report can be used as an existing report for the
external data sample files.
This report uses the following features:
v lists
v groupings
200 IBM Cognos Workspace Advanced Version 10.2.2: User Guide

Appendix A. Accessibility Features
Accessibility features help users who have a physical disability, such as restricted
mobility or limited vision, to use information technology products.
See the IBM Accessibility Center (http://www.ibm.com/able) for more information
about the commitment that IBM has to accessibility.
Accessibility features in IBM Cognos Workspace Advanced
There are several accessibility features in IBM Cognos Workspace Advanced.
The major accessibility features are described in the following list:
v You can use command keys, or shortcut keys, to navigate through Cognos
Workspace Advanced. Shortcut keys directly trigger an action and usually use
the Ctrl keys.
v Cognos Workspace Advanced uses Web Accessibility Initiative—Accessible Rich
Internet Applications (WAI-ARIA). This means that people with limited vision
can use screen-reader software, along with a digital speech synthesizer, to listen
to what is displayed on the screen.
To take full advantage of the accessible features of Cognos Workspace Advanced,
use the Freedom Scientific JAWS screen-reader software with a Mozilla Firefox web
browser.
To review an up-to-date list of the environments that are supported by IBM
Cognos products, including information about operating systems, patches,
browsers, web servers, directory servers, database servers, and application servers,
see Supported Software Environments (http://www.ibm.com/support/
docview.wss?uid=swg27042164).
Keyboard Shortcuts
This product uses some standard Microsoft Windows and accessibility shortcut
keys.
Action Shortcut keys
Enables or disables the accessibility feature.
You must restart IBM Cognos Workspace
Advanced after enabling or disabling this
feature for it to take effect. The feature is
disabled by default.
Ctrl+Alt+A
Tip: You can also enable or disable the
accessibility feature by selecting or clearing
the Enable accessibility (requires restart)
check box (Tools > Options > Advanced >
Enable accessibility (requires restart)).
Opens the context menu for the selected
item, if available.
Shift+F10
Switches focus from or to the main menu
and the main worksheet.
Ctrl+F10
© Copyright IBM Corp. 2005, 2014 201

Action Shortcut keys
Opens the online help. F1
Closes the Web browser window. Alt+F4
Copies objects. Ctrl+C
Pastes objects. Ctrl+V
Considerations to Improve Report Accessibility
Creating accessible reports ensures access of information to all users, with all levels
of ability.
For example, people with a visual impairment may use screen reading technology
to access the information in a report.
The following are some design considerations for creating accessible reports:
v Avoid using visual cues, such as bold text or color, to convey important
information.
v Avoid using pictures and OLE Objects in PDF documents, as these items are
tagged as artifacts and ignored by the screen reader.
v Avoid using conditional formatting to convey important information.
v When selecting color palettes for report objects, choose patterns or shades of
gray.
v Ensure that there is a table corresponding to chart types that are rendered as
images because the screen reader ignores this information.
v Ensure that the report has a title.
v Gain an understanding for screen reading technology.
v Avoid spelling and grammatical errors, as they cause the screen reading software
to misinterpret the information.
v Avoid using features like calendar boxes and up and down selections on time
controls. Instead use prompts such as check boxes, radio buttons, combo boxes,
and multi-select boxes.
v Ensure that the target application is accessible when using embedded Web
applications or drill-through paths.
v Avoid using large, complex list or crosstab reports.
Displaying the information in multiple simple lists or crosstab reports is more
manageable for assistive technology users.
v Add alternate text to images, charts, and other visual objects so that screen
readers can provide context for them.
v When using tables, add summary text to provide context for the table content. If
the top cells in a table behave as headers, designate these cells as headers so that
screen readers can identify the relationships.
Enable Accessible Report Outputs
If you want to include accessibility features, such as alternate text, summary text,
and designated cell headers in tables, you must enable these accessibility features
in the report output.
You can enable accessible report outputs in one of the following ways:
202 IBM Cognos Workspace Advanced Version 10.2.2: User Guide

v in the IBM Cognos Workspace Advanced run options, so that the report has
accessibility features enabled when you run the report from within Cognos
Workspace Advanced.
v in IBM Cognos Connection as a run option (Run with options, Enable
accessibility support), so that report consumers can run the report once with
accessibility features.
v in IBM Cognos Connection as a property (Set properties, Report tab), so that
report consumers can always run the report with accessibility features.
v in IBM Cognos Connection, as a user preference (My area, My preferences), so
that report consumers can enable accessibility features for all of their reports.
Accessibility settings in the report properties overwrite this setting.
v in IBM Cognos Administration, as a server-wide option, so that all reports for all
IBM Cognos users have accessibility features enabled. Accessibility settings in
the user preferences and report properties overwrite this setting.
Administrators can also change a system-level setting that forces the accessibility
features on or off regardless of any other settings.
For information about the last four options, see the IBM Cognos Connection User
Guide or the IBM Cognos Administration and Security Guide.
Procedure
From the Run menu, click Run Options and select the Include accessibility
features check box.
Add Alternate Text to Images and Charts
You can add alternate text for images, maps, and charts to make your reports
accessible. When a screen reader encounters one of these objects, it reads the
alternate text that you added to the object.
You can add translations for the text to support users in multiple languages. When
users run a report, IBM Cognos Business Intelligence uses the alternate text in the
appropriate language.
If you use images only for visual spacing in your report, leave the Alternate Text
property empty.
Procedure
1. Select the image or chart object.
2. In the Properties pane, click the select ancestor button
and select the
Image, Map, or chart object.
3. Double-click the Alternate Text property.
4. Select Specified text and click the ellipsis (...) button.
5. In the Default text box, type a description for the object, and click the add icon
.
6. In the Languages dialog box, select the languages that apply to your text.
7. Double-click a language and type the translation of the text for each language.
8. From the Run menu, click Run Options and select the Include accessibility
features checkbox.
Appendix A. Accessibility Features 203

Add Summary Text to Tables
You can provide summary text for crosstabs, lists, repeater tables, and table objects.
This text provides context for the entire object to make your reports accessible.
When a screen reader encounters one of these objects in HTML report outputs, it
reads the description that you added to the object.
The table summary is not displayed in visual Web browsers. Only screen readers
and speech browsers use the summary text. The summary text is usually read
immediately before the table caption.
You can add translations for the text to support users in multiple languages. When
users run a report, IBM Cognos BI uses the summary text in the appropriate
language.
If you use tables for report layout, leave the summary empty to indicate to screen
readers that the table is used exclusively for visual layout and not for presenting
tabular data.
Procedure
1. Select the crosstab, list, or table.
2. In the Properties pane, click the select ancestor icon
and select the
Crosstab, List, Repeater Table,orTable object.
3. Click the Summary text property.
4. Select Specified text and click the ellipsis (...) button.
5. In the Default text box, type a description for the object, and click the add icon
.
6. In the Languages dialog box, select the languages that apply to your text.
7. Double-click a language and type the translation of the text for each language.
8. From the Run menu, click Run Options and select the Include accessibility
features checkbox.
Designate Cells Headers in Tables
You can specify whether specific table cells are table headers. This allows screen
readers and speech browsers to identify the relationships between the cells in your
tables.
Procedure
1. Select the table cells.
2. In the Properties pane, set the Table Header property to Yes.
3. From the Run menu, click Run Options and select the Include accessibility
features checkbox.
IBM and Accessibility
See the IBM Accessibility Center for more information about the commitment that
IBM has to accessibility.
The accessibility center is online at http://www.ibm.com/able.
204 IBM Cognos Workspace Advanced Version 10.2.2: User Guide

Appendix B. Troubleshooting
This appendix describes some common problems you may encounter.
For more troubleshooting problems, see the IBM Cognos Business Intelligence
Troubleshooting Guide.
Auto Correct Errors in a Report
When you are in Page Preview mode, IBM Cognos Workspace Advanced shows
you data as you are creating your report.
However, if an error occurs and the application cannot retrieve the data, you can
use the auto-correct feature to determine if there are any incorrect items in your
report. Cognos Workspace Advanced provides a list of such items, each of which
you can then remove to successfully view your report.
For example, if your report refers to member unique names (MUNs) that are either
no longer present in the model or inaccessible due to security restrictions, you
cannot view your report in Page Preview mode.
If the auto-correct feature cannot identify any incorrect items in your report, you
can switch to Page Design mode and manually remove or edit incorrect items, or
contact your administrator.
To access the auto-correct feature, from the Tools menu, click Auto Correct.
Note: You cannot use the auto-correct feature when you have opened a widget
from a workspace in IBM Cognos Workspace to edit it in Cognos Workspace
Advanced.
Problems Creating Reports
The topics in this section document problems you may encounter when creating
reports.
Metadata Change in Oracle Essbase Not Reflected in Reports
and in the Studios
When there is a metadata change on the Oracle Essbase server, the change is not
immediately reflected in the metadata tree in the studios. In addition, when a
report is run, the report does not pick up the republished changes.
To view the new structure, you must restart the IBM Cognos Content Manager
server.
Relationships Not Maintained in a Report With Overlapping
Set Levels
In a report, the relationship between nested or parallel member sets at overlapping
levels in the same dimension may not always be maintained.
© Copyright IBM Corp. 2005, 2014 205

For example, a named set in the data source that contains members from both a
Year and Month member is nested under Year, but is not properly grouped by
year.
In another example, an error message such as this appears:
OP-ERR-0201 Values cannot be computed correctly in the presence of multiple hierarchies
([Product].[B1], [Product].[Product]) that each have a level based on the same attribute
(Product).
This problem occurs in the following scenarios involving non-measure data items
X and Y, which overlap in the same dimension:
v X and Y together as ungrouped report details
v Y nested under X
v Y appended as an attribute of a group based on X
When using named sets, or sets that cover more than one level of a hierarchy, do
not use sets from the same dimension in more than one place in the same report.
They should appear on only one level of one edge.
Unexpected Summary Values in Nested Sets
If a report contains nested sets, summaries other than the inner set summaries may
contain unexpected values. For example, you insert a summary in a crosstab that
contains a set with years in the rows.
You then nest a product line set within years.
Notice that the summary value does not change to represent the total of the new
values. This occurs because the within set aggregation used with dimensional
packages does not take into account sets that are nested below the set that is
summarized.
To show the correct summary values, if the inner and outer sets do not belong to
the same dimension, you can nest a copy of the inner summary item under the
outer summary item, as follows.
Figure 48. Example of revenue numbers for the years 2012 and 2013
Figure 49. Example of revenue numbers for the listed products for the years 2012 and 2013
206 IBM Cognos Workspace Advanced Version 10.2.2: User Guide

Limited Support for Relational Functions When Used with
OLAP Data Sources
When working with an OLAP data source, we recommend that you not use
relational functions, such as substring and concatenation functions, in a report that
also contains a measure with the Aggregate Function property set to Calculated or
Automatic in the model. If you do so, you may encounter unexpected results. For
example, some summaries are calculated using the Minimum function instead of
the aggregate function derived from the individual query items.
In the expression editor, an exclamation mark (!) that precedes a function indicates
that the function is not naturally supported for that data source. IBM Cognos
Business Intelligence uses a local approximation for that function. Because an
approximation is used, performance can be degraded and the results may not be
what you expect.
For example, you create an IBM Cognos Query Studio report that contains the data
items Product line and Retailer site count. The footer summary is set to Calculated.
You then insert a calculated column that returns the first three characters of the
Product line item, which uses the relational concatenation function. The footer
summary now shows the lowest gross margin value.
For more information about aggregation functions, see the IBM Cognos Query
Studio User Guide or the IBM Cognos Report Studio User Guide.
Columns, Rows, or Data Disappear With SSAS 2005 Cubes
Microsoft SQL Server 2005 Analysis Services (SSAS) has a feature called AutoExists
that removes tuples that have no facts at the intersection of two hierarchies of the
same dimension.
Columns, rows, or data can disappear if you set the default member of a hierarchy
to a member that does not exist with every other member in the dimension. To
Figure 50. Example of the combined aggregate set for the years 2012 and 2013
Figure 51. A report that contains a calculated footer summary
Appendix B. Troubleshooting 207
avoid this problem, change the default member that caused the disappearance to a
member that exists with all other members in the dimension.
Columns, rows, or data can also disappear if members are specified that result in
one or more non-existent tuples. There is currently no workaround for this
scenario. For more information, see Microsoft Knowledge Base article #944527 at
http://support.microsoft.com.
You may also encounter unexpected results if the default member of a hierarchy is
a member that doesn't also exist in all other hierarchies in the dimension, and if
you query members from different hierarchies in the same dimension.
For example a crosstab includes the following (using the Adventure Works cube):
v Rows: Generate([Adventure_Works].[Account].[Accounts],set([Balance
Sheet],[Units])) nested with
children([Adventure_Works].[Department].[Departments]-
>:[YK].[[Department]].[Departments]].&[1]]])
v Column: [Adventure_Works].[Account].[Account Number].[Account Number]
v Measure: [Adventure_Works].[Measures].[Amount]
You run the report and notice that the query renders with some blanks cells. You
then apply the simple detail filter [Amount]>1 and run the report. Only row labels
are displayed and all data and columns are missing.
In the Adventure Works cube, the [Account].[Accounts] attribute has a default
member set to [Net Income]. When evaluating the GENERATE set expression,
SSAS looks in the entire cube space and looks at all coordinates for the [Account]
dimension. These coordinates include both [Account][Account Type].&[] and
[Account].[Accounts].[Net Income]. Because these two coordinates don't exist
within the same hierarchy, SSAS returns an empty set.
To avoid this problem the SSAS administrator must set the default member in the
cube to a member that exists in all other hierarchies.
Report Differences Between TM1 Executive Viewer and IBM
Cognos Business Intelligence with TM1 Data Sources
When using an IBM Cognos TM1
®
data source, comparable reports created in an
IBM Cognos Business Intelligence studio and in TM1 Executive Viewer may
contain different cell values. This occurs because the TM1 Executive Viewer
product uses an algorithm for selecting default members for non-projected
dimensions that differs slightly from traditional OLAP clients.
To avoid this problem, when filtering your reports in the IBM Cognos Business
Intelligence studios, use context filters that match the default selections shown in
the Executive Viewer user interface. This ensures that the cell values in IBM
Cognos Business Intelligence match the values in Executive Viewer.
Order of Metadata Tree Differs for TM1 Data Sources
When using a an IBM Cognos TM1 data source, the order of members in the
metadata tree of the Source tab of an IBM Cognos Business Intelligence studio may
differ from the order shown in TM1 Architect.
208 IBM Cognos Workspace Advanced Version 10.2.2: User Guide

By default, TM1 Architect renders members of hierarchies using a slightly different
algorithm than does IBM Cognos BI. IBM Cognos BI automatically renders
member metadata from TM1 data sources in hierarchical order.
From within TM1 Architect, if you want to see how an IBM Cognos BI studio will
render a hierarchy, click the Hierarchy Sort button.
Problems Calculating Data
The topics in this section document problems you may encounter when calculating
or summarizing data.
Incorrect Results with IBM Cognos PowerCubes and Time
Measures
If a report uses an IBM Cognos PowerCube data source and a combination of data
items, you will encounter incorrect results.
The following combination of data items in a report that uses an IBM Cognos
PowerCube data source will give incorrect results.
v a measure with a Time State Rollup set to Average or Weighted Average
v an aggregate ( members from time dimension ) expression
v an intersection with a member in a relative time hierarchy
To avoid incorrect results, do not use this combination in your reports.
Problems importing external data
The topics in this section document problems you may encounter when importing
external data.
MSR-PD-0012 error when importing external data
When you try to import an external data file, you receive an MSR-PD-0012 error.
MSR-PD-0012: Unable to upload the specified external data file. It exceeds the permitted
file size of "0(KB)", as specified by your system administrator.
This error occurs when the size of the file you are trying to import is greater than
the value specified for the Maximum external data file size (KB) governor in the
Framework Manager model.
To resolve the issue, the modeler must update the governor, save the model, and
republish the package.
MSR-PD-0013 error when importing external data
When you try to import an external data file, you receive an MSR-PD-0013 error.
MSR-PD-0013: Unable to upload the specified external data file. It exceeds the permitted
maximum number of rows "0", as specified by your system administrator.
This error occurs when the number of lines in the file you are trying to import is
greater than the value specified for the Maximum external data row count
governor in the Framework Manager model.
Appendix B. Troubleshooting 209

To resolve the issue, the modeler must update the governor, save the model, and
republish the package.
Problems Running Reports
The topics in this section document problems you may encounter when viewing or
running reports.
Measure Format Disappears in SSAS 2005
Microsoft SQL Server 2005 Analysis Services (SSAS) does not propagate formatting
through calculations. IBM Cognos compensates for this whenever possible, but
cannot guarantee to do so in all cases. As a result, if you are working with a
Microsoft SSAS cube, any calculation (other than a non-count summary) that is
based on or intersects with a formatted measure, such as a currency, may lose the
measure format. This may also happen if you use a detail filter or context filter
(slicer).
For example, a crosstab includes members on one edge and a measure with
formatting, such as a currency symbol and decimal places, applied on the other
edge. When you run the report, you see the formatting for each cell. However, if
you add a detail filter, such as measure > 1 and run the report, all the formatting
disappears.
Additionally, the fine details of the MDX generated by IBM Cognos Business
Intelligence can change from release to release. As the SSAS behavior depends on
the MDX generated, the loss of formatting in reports might not occur in a future
release.
To avoid this problem, specify explicit formatting for the affected row, column, or
cell.
Cognos Statistics object is not displayed in a report
An IBM Cognos Statistics object is not displayed in a report.
Each removed statistical object is replaced with an image in the report:
Beginning with IBM Cognos Business Intelligence version 10.2.1, IBM Cognos
Statistics is no longer available.
To ensure that reports that were created in previous releases and that contain
statistical objects run, statistical objects are removed when the reports are
upgraded.
Tip: Queries, and their data items, that are associated to statistical objects are not
removed from upgraded reports.
You can use IBM SPSS Statistics to perform statistical reporting and analysis.
Figure 52. Image that replaces statistical objects in upgraded reports
210 IBM Cognos Workspace Advanced Version 10.2.2: User Guide

Appendix C. Limitations When Producing Reports in Microsoft
Excel Format
There are limitations when producing reports in Microsoft Excel format.
Unable to Load Images from the IBM Cognos Business Intelligence
Content Store in a Report
If a report contains an image whose URL points to the IBM Cognos Business
Intelligence content store, the Microsoft Excel spreadsheet software generates an
access violation error and shuts down.
This problem is a known issue in the Microsoft knowledge base, and Microsoft is
currently investigating the problem. This problem occurs only in Excel 2002.
Blank Worksheet Appears
If the Microsoft Excel spreadsheet software cannot download a worksheet within a
timeout period, Excel may instead open a blank worksheet.
Warning Message Appears When Excel Opens an IBM Cognos
Business Intelligence Report
Each time the Microsoft Excel spreadsheet software opens an IBM Cognos Business
Intelligence report, a warning message appears.
The warning message is as follows:
Some of the files in this Web page are not in the expected location. Do you want to
download them anyway? If you are sure the Web page is from a trusted source,
click Yes.
The Excel workbook in HTML/XML format requires the presence of the file
filelist.xml. IBM Cognos BI does not allow the creation of local files on the client
side. In addition, a local file that contains URLs introduces a security issue.
Consequently, this message will appear whenever you open an IBM Cognos BI
report in Excel. If you see this error message, click Yes to open the report.
Spreadsheet Content Not Saved for Reports Saved in XLS Format
If you open a report that was saved in XLS format or run a report in XLS format,
and security settings in your Web browser are set so that you are prompted to
open or save the report, do not click Save. If you save the report, the spreadsheet
content will not be saved. This is because Microsoft Excel reports in Microsoft
Office 2000 HTML format use relative paths to the spreadsheets. The relative URL
paths are no longer available when you open a saved XLS report.
Instead, click Open first and then choose to save the report.
© Copyright IBM Corp. 2005, 2014 211

Unable to Load Excel Report in Netscape 7.01
This version of IBM Cognos Business Intelligence does not support loading
Microsoft Excel reports in Netscape 7.01.
Unsupported IBM Cognos BI Formatting
About 30% of the formatting functions available in IBM Cognos Business
Intelligence are not supported in the Microsoft Excel spreadsheet software.
In particular, Excel does not allow changing locale-dependent formatting attributes,
such as the following:
v Decimal Separator
v Exponential Symbol
v Group Separator
v Monetary Decimal Separator
v AM String
v Day Name
v Day Short Name
v Decimal Delimiter Symbol
v Month Name
v Month Short Name
v PM String
In addition, Excel does not support the following:
v Format Width
v International Currency Symbol
v List Separator
v Percent Symbol (Excel does not support percent symbols for charts)
v Multiplier
v Overline Text Format
v PerMill Symbol
v Plus Sign
v Scale (Excel has a different scaling formula than IBM Cognos BI)
v Calendar (Excel does not allow changing the calendar)
v Era Name
v First Day Of Week
v Show Era
Cells Contain Series of #
Cells in the Microsoft Excel spreadsheet software have a limit of 255 characters. If
your report contains text strings that are longer than 255 characters, they will be
formatted as text and appear as ######.
To resolve this problem, use fewer characters.
212 IBM Cognos Workspace Advanced Version 10.2.2: User Guide
Excel Cannot Render Reports with More Than 256 Columns
The Microsoft Excel spreadsheet software limits the size of a worksheet size to
65,536 rows by 256 columns.
If your report contains more than 65,536 rows, it is split into multiple worksheets.
The number of worksheets that your report can contain is limited by the physical
memory of your computer. If your report contains more than 256 columns, the
following error occurs:
Reports with more than 256 columns cannot be rendered in Excel.
Table and Column Widths
The Microsoft Excel spreadsheet software does not support using percentages to
determine the width of tables.
If the report contains only one table, the value of the width attribute for the Table
element in the report specification determines the width of the table in the Excel
worksheet. If the report contains more than one table, Excel determines the width
of all the tables in the worksheet. If the tables are nested, the width specified for
the outer table is used and, if necessary, the width is adjusted to accommodate
data in the nested tables. The columns and rows around the table are merged to
preserve the appearance of the nested table. When you save the workbook, only a
single table is saved per worksheet.
Secure Socket Layer (SSL) Is Not Supported in Some Excel Formats
and Versions
SSL is supported for only the Microsoft Excel 2002 format in Microsoft Excel 2002
and Microsoft Excel 2003.
Number Formats Become Currency Formats in Japanese Excel
A report uses the Number data format and you save it as Microsoft Excel output.
When you open the report in the Japanese version of Microsoft Excel, the data
format is listed as Currency rather than Number. This occurs because Japanese
Excel interprets the standard Number data format slightly differently than other
versions of Excel.
The value appears correctly in Number format. For example, if you specified five
digits as your number format, five digits still appear. In Excel, click the Custom
number format to see the exact format string being used.
Reports Show Data in Wrong Columns
A report contains a large amount of data that is presented using a large number of
nested report objects, such as tables and blocks. When the report is produced in
Microsoft Excel format, some of the data appears in the wrong columns. This
occurs because Excel has a 64K limit on how many nested cell objects can appear
in a single spreadsheet.
To solve this problem, you can redesign the report to present the data using
non-nested structures.
Appendix C. Limitations When Producing Reports in Microsoft Excel Format 213

Unable to Access Reports on Remote Servers
You cannot access a report in Microsoft Excel format on a remote server.
To resolve this problem, you must change the hostname portion of the gateway
URI from localhost to either the IP address of the computer or the computer name.
You do this using IBM Cognos Configuration.
Unsupported Excel Formatting
IBM Cognos Business Intelligence does not support some formatting.
The following formatting functions that are available in the Microsoft Excel
spreadsheet software are not supported by IBM Cognos BI:
v background images in table cells
v Excel-specific headers and footers
v text flow and justification
v floating text objects
v white space, normal, and wrap text formatting
v maximum characters
Some layouts do not show exactly in HTML and PDF due to Excel limitations.
Hyperlink Buttons Are Not Supported in Excel
The Microsoft Excel spreadsheet software does not support hyperlink buttons.
Unable to View Reports in Excel Format Sent as Email Attachments
IBM Cognos Business Intelligence can send Microsoft Excel reports in HTML and
XML format by email. However, you cannot open them directly from the email
message.
Save the Excel email attachments to your computer and view them from there.
Cell Height and Width Are Incorrect
The width and height of cells that contain data with curly brackets {} or
parentheses () may appear incorrectly.
This is because the Microsoft Excel spreadsheet software uses different word
wrapping algorithms than IBM Cognos Business Intelligence.
214 IBM Cognos Workspace Advanced Version 10.2.2: User Guide

Appendix D. Using the expression editor
An expression is any combination of operators, constants, functions, and other
components that evaluates to a single value. You build expressions to create
calculation and filter definitions. A calculation is an expression that you use to
create a new value from existing values that are contained within a data item. A
filter is an expression that you use to retrieve a specific subset of records.
Build expressions that use the following components.
Operators
Operators specify what happens to the values on either side of the operator.
Operators are similar to functions, in that they manipulate data items and return a
result.
(
Identifies the beginning of an expression.
Syntax
( expression )
)
Identifies the end of an expression.
Syntax
( expression )
*
Multiplies two numeric values.
Syntax
value1 * value2
,
Separates expression components.
Syntax
expression ( parameter1, parameter2 )
/
Divides two numeric values.
Syntax
value1 / value2
+
Adds two numeric values.
© Copyright IBM Corp. 2005, 2014 215

Syntax
value1 + value2
-
Subtracts two numeric values or negates a numeric value.
Syntax
value1 - value2
or
- value
when
Works with the case construct. You can define conditions to occur when the when
expression is true.
Syntax
case [expression] when ... end
Constants
A constant is a fixed value that you can use in an expression.
date
Inserts the current system date.
date-time
Inserts the current system date and time.
interval
Inserts a zero interval: 000 00:00:00.000.
number
Inserts the number 0, which can be replaced with a new numeric value.
string
Inserts an empty string as two single quotation marks between which you can type
a string.
time
Inserts the current system time.
time with time zone
Inserts a zero time with time zone.
timestamp with time zone
Inserts an example of a timestamp with time zone.
216 IBM Cognos Workspace Advanced Version 10.2.2: User Guide

List Summaries
This list contains predefined functions that return either a single summary value
for a group of related values or a different summary value for each instance of a
group of related values.
aggregate
Returns a calculated value using the appropriate aggregation function, based on
the aggregation type of the expression. This function appears in the Budget vs.
Actual sample report in the GO Data Warehouse (analysis) package.
Syntax
aggregate ( expression [ auto ] )
aggregate ( expression for [ all|any ] expression { , expression } )
aggregate ( expression for report )
average
Returns the average value of selected data items. Distinct is an alternative
expression that is compatible with earlier versions of the product.
Syntax
average ( [ distinct ] expression [ auto ] )
average ( [ distinct ] expression for [ all|any ] expression { , expression } )
average ( [ distinct ] expression for report )
Example
average ( Sales )
Result: Returns the average of all Sales values.
count
Returns the number of selected data items excluding null values. Distinct is an
alternative expression that is compatible with earlier versions of the product.
Syntax
count ( [ distinct ] expression [ auto ] )
count ( [ distinct ] expression for [ all|any ] expression { , expression } )
count ( [ distinct ] expression for report )
Example
count ( Sales )
Result: Returns the total number of entries under Sales.
maximum
Returns the maximum value of selected data items. Distinct is an alternative
expression that is compatible with earlier versions of the product.
Syntax
maximum ( [ distinct ] expression [ auto ] )
maximum ( [ distinct ] expression for [ all|any ] expression { , expression } )
maximum ( [ distinct ] expression for report )
Appendix D. Using the expression editor 217
Example
maximum ( Sales )
Result: Returns the maximum value out of all Sales values.
median
Returns the median value of selected data items.
Syntax
median ( expression [ auto ] )
median ( expression for [ all|any ] expression { , expression } )
median ( expression for report )
minimum
Returns the minimum value of selected data items. Distinct is an alternative
expression that is compatible with earlier versions of the product.
Syntax
minimum ( [ distinct ] expression [ auto ] )
minimum ( [ distinct ] expression for [ all|any ] expression { , expression } )
minimum ( [ distinct ] expression for report )
Example
minimum ( Sales )
Result: Returns the minimum value out of all Sales values.
standard-deviation
Returns the standard deviation of selected data items.
Syntax
standard-deviation ( expression [ auto ] )
standard-deviation ( expression for [ all|any ] expression { , expression } )
standard-deviation ( expression for report )
Example
standard-deviation ( ProductCost )
Result: Returns a value indicating the deviation between product costs and the
average product cost.
total
Returns the total value of selected data items. Distinct is an alternative expression
that is compatible with earlier versions of the product. This function is displayed
in the Budget vs. Actual sample report in the GO Data Warehouse (analysis)
package.
Syntax
total ( [ distinct ] expression [ auto ] )
total ( [ distinct ] expression for [ all|any ] expression { , expression } )
total ( [ distinct ] expression for report )
218 IBM Cognos Workspace Advanced Version 10.2.2: User Guide

Example
total ( Sales )
Result: Returns the total value of all Sales values.
variance
Returns the variance of selected data items.
Syntax
variance ( expression [ auto ] )
variance ( expression for [ all|any ] expression { , expression } )
variance ( expression for report )
Example
variance ( Product Cost )
Result: Returns a value indicating how widely product costs vary from the average
product cost.
Crosstab/Chart Summaries
This list contains predefined functions that return either a single summary value
for a set of members or a different summary value for each member of a set of
members.
aggregate
Returns a calculated value using the appropriate aggregation function based on the
aggregation type of the expression.
Syntax
aggregate ( < currentMeasure|numeric_expression >
within set set_expression )
aggregate ( < currentMeasure|numeric_expression >
within < detail|aggregate > expression )
average
Returns the average value of the selected data items.
Syntax
average ( < currentMeasure|numeric_expression >
within set set_expression )
average ( < currentMeasure|numeric_expression >
within < detail|aggregate > expression )
Example
average ( Sales )
Result: Returns the average of all Sales values.
count
Returns the number of selected data items excluding null values.
Appendix D. Using the expression editor 219
Syntax
count ( < currentMeasure|numeric_expression >
within set set_expression )
count ( < currentMeasure|numeric_expression >
within < detail|aggregate > expression )
Example
count ( Sales )
Result: Returns the total number of entries under Sales.
maximum
Returns the maximum value of selected data items.
Syntax
maximum ( < currentMeasure|numeric_expression >
within set set_expression )
maximum ( < currentMeasure|numeric_expression >
within < detail|aggregate > expression )
Example
maximum ( Sales )
Result: Returns the maximum value out of all Sales values.
median
Returns the median value of selected data items.
Syntax
median ( < currentMeasure|numeric_expression >
within set set_expression )
median ( < currentMeasure|numeric_expression >
within < detail|aggregate > expression )
minimum
Returns the minimum value of selected data items.
Syntax
minimum ( < currentMeasure|numeric_expression >
within set set_expression )
minimum ( < currentMeasure|numeric_expression >
within < detail|aggregate > expression )
Example
minimum ( Sales )
Result: Returns the minimum value out of all Sales values.
standard-deviation
Returns the standard deviation of the selected data items.
220 IBM Cognos Workspace Advanced Version 10.2.2: User Guide

Syntax
standard-deviation ( < currentMeasure|numeric_expression >
within set set_expression )
standard-deviation ( < currentMeasure|numeric_expression >
within < detail|aggregate > expression )
total
Returns the total value of the selected data items.
Syntax
total ( < currentMeasure|numeric_expression >
within set set_expression )
total ( < currentMeasure|numeric_expression >
within < detail|aggregate > expression )
variance
Returns the variance of the selected data items.
Syntax
variance ( < currentMeasure|numeric_expression >
within set set_expression )
variance ( < currentMeasure|numeric_expression >
within < detail|aggregate > expression )
Functions
Functions are pre-written formulas that simplify the process of creating
calculations. Using functions, you can quickly create formulas that may be difficult
to build yourself.
abs
Returns the absolute value of "numeric_expression". Negative values are returned
as positive values.
Syntax
abs ( numeric_expression )
Example 1
abs(15)
Result: 15
Example 2
abs ( -15 )
Result: 15
ancestor
Returns the ancestor of "member" at "level" or at "integer" number of levels above
"member". Note: The result is not guaranteed to be consistent when there is more
than one such ancestor.
Syntax
ancestor ( member, level|integer )
Appendix D. Using the expression editor 221

Example 1
ancestor ( [TrailChef Water Bag],1)
Result: Cooking Gear
Example 2
ancestor ( [TrailChef Water Bag],2)
Result: Camping Equipment
Example 3
ancestor ( [TrailChef Water Bag] , [great_outdoors_company].
[Products].[Products].[Product type] )
Result: Cooking Gear
bottomCount
Sorts a set according to the value of "numeric_expression" evaluated at each of the
members of "set_expression" and returns the bottom "index_expression" members.
Syntax
bottomCount ( set_expression , index_expression , numeric_expression )
Example
bottomCount ( [great_outdoors_company].[Products].[Products].
[Product line],2,[Revenue] )
Result: Returns the bottom two members of the set sorted by revenue.
Product line
-------
Outdoor Protection
Mountaineering Equipment
Revenue
-------
$3,171,114.92
$20,891,350.60
bottomPercent
Sorts the set specified in "set_expression" in ascending order and returns the
bottommost elements from the sorted set whose cumulative percentage of the total
is greater than or equal to "percentage".
Syntax
bottomPercent ( set_expression , percentage , numeric_expression )
Example
bottomPercent ( set ( [Camping Equipment] , [Golf Equipment] ,
[Mountaineering Equipment]),40,[2006] )
Result: For the set of Camping Equipment, Golf Equipment, and Mountaineering
Equipment, returns the members with the smallest Gross profit whose total for the
year 2006 is at least 40% of the overall total.
222 IBM Cognos Workspace Advanced Version 10.2.2: User Guide
bottomSum
Sorts the set specified in "set_expression" in ascending order and returns the
bottommost elements from the sorted set whose cumulative total is greater than or
equal to "value".
Syntax
bottomSum ( set_expression , value , numeric_expression )
Example
bottomSum ( members ( [great_outdoors_company].[Products].
[Products].[Product line] ) , 6000000 , tuple ( [2006] ,
[great_outdoors_company].[Measures].[Gross profit] ) )
Result: For the Product line members, returns the members with the smallest Gross
profit whose total for the year 2006 is at least $6,000,000.
caption
Returns the caption values of "level", "member", or "set_expression". The caption is
the string display name for an element and does not necessarily match the unique
identifier used to generate the business key or member unique name (MUN) for
the element. The caption is not necessarily unique; for example, the caption for a
month may return the month name without further year details to make the value
unique.
Syntax
caption ( level|member|set_expression )
Example 1
caption ( [TrailChef Water Bag] )
Result: TrailChef Water Bag
Example 2
caption ( [great_outdoors_company].[Products].[Products].[Product line] )
Result: Returns the caption values of the Product line set.
Camping Equipment
Mountaineering Equipment
Personal Accessories
Outdoor Protection
Golf Equipment
cast
Converts "expression" to a specified data type. Some data types allow for a length
and precision to be specified. Make sure that the target is of the appropriate type
and size. The following can be used for "datatype_specification": character, varchar,
char, numeric, decimal, integer, smallint, real, float, date, time, timestamp, time
with time zone, timestamp with time zone, and interval. When type casting to an
interval type, one of the following interval qualifiers must be specified: year,
month, or year to month for the year-to-month interval datatype; day, hour,
minute, second, day to hour, day to minute, day to second, hour to minute, hour
to second, or minute to second for the day-to-second interval datatype. Notes
®
:
When you convert a value of type timestamp to type date, the time portion of the
timestamp value is ignored. When you convert a value of type timestamp to type
Appendix D. Using the expression editor 223
time, the date portion of the timestamp is ignored. When you convert a value of
type date to type timestamp, the time components of the timestamp are set to zero.
When you convert a value of type time to type timestamp, the date component is
set to the current system date. It is invalid to convert one interval datatype to the
other (for instance because the number of days in a month is variable). Note that
you can specify the number of digits for the leading qualifier only, i.e. YEAR(4) TO
MONTH, DAY(5). Errors will be reported if the target type and size are not
compatible with the source type and size.
Syntax
cast ( expression , datatype_specification )
Example 1
cast ( ’123’ , integer )
Result: 123
Example 2
cast ( 12345 , varchar ( 10 ) )
Result: a string containing 12345
ceiling
Returns the smallest integer that is greater than or equal to "numeric_expression".
Syntax
ceiling ( numeric_expression )
Example 1
ceiling ( 4.22 )
Result: 5
Example 2
ceiling ( -1.23 )
Result: -1
children
Returns the set of children of a specified member.
Syntax
children ( member )
Example
children ( [Camping Equipment] )
Result: Returns the set of children for Camping Equipment.
Cooking Gear
Tents
Sleeping Bags
Packs
Lanterns
224 IBM Cognos Workspace Advanced Version 10.2.2: User Guide
closingPeriod
Returns the last sibling member among the descendants of a member at "level".
This function is typically used with a time dimension.
Syntax
closingPeriod ( level [ , member ] )
Example 1
closingPeriod ( [great_outdoors_company].[Years].[Years].[Month] )
Result: 2006/Dec
Example 2
closingPeriod ( [great_outdoors_company].[Years].[Years].[Year] )
Result: 2006
Example 3
closingPeriod ( [great_outdoors_company].[Years].[Years].[Month] , [2006 Q 4] )
Result: 2006/Dec
completeTuple
Identifies a cell location (intersection) based on the specified members, each of
which must be from a different dimension. However, completeTuple () implicitly
includes the default member from all dimensions not otherwise specified in the
arguments, rather than the current member. CompleteTuple will use the default
measure rather than the currentMeasure in the query if the measure is not defined
in the completetuple function. This function appears in the Planned Headcount
sample report in the GO Data Warehouse (analysis) package.
Syntax
completeTuple ( member { , member } )
Example 1
completeTuple ( [Mountaineering Equipment] , [Fax] )
Result: The completeTuple does not pick up the currentMember by default as the
tuple function does. The values in the first column are identical across each year
because the default member of the Years dimension, the root member, is used
rather than the current member. Likewise, the first column displays Revenue rather
than Quantity Sold because the Revenue measure is the default from the Measures
dimension. CompleteTuple will use the default measure rather than the
currentMeasure in the query if the measure is not defined in the completetuple
function.
Appendix D. Using the expression editor 225

Quantity Sold
---------------
2004
2005
2006
Mountaineering Sales by Fax
--------------
$1,220,329.38
$1,220,329.38
$1,220,329.38
Example 2
completeTuple ( [Mountaineering Equipment] , [Fax] ,
[Quantity sold] , currentMember ( [great_outdoors_company].
[Years].[Years] ) )
Result: The completeTuple function uses the currentMember of the Years
dimension and the Quantity sold measure.
Quantity Sold
---------------
2004
2005
2006
Mountaineering Sales by Fax
--------------
0
8,746
7,860
cousin
Returns the child member of "member2" with the same relative position as
"member1" to its parent. This function appears in the Revenue by GO Subsidiary
2005 sample report in the GO Data Warehouse (analysis) package.
Syntax
cousin ( member1 , member2 )
Example 1
cousin ( [Irons] , [Camping Equipment] )
Result: Cooking Gear
Example 2
cousin ( [Putters] , [Camping Equipment] )
Result: Sleeping Bags
current_date
Returns a date value representing the current date of the computer that the
database software runs on.
Syntax
current_date
226 IBM Cognos Workspace Advanced Version 10.2.2: User Guide
Example
current_date
Result: 2003-03-04
currentMember
Returns the current member of the hierarchy during an iteration. If "hierarchy" is
not present in the context in which the expression is being evaluated, its default
member is assumed. This function appears in the Rolling and Moving Averages
interactive sample report.
Syntax
currentMember ( hierarchy )
current_timestamp
Returns a datetime with time zone value, representing the current time of the
computer that runs the database software if the database supports this function.
Otherwise, it represents the current time of the computer that runs IBM Cognos BI
software.
Syntax
current_timestamp
Example
current_timestamp
Result: 2003-03-03 16:40:15.535000+05:00
defaultMember
Returns the default member of "hierarchy".
Syntax
defaultMember ( hierarchy )
Example 1
defaultMember ( [great_outdoors_company].[Products].[Products] )
Result: Products
Example 2
defaultMember ( [great_outdoors_company].[Years].[Years] )
Result: Year
Example 3
defaultMember ( hierarchy ( [great_outdoors_company].[Measures].[Quantity sold] ) )
Result: Revenue
descendants
Returns the set of descendants of "member" or "set_expression" at "level" (qualified
name) or "distance" (integer 0..n) from the root. Multiple options may be specified
(separated by a space) to determine which members are returned. self: Only the
Appendix D. Using the expression editor 227
members at the specified level are included in the final set (this is the default
behaviour in the absence of any options). before: If there are any intermediate
levels between the member's level and the one specified, members from those
levels are included. If the level specified is the same as the member upon which
the function is applied, the member is included in the final set. beforewithmember:
If there are any intermediate levels between the member's level and the one
specified, members from those levels are included. The member upon which the
function is applied is also included in the final set. after: If other levels exist after
the specified level, members from those levels are included in the final set. This
function appears in the Sales Commissions for Central Europe sample report in the
GO Data Warehouse (analysis) package.
Syntax
descendants ( member|set_expression , level|distance
[ , { self|before|beforewithmember|after}])
Example 1
descendants ( [great_outdoors_company].[Products].[Products]
.[Products] , [great_outdoors_company].[Products].[Products].
[Product type] )
Result: Returns the set of descendants of the Products set at the Product type level.
Note: [great_outdoors_company].[Products].[Products].[Products] is the root
member of the Products hierarchy.
Cooking Gear
Sleeping Bags
Packs
Tents
...
Eyewear
Knives
Watches
Example 2
descendants ( [great_outdoors_company].[Products].[Products].[Products],1)
Result: Returns the set of descendants of the Products set at the first level.
Camping Equipment
Golf Equipment
Mountaineering Equipment
Outdoor Protection
Personal Accessories
Example 3
descendants ( [great_outdoors_company].[Products].
[Products].[Products],3,before )
Result: Returns the descendants of the Products set before the third level.
Camping Equipment
Cooking Gear
Sleeping Bags
Packs
Tents
...
Eyewear
Knives
Watches
228 IBM Cognos Workspace Advanced Version 10.2.2: User Guide
Example 4
descendants ( [great_outdoors_company].[Products].
[Products].[Products],2,self before )
Result: Returns the set of descendants of the Products set before and including the
second level.
Camping Equipment
Cooking Gear
Sleeping Bags
Packs
Tents
...
Eyewear
Knives
Watches
except
Returns the members of "set_expression1" that are not also in "set_expression2".
Duplicates are retained only if the optional keyword all is supplied as the third
argument.
Syntax
except ( set_expression1 , set_expression2[,all])
Example
except ( set ( [Camping Equipment] , [Mountaineering Equipment] ) ,
set ( [Camping Equipment] , [Golf Equipment] ) )
Result: Mountaineering Equipment
extract
Returns an integer representing the value of datepart (year, month, day, hour,
minute, second) in "datetime_expression".
Syntax
extract ( datepart , datetime_expression )
Example 1
extract ( year , 2003-03-03 16:40:15.535 )
Result: 2003
Example 2
extract ( hour , 2003-03-03 16:40:15.535 )
Result: 16
filter
Returns the set resulting from filtering a specified set based on the Boolean
condition. Each member is included in the result if and only if the corresponding
value of "Boolean_expression" is true.
Syntax
filter ( set_expression , Boolean_expression )
Appendix D. Using the expression editor 229
Example
filter ( [Product line] , [Gross margin] > .30 )
Result: Mountaineering Equipment
firstChild
Returns the first child of "member".
Syntax
firstChild ( member )
Example 1
firstChild ( [By Product Lines] )
Result: Camping Equipment
Example 2
firstChild ( [Camping Equipment] )
Result: Cooking Gear
firstSibling
Returns the first child of the parent of "member".
Syntax
firstSibling ( member )
Example 1
firstSibling ( [Outdoor Protection] )
Result: Camping Equipment
Example 2
firstSibling ( [Camping Equipment] )
Result: Camping Equipment
floor
Returns the largest integer that is less than or equal to "numeric_expression".
Syntax
floor ( numeric_expression )
Example 1
floor ( 3.22 )
Result: 3
Example 2
floor ( -1.23 )
Result: -2
230 IBM Cognos Workspace Advanced Version 10.2.2: User Guide
head
Returns the first "index_expression" elements of "set_expression". The default for
"index_expression" is 1.
Syntax
head ( set_expression [ , index_expression ] )
Example 1
head ( members ( [great_outdoors_company].[Products].[Products].
[Product line] ) )
Result: Camping Equipment
Example 2
head ( members ( [great_outdoors_company].[Products].[Products].
[Product line]),2)
Result: Returns the top two members of the Product line set.
Camping Equipment
Mountaineering Equipment
hierarchize
Orders the members of "set_expression" in a hierarchy. Members in a level are
sorted in their natural order. This is the default ordering of the members along a
dimension when no other sort conditions are specified.
Syntax
hierarchize ( set_expression )
Example
hierarchize ( set ( [Golf Equipment] , [Mountaineering Equipment] ,
[Camping Equipment] ) )
Result: Returns Camping Equipment, Golf Equipment, Mountaineering Equipment.
hierarchy
Returns the hierarchy that contains "level", "member", or "set_expression".
Syntax
hierarchy ( level|member|set_expression )
Example 1
hierarchy ( [Cooking Gear] )
Result: Returns every member in the hierarchy that contains Cooking Gear.
Products
Camping Equipment
Cooking Gear
TrailChef Water Bag
TrailChef Canteen
...
Mountain Man Extreme
Mountain Man Deluxe
Appendix D. Using the expression editor 231
Example 2
hierarchy ( [great_outdoors_company].[Products].[Products].[Product line] )
Result: Returns every member in the hierarchy that contains the Product line.
Products
Camping Equipment
Cooking Gear
TrailChef Water Bag
TrailChef Canteen
...
Mountain Man Extreme
Mountain Man Deluxe
item
Returns a member from the "index" location within "set_expression". The index
into the set is zero based.
Syntax
item ( set_expression , index )
Example
item ( children ( [Camping Equipment]),2)
Result: Sleeping Bags
intersect
Returns the intersection of "set_expression1" and "set_expression2". The result
retains duplicates only when the optional keyword "all" is supplied as the third
argument.
Syntax
intersect ( set_expression1 , set_expression2[,all])
Example
intersect ( set ( [Camping Equipment] , [Mountaineering Equipment] )
, set ( [Camping Equipment] , [Outdoor Protection],),all)
Result: Camping Equipment
lag
Returns the sibling member that is "index_expression" number of positions prior to
"member".
Syntax
lag ( member , index_expression )
Example 1
lag ( [Tents],1)
Result: Cooking Gear
232 IBM Cognos Workspace Advanced Version 10.2.2: User Guide
Example 2
lag ( [Tents] , -2 )
Result: Packs
lastChild
Returns the last child of a specified member.
Syntax
lastChild ( member )
Example 1
lastChild ( Cooking Gear )
Result: TrailChef Utensils
Example 2
lastChild ( [By Product Line] )
Result: Golf Equipment
lastPeriods
Returns the set of members from the same level that ends with "member". The
number of members returned is the absolute value of "integer_expression". If
"integer_expression" is negative, members following and including the specified
member are returned. Typically used with a time dimension. This function appears
in the Rolling and Moving Averages interactive sample report.
Syntax
lastPeriods ( integer_expression , member )
Example 1
lastPeriods(2,[2006 Q 4] )
Result: Returns the last two members from the level that ends with 2006 Q 4.
2006 Q 3
2006 Q 4
Example 2
lastPeriods ( -3 , [2006 Q 4] )
Result: Returns the last three members from the level that starts with 2006 Q 4.
2006 Q 4
2007 Q 1
2007 Q 2
lastSibling
Returns the last child of the parent of a specified member.
Syntax
lastSibling ( member )
Appendix D. Using the expression editor 233
Example
lastSibling ( [Camping Equipment] )
Result: Golf Equipment
lead
Returns the sibling member that is "index_expression" number of positions after
"member". If "index_expression" is negative, returns the sibling member that is
"index_expression" number of positions before "member".
Syntax
lead ( member , index_expression )
Example 1
lead ( [Outdoor Protection],1)
Result: Personal Accessories
Example 2
lead ( [Outdoor Protection] , -2 )
Result: Golf Equipment
lower
Returns "string_expression" with all uppercase characters shifted to lowercase.
Syntax
lower ( string_expression )
Example
lower ( ’ABCDEF’ )
Result: abcdef
member
Defines a member based on "value_expression" in "hierarchy". "String1" identifies
the member created by this function. It must be unique in the query and different
from any other member in the same hierarchy. "String2" is the caption of the
member; if it is absent, the caption is empty. To ensure predictable results, you
should supply the "hierarchy". Note: All calculations used as grouping items whose
sibling items are other calculations or member sets should be explicitly assigned to
a hierarchy using this function. The results are not predictable otherwise. The only
exception is where the calculation involves only members of the same hierarchy as
the siblings. In this case, the calculation is assumed to belong to that hierarchy.
Syntax
member ( value_expression [ , string1 [ , string2 [ , hierarchy]]])
Example
member ( total ( currentMeasure within set filter
( [great_outdoors_company].[Products].[Products].[Product name] ,
caption ( [great_outdoors_company].[Products].[Products].[Product name] )
starts with ’B’)),’BProducts’ , ’B Products’ ,
[great_outdoors_company].[Products].[Products] )
234 IBM Cognos Workspace Advanced Version 10.2.2: User Guide
Result: Returns the quantity sold and revenue for all products that start with the
letter B.
members
Returns the set of members in "hierarchy" or "level". In the case of a hierarchy, the
order of the members in the result is not guaranteed. If a predictable order is
required, an explicit ordering function (such as hierarchize) must be used.
Syntax
members ( hierarchy|level )
Example 1
members ( [great_outdoors_company].[Years].[Years] )
Result: Returns the members in Years.
Example 2
members ( [great_outdoors_company].[Products].[Products].[Product line] )
Result: Returns the members in Product line.
mod
Returns the remainder (modulus) of "integer_expression1" divided by
"integer_expression2". "Integer_expression2" must not be zero or an exception
condition is raised.
Syntax
mod ( integer_expression1, integer_expression2 )
Example
mod(20,3)
Result: 2
nextMember
Returns the next member in the "member" level.
Syntax
nextMember ( member )
Example
nextMember ( [Outdoor Protection] )
Result: Golf Equipment
nullif
Returns null if "expression1" equals "expression2", otherwise returns "expression1".
Syntax
nullif ( expression1, expression2 )
Appendix D. Using the expression editor 235

openingPeriod
Returns the first sibling member among the descendants of a member at "level".
This function is typically used with a time dimension.
Syntax
openingPeriod ( level [ , member ] )
Example 1
openingPeriod ( [great_outdoors_company].[Years].[Years].[Month] )
Result: 2004/Jan
Example 2
openingPeriod ( [great_outdoors_company].[Years].[Years].[Year] )
Result: 2004
Example 3
openingPeriod ( [great_outdoors_company].[Years].[Years].[Month] , [2006 Q 4] )
Result: 2006/Oct
order
Arranges the members of "set_expression" according to their "value_expression"
and the third parameter. ASC and DESC arrange members in ascending or
descending order, respectively, according to their position in the set hierarchy. Then
the children of each member are arranged according to "value_expression". BASC
and BDESC arrange members in the set without regard to the hierarchy. In the
absence of an explicit specification, ASC is the default.
Syntax
order ( set_expression , value_expression [ , ASC|DESC|BASC|BDESC ] )
Example 1
order ( members ( [Great Outdoors Company].[Product].[Product].[Product type] ) ,
[Quantity sold] , BASC )
Result: Returns the quantity sold for each product type in no particular order.
Product Line
-------------
Woods
Irons
Safety
...
Sunscreen
Insect Repellents
Lanterns
Quantity
-------------
13,924
14,244
22,332
...
215,432
270,074
345,096
236 IBM Cognos Workspace Advanced Version 10.2.2: User Guide

Example 2
order ( members ( [Great Outdoors Company].[Product].[Product].[Product type] ) ,
[Quantity sold] , ASC )
Result: Returns the quantity sold for each product type in ascending order.
Product Line
-------------
Woods
Irons
Putters
...
Tents
Cooking Gear
Lanterns
Quantity
-------------
13,924
14,244
23,244
...
130,664
198,676
345,096
parallelPeriod
Returns a member from a prior period in the same relative position as "member".
This function is similar to the cousin function, but is more closely related to time
series. It takes the ancestor of "member" at "level" (called "ancestor") and the
sibling of "ancestor" that lags by "integer_expression" positions, and returns the
parallel period of "member" among the descendants of that sibling. When
unspecified, "integer_expression" defaults to 1 and "member" defaults to the
current member.
Syntax
parallelPeriod ( level [ , integer_expression [ , member]])
Example 1
parallelPeriod ( [great_outdoors_company].[Years].[Years].
[Quarter] , -1 , [2006/Aug] )
Result: 2006/Nov
Example 2
parallelPeriod ( [great_outdoors_company].[Years].[Years].
[Quarter],1,[2006/Aug] )
Result: 2006/May
Example 3
parallelPeriod ( [great_outdoors_company].[Years].[Years].
[Year],2,[2006/Aug] )
Result: 2004/Aug
Appendix D. Using the expression editor 237
parent
Returns the member that is the parent of "member" or "measure".
Syntax
parent ( member|measure )
Example
parent ( [Cooking Gear] )
Result: Camping Equipment
periodsToDate
Returns a set of sibling members from the same level as "member", as constrained
by "level". It locates the ancestor of "member" at "level" and returns that ancestor's
descendants at the same level as "member" (up to and including "member").
Typically used with a time dimension. This function is displayed in the Rolling
and Moving Averages interactive sample report.
Syntax
periodsToDate ( level , member )
Example
periodsToDate ( [great_outdoors_company].[Years].
[Years].[Year] , [2004/Mar] )
Result: Returns values for [2004/Jan], [2004/Feb], [2004/Mar]
power
Returns "numeric_expression1" raised to the power "numeric_expression2". If
"numeric_expression1" is negative, then "numeric_expression2" must result in an
integer value.
Syntax
power ( numeric_expression1 , numeric_expression2 )
Example
power(3,2)
Result: 9
prevMember
Returns the member that immediately precedes "member" in the same level. This
function is displayed in the Sales Growth Year Over Year sample report in the GO
Data Warehouse (analysis) package.
Syntax
prevMember ( member )
Example 1
prevMember ( [Outdoor Protection] )
Result: Personal Accessories
238 IBM Cognos Workspace Advanced Version 10.2.2: User Guide
Example 2
prevMember ( [2005] )
Result: 2004
rootMember
Returns the root member of a single-root hierarchy. This function is displayed in
the Promotion Success sample report in the GO Data Warehouse (analysis)
package.
Syntax
rootMember ( hierarchy )
rootMembers
Returns the root members of a hierarchy.
Syntax
rootMembers ( hierarchy )
Example
rootMembers ( [great_outdoors_company].[Years].[Years] )
Result: By Time
_round
Returns "numeric_expression" rounded to "integer_expression" places to the right
of the decimal point. Notes: "integer_expression" must be a non-negative integer.
Rounding takes place before data formatting is applied.
Syntax
_round ( numeric_expression , integer_expression )
Example
_round ( 1220.42369, 2 )
Result: 1220.42
set
Returns the list of members defined in the expression. The members must belong
to the same hierarchy.
Syntax
set ( member { , member } )
Example
set ( [Golf Equipment] , [Irons] , [TrailChef Cup] )
Result: Returns Golf Equipment, Irons, and TrailChef Cup.
siblings
Returns the children of the parent of the specified member.
Appendix D. Using the expression editor 239
Syntax
siblings ( member )
Example
siblings ( [Golf Equipment] )
Result: Returns the siblings of Golf Equipment.
Camping Equipment
Golf Equipment
Mountaineering Equipment
Outdoor Protection
Personal Accessories
sqrt
Returns the square root of "numeric_expression". "Numeric_expression" must be
non-negative.
Syntax
sqrt ( numeric_expression )
Example
sqrt(9)
Result: 3
subset
Returns a subset of members in "set_expression" starting at "index_expression1"
from the beginning. If the count "index_expression2" is specified, that many
members are returned (if available). Otherwise, all remaining members are
returned.
Syntax
subset ( set_expression, index_expression1 [ , index_expression2 ] )
Example 1
subset ( members ( [great_outdoors_company].[Products]
.[Products].[Product line]),2)
Result: Returns the members of the Product line set starting at the second member.
Mountaineering Equipment
Outdoor Protection
Personal Accessories
Example 2
subset ( members ( [great_outdoors_company].[Products].[Products]
.[Product line]),2,2)
Result: Returns two members of the Product line set starting at the second
member.
Mountaineering Equipment
Outdoor Protection
240 IBM Cognos Workspace Advanced Version 10.2.2: User Guide
substring
Returns the substring of "string_expression" that starts at position
"integer_expression1" for "integer_expression2" characters or to the end of
"string_expression" if "integer_expression2" is omitted. The first character in
"string_expression" is at position 1.
Syntax
substring ( string_expression , integer_expression1 [ , integer_expression2 ] )
Example
substring ( ’abcdefg’,3,2)
Result: cd
tail
Returns the last "index_expression" elements of "set expression". The default for
"index_expression" is 1.
Syntax
tail ( set_expression [ , index_expression ] )
Example 1
tail (members ( [great_outdoors_company].[Products].[Products]
.[Product line] ) )
Result: Returns the last member of the Product line set.
Personal Accessories
Example 2
tail ( members ( [great_outdoors_company].[Products].[Products]
.[Product line]),2)
Result: Returns the last two members of the Product line set.
Outdoor Protection
Personal Accessories
topCount
Sorts a set according to the values of "numeric_expression" evaluated at each of the
members of "set_expression" and returns the top "index_expression" members.
Syntax
topCount ( set_expression , index_expression , numeric_expression )
Example
topCount ( [great_outdoors_company].[Products].
[Products].[Product line],2,[Revenue] )
Result: Returns the top two revenues for the Product line set.
Appendix D. Using the expression editor 241

Product line
-------
Camping Equipment
Personal Accessories
Revenue
-------
$89,713,990.92
$31,894,465.86
topPercent
Sorts the set specified in "set_expression" in descending order and returns the
topmost elements from the sorted set whose cumulative percentage of the total is
greater than or equal to "percentage".
Syntax
topPercent ( set_expression , percentage , numeric_expression )
Example
topPercent ( set ( [Camping Equipment] , [Golf Equipment] ,
[Mountaineering Equipment]),40,[2006] )
Result: For the set of Camping Equipment, Golf Equipment, and Mountaineering
Equipment, returns the members with the largest Gross profit whose total for the
year 2006 is at least 40% of the overall total.
topSum
Sorts the set specified in "set_expression" in descending order and returns the
topmost elements from the sorted set whose cumulative total is greater than or
equal to "value".
Syntax
topSum ( set_expression , value , numeric_expression )
Example
topSum ( children ( [Products] ) , 16000000 , tuple ( [2006] ,
[great_outdoors_company].[Measures].[Gross profit] ) )
Result: For the Products members, returns the members with the largest Gross
profit whose total for the year 2006 is at least $16,000,000.
trim
Returns "string_expression" trimmed of leading and trailing blanks or trimmed of a
certain character specified in "match_character_expression". "Both" is implicit when
the first argument is not stated and blank is implicit when the second argument is
not stated.
Syntax
trim([[trailing|leading|both ] [ match_character_expression ]
, ] string_expression )
Example 1
trim ( trailing ’A’ , ’ABCDEFA’ )
Result: ABCDEF
242 IBM Cognos Workspace Advanced Version 10.2.2: User Guide
Example 2
trim ( both , ’ ABCDEF ’ )
Result: ABCDEF
tuple
Identifies a cell location (intersection) based on the specified members, each of
which must be from a different dimension. This function implicitly includes the
current member from all dimensions that are not otherwise specified in the
arguments. The current member of any dimension not specified in the evaluating
context is assumed to be the default member of that dimension. The value of this
cell can be obtained with the "value" function.
Syntax
tuple ( member { , member } )
Example
tuple ( [Mountaineering Equipment] , [Fax] )
Result: Returns the Mountaineering Equipment sales by fax.
union
Returns data for "set_expression1" and "set_expression2". The result retains
duplicates only when the optional keyword "all" is supplied as the third argument.
Syntax
union ( set_expression1 , set_expression2[,all])
Example 1
union ( set ( [Camping Equipment] , [Golf Equipment]),set
( [Golf Equipment] , [Mountaineering Equipment] ) )
Result: Returns data for both sets as one new set, showing the Golf Equipment
column only once.
Example 2
union ( set ( [Camping Equipment] , [Golf Equipment]),set
( [Golf Equipment] , [Mountaineering Equipment] ) , all )
Result: Returns data for both sets as one new set, showing the Golf Equipment
column twice.
unique
Removes all duplicates from "set_expression". The remaining members retain their
original order.
Syntax
unique ( set_expression )
upper
Returns "string_expression" with all lowercase characters converted to uppercase.
Appendix D. Using the expression editor 243
Syntax
upper ( string_expression )
Example
upper ( ’abcdef’ )
Result: ABCDEF
value
Returns the value of the cell identified by "tuple". Note that the default member of
the Measures dimension is the Default Measure.
Syntax
value ( tuple )
Example 1
value ( tuple ( [great_outdoors_company].[Years].[Years].[Year] ->:[PC]
.[Years (Root)].[20040101-20041231] , [great_outdoors_company]
.[Measures].[Revenue] ) )
Result: $34,750,563.50
Example 2
value ( tuple ( [2004] , [Camping Equipment] , [Revenue] ) )
Result: $20,471,328.88
244 IBM Cognos Workspace Advanced Version 10.2.2: User Guide

Notices
This information was developed for products and services offered worldwide.
This material may be available from IBM in other languages. However, you may be
required to own a copy of the product or product version in that language in order
to access it.
IBM may not offer the products, services, or features discussed in this document in
other countries. Consult your local IBM representative for information on the
products and services currently available in your area. Any reference to an IBM
product, program, or service is not intended to state or imply that only that IBM
product, program, or service may be used. Any functionally equivalent product,
program, or service that does not infringe any IBM intellectual property right may
be used instead. However, it is the user's responsibility to evaluate and verify the
operation of any non-IBM product, program, or service. This document may
describe products, services, or features that are not included in the Program or
license entitlement that you have purchased.
IBM may have patents or pending patent applications covering subject matter
described in this document. The furnishing of this document does not grant you
any license to these patents. You can send license inquiries, in writing, to:
IBM Director of Licensing
IBM Corporation
North Castle Drive
Armonk, NY 10504-1785
U.S.A.
For license inquiries regarding double-byte (DBCS) information, contact the IBM
Intellectual Property Department in your country or send inquiries, in writing, to:
Intellectual Property Licensing
Legal and Intellectual Property Law
IBM Japan Ltd.
19-21, Nihonbashi-Hakozakicho, Chuo-ku
Tokyo 103-8510, Japan
The following paragraph does not apply to the United Kingdom or any other
country where such provisions are inconsistent with local law: INTERNATIONAL
BUSINESS MACHINES CORPORATION PROVIDES THIS PUBLICATION "AS IS"
WITHOUT WARRANTY OF ANY KIND, EITHER EXPRESS OR IMPLIED,
INCLUDING, BUT NOT LIMITED TO, THE IMPLIED WARRANTIES OF
NON-INFRINGEMENT, MERCHANTABILITY OR FITNESS FOR A PARTICULAR
PURPOSE. Some states do not allow disclaimer of express or implied warranties in
certain transactions, therefore, this statement may not apply to you.
This information could include technical inaccuracies or typographical errors.
Changes are periodically made to the information herein; these changes will be
incorporated in new editions of the publication. IBM may make improvements
and/or changes in the product(s) and/or the program(s) described in this
publication at any time without notice.
© Copyright IBM Corp. 2005, 2014 245
Any references in this information to non-IBM Web sites are provided for
convenience only and do not in any manner serve as an endorsement of those Web
sites. The materials at those Web sites are not part of the materials for this IBM
product and use of those Web sites is at your own risk.
IBM may use or distribute any of the information you supply in any way it
believes appropriate without incurring any obligation to you.
Licensees of this program who wish to have information about it for the purpose
of enabling: (i) the exchange of information between independently created
programs and other programs (including this one) and (ii) the mutual use of the
information which has been exchanged, should contact:
IBM Software Group
Attention: Licensing
3755 Riverside Dr.
Ottawa, ON
K1V 1B7
Canada
Such information may be available, subject to appropriate terms and conditions,
including in some cases, payment of a fee.
The licensed program described in this document and all licensed material
available for it are provided by IBM under terms of the IBM Customer Agreement,
IBM International Program License Agreement or any equivalent agreement
between us.
Any performance data contained herein was determined in a controlled
environment. Therefore, the results obtained in other operating environments may
vary significantly. Some measurements may have been made on development-level
systems and there is no guarantee that these measurements will be the same on
generally available systems. Furthermore, some measurements may have been
estimated through extrapolation. Actual results may vary. Users of this document
should verify the applicable data for their specific environment.
Information concerning non-IBM products was obtained from the suppliers of
those products, their published announcements or other publicly available sources.
IBM has not tested those products and cannot confirm the accuracy of
performance, compatibility or any other claims related to non-IBM products.
Questions on the capabilities of non-IBM products should be addressed to the
suppliers of those products.
All statements regarding IBM's future direction or intent are subject to change or
withdrawal without notice, and represent goals and objectives only.
This information contains examples of data and reports used in daily business
operations. To illustrate them as completely as possible, the examples include the
names of individuals, companies, brands, and products. All of these names are
fictitious and any similarity to the names and addresses used by an actual business
enterprise is entirely coincidental.
If you are viewing this information softcopy, the photographs and color
illustrations may not appear.
246 IBM Cognos Workspace Advanced Version 10.2.2: User Guide

Depending upon the configurations deployed, this Software Offering may use
session and persistent cookies that collect each user's
v name
v user name
v password
for purposes of
v session management
v authentication
v enhanced user usability
v single sign-on configuration
v usage tracking or functional purposes other than session management,
authentication, enhanced user usability and single sign-on configuration
These cookies cannot be disabled.
If the configurations deployed for this Software Offering provide you as customer
the ability to collect personally identifiable information from end users via cookies
and other technologies, you should seek your own legal advice about any laws
applicable to such data collection, including any requirements for notice and
consent.
For more information about the use of various technologies, including cookies, for
these purposes, see IBM's Privacy Policy at http://www.ibm.com/privacy and
IBM's Online Privacy Statement at http://www.ibm.com/privacy/details in the
section entitled "Cookies, Web Beacons and Other Technologies" and the "IBM
Software Products and Software-as-a-Service Privacy Statement" at
http://www.ibm.com/software/info/product-privacy.
Trademarks
IBM, the IBM logo and ibm.com are trademarks or registered trademarks of
International Business Machines Corp., registered in many jurisdictions worldwide.
Other product and service names might be trademarks of IBM or other companies.
A current list of IBM trademarks is available on the Web at “ Copyright and
trademark information ” at www.ibm.com/legal/copytrade.shtml.
The following terms are trademarks or registered trademarks of other companies:
v Adobe, the Adobe logo, PostScript, and the PostScript logo are either registered
trademarks or trademarks of Adobe Systems Incorporated in the United States,
and/or other countries.
v Microsoft, Windows, Windows NT, and the Windows logo are trademarks of
Microsoft Corporation in the United States, other countries, or both.
v Java and all Java-based trademarks and logos are trademarks or registered
trademarks of Oracle and/or its affiliates.
Microsoft product screen shot(s) used with permission from Microsoft.
Notices 247
248 IBM Cognos Workspace Advanced Version 10.2.2: User Guide

Glossary
This glossary provides terms and definitions for
IBM Cognos Business Intelligence software and
products.
The following cross-references are used in this
glossary:
v See refers you from a nonpreferred term to the
preferred term or from an abbreviation to the
spelled-out form.
v See also refers you to a related or contrasting
term.
For other terms and definitions, see the IBM
Terminology website (opens in new window).
“A” “B” “C” on page 250 “D” on page 251 “E” on
page 252 “F” on page 252 “G” on page 252 “H”
on page 252 “I” on page 252 “J” on page 252 “L”
on page 253 “M” on page 253 “N” on page 254
“O” on page 254 “P” on page 254 “Q” on page
255 “R” on page 255 “S” on page 255 “T” on page
256 “U” on page 256 “V” on page 257 “W” on
page 257
A
access permission
A privilege that permits the access or use
of an object.
accountability scorecard
A scorecard that Metric Studio
automatically builds for each user which
contains the metrics and projects they
own.
active report
A report output type that provides a
highly interactive and easy-to-use
managed report that users can consume
offline. Active reports are built for
business users, allowing them to explore
their data and derive additional insight.
agent A process that performs an action on
behalf of a user or other program without
user intervention or on a regular
schedule, and reports the results back to
the user or program.
alias An alternative name used instead of a
primary name.
AnalyticsZone
An IBM online community for business
analytics. Users can download products
and extensible visualizations, view
publications and training materials, learn
about upcoming IBM events, and perform
other functions.
anonymous access
A type of access that allows users and
servers to access a server without first
authenticating with it.
application tier component
For installation, the set of processors that
access the query databases to gather
information and then render the results as
PDF and HTML reports and metrics.
Application tier components also pass
requests to Content Manager and render
the results that Content Manager retrieves
from the content store.
attribute
In BI Modeling, a characteristic of an
entity which is descriptive rather than a
unique identifier or an aggregative
measure.
authentication (AuthN)
The process of validating the identity of a
user or server.
authentication provider
The communication mechanism to an
external authentication source.
Functionalities, such as user
authentication, group membership, and
namespace searches, are made available
through authentication providers.
AuthN
See authentication.
B
burst To create several report results by running
a single report once. For example, the
user can create a report that shows sales
for each employee, and run it once,
sending different results to regional
managers by bursting on region.
© Copyright IBM Corp. 2005, 2014 249

burst key
The dimension or level of a query in the
report specification that is used to create,
or burst, a set of report results.
C
CA See certificate authority.
calculated member
A member of a dimension whose measure
values are not stored but are calculated at
run time using an expression.
canvas
An area within a dashboard or workspace
that users interact with to create, view,
and manipulate content and data.
capability
A group of functions and features that
can be hidden or revealed to simplify the
user interface. Capabilities can be enabled
or disabled by changing preference
settings, or they can be controlled through
an administration interface.
cardinality
1. For relational data sources, a
numerical indication of the
relationship between two query
subjects, query items, or other model
objects.
2. For OLAP data sources, the number of
members in a hierarchy. The
cardinality property for a hierarchy is
used to assign solve orders to
expressions.
cascading prompt
A prompt that uses values from a
previous prompt to filter the values in the
current prompt or pick list.
certificate
In computer security, a digital document
that binds a public key to the identity of
the certificate owner, thereby enabling the
certificate owner to be authenticated. A
certificate is issued by a certificate
authority and is digitally signed by that
authority. See also certificate authority.
certificate authority (CA)
A component that issues certificates to
each computer on which components are
installed.
CGI See Common Gateway Interface.
cipher suite
The combination of authentication, key
exchange algorithm, and the Secure
Sockets Layer (SSL) cipher specification
used for the secure exchange of data.
class style
A combination of formatting
characteristics, such as font, font size, and
border, that the user names and stores as
a set.
CM See Content Manager.
Common Gateway Interface (CGI)
An Internet standard for defining scripts
that pass information from a web server
to an application program, through an
HTTP request, and vice versa.
compatible query mode (CQM)
The query processing mode that is
consistent with version 8.4.1 of Cognos
Business Intelligence, and that is
maintained for upgrade success. See also
dynamic query mode.
condition
An expression that can be evaluated as
true, false, or unknown. It can be
expressed in natural language text, in
mathematically formal notation, or in a
machine-readable language.
constraint
1. A security specification that denies
one or more users the ability to access
a model component or to perform a
modeling or authoring task.
2. A restriction on the possible values
that users can enter in a field.
contact
A named email address to which reports
and agent e-mails can be sent. Contacts
are never authenticated.
content locale
A code that is used to set the language or
dialect used for browsers and report text,
and the regional preferences, such as
formats for time, date, money, money
expressions, and time of day.
Content Manager (CM)
The service that retrieves information
from the content store, and saves
information to the content store.
250 IBM Cognos Workspace Advanced Version 10.2.2: User Guide

content store
A repository that is used to hold
specifications of reports, models, and data
sources.
CQM See compatible query mode.
credential
A set of information that grants a user or
process certain access rights.
cube A multidimensional representation of data
needed for online analytical processing,
multidimensional reporting, or
multidimensional planning applications.
custom set
In Analysis Studio, a named object which
can include filter rules, calculations, and
sort rules. Custom sets can define a set of
members that is different from any set
originally defined in the cube model. See
also predefined set, set.
D
dashboard
A web page that can contain one or more
widgets that graphically represent
business data.
data source
The source of data itself, such as a
database or XML file, and the connection
information necessary for accessing the
data.
data source connection
The named information that defines the
type of data source, its physical location,
and any sign-on requirements. A data
source can have more than one
connection.
data tree
See metadata tree.
deployment
The process of moving an application
(such as a report or model) to a different
instance. For example, reports are often
created in a test environment and then
deployed to production. When an
application is deployed, it is exported,
transferred, and imported.
deployment archive
A file used for deployment. A deployment
archive contains the data from the content
store that is being moved.
deployment specification
A definition of what objects to move
(deploy) between a source and target
environment, the deployment preferences,
and the archive name. Deployment
specifications are used for import and
export.
derived index
A calculated metric that provides a status
and a score based on other metrics.
details-based set
A set based on an item and its immediate
details. See also set.
dimension
A broad grouping of descriptive data
about a major aspect of a business, such
as products, dates, or locations. Each
dimension includes different levels of
members in one or more hierarchies and
an optional set of calculated members or
special categories.
dimensional data source
A data source containing data modeled
using OLAP multidimensional concepts,
including dimensions, hierarchies, and
measures.
dimensional modeled relational data (DMR)
Metadata that has been modeled to
present relational data (tables, columns,
joins) as dimensions (members,
measures).
DMR See dimensional modeled relational data.
DQM See dynamic query mode.
drill down
In a multidimensional representation of
data, to access information by starting
with a general category and moving
downwards through the hierarchy of
information, for example from Years to
Quarters to Months.
dynamic cube
An in-memory multidimensional
representation of a subset of a data
warehouse.
dynamic query mode (DQM)
A Java-based query execution mode that
provides native access to data sources. It
optimizes queries to address query
complexity and large data volumes. It
provides advanced query capabilities,
such as in-memory caching, that benefits
Glossary 251

query planning, execution, and results.
See also compatible query mode.
E
encryption
In computer security, the process of
transforming data into an unintelligible
form in such a way that the original data
either cannot be obtained or can be
obtained only by using a decryption
process.
event A change to a state, such as the
completion or failure of an operation,
business process, or human task, that can
trigger a subsequent action, such as
persisting the event data to a data
repository or invoking another business
process.
event key
A combination of data items that uniquely
defines an event instance. Identifying an
event instance enables the agent to
determine if it is new, ongoing or
stopped.
event list
The set of detected event instances
evaluated by the task execution rules to
determine which agent tasks should be
performed.
F
fact See measure.
G
gateway
An extension of a web server program
that transfers information from the web
server to another server. Gateways are
often CGI programs, but may follow other
standards such as ISAPI and Apache
modules.
glyph The actual shape (bit pattern, outline) of a
character image. For example, italic A and
roman A are two different glyphs
representing the same underlying
character. Strictly speaking, any two
images which differ in shape constitute
different glyphs. In this usage, glyph is a
synonym for character image, or simply
image (The Unicode Standard - Version
1.0).
group A collection of users who can share access
authorities for protected resources.
grouping
In reporting, the process of organizing
identical values of query items together
and only displaying the value once.
H
hierarchy
The organization of a set of entities into a
tree structure, with each entity (except the
root) having one or more parent entities
and an arbitrary number of child entities.
I
information card
A display of high-level information about
dashboard, workspace, or report content,
such as owner, contact information, date
modified, and an optional thumbnail view
of the dashboard, workspace, or report.
information pane
In Analysis Studio, a pane that helps the
user to confirm their selection in the data
tree by displaying related information,
such as the level and attributes.
initiative
A task developed to achieve objectives or
close the gap between performance and
targets. Initiatives are associated with
individual objectives and often known as
projects, actions, or activities.
item See member.
J
job A group of runnable objects, such as
reports, agents, and other jobs that the
user runs and schedules as a batch.
job step
The smallest part of a job that can be run
separately. A job step can be a report or it
can be another job.
252 IBM Cognos Workspace Advanced Version 10.2.2: User Guide

L
layout The arrangement of displayed matter on a
screen or page, such as including margins,
line spacing, type specification, header
and footer information, and indents.
lease key
A timed encryption mechanism that
governs authenticated access to stored
content on a mobile device.
level A set of entities or members that form
one section of a hierarchy in a dimension
and represent the same type of object. For
example, a geographical dimension might
contain levels for region, state, and city.
locale A setting that identifies language or
geography and determines formatting
conventions such as collation, case
conversion, character classification, the
language of messages, date and time
representation, and numeric
representation.
local storage
A device accessed directly (without
telecommunications) from the user's
system, where information can be
retained and later retrieved.
M
macro A fragment of code that can be inserted in
a number of locations in models and
reports, such as calculation and filter
expressions and SQL statements. Macros
can include references to session
parameters, parameter maps, parameter
map entries, and use functions to
dynamically customize applications. With
macros, a single report can address
different business scenarios.
MDX See Multidimensional Expression
Language.
measure
A performance indicator that is
quantifiable and used to determine how
well a business is operating. For example,
measures can be Revenue,
Revenue/Employee, and Profit Margin
percent.
member
A unique item within a hierarchy. For
example, Camping Equipment and 4 Man
tent are members of the Products
hierarchy.
metadata tree
Within a studio, a structure that contains
objects such as query subjects, query
items, dimensions, levels, and members.
A metadata tree is used as a palette of the
available data that can be inserted into
calculations, filters, display areas, and
other authoring gestures.
metric A measurement that assesses a key area
of a business.
metric extract
A set of mappings between an existing
Cognos data source and a Metric Studio
object or value. For example, a cube
measure named Revenue is mapped to a
Metric Studio metric named Revenue
Actual Value.
metric package
In Cognos Connection, a representation of
a Metric Studio application. A metric
package contains connection information,
reports, and metric management tasks for
that application. See also package.
metric store
A database that contains content for
metric packages. A metric store also
contains Metric Studio settings, such as
user preferences.
metric type
A category of metrics that defines the
business rules such as performance
pattern, units, and meaning of a group of
metrics. For example, Revenue can be a
metric type, and European Revenue and
North American Revenue would be
metrics of this type.
model A physical or business representation of
the structure of the data from one or more
data sources. A model describes data
objects, structure, and grouping, as well
as relationships and security. In Cognos
BI, a model is created and maintained in
Framework Manager. The model or a
subset of the model must be published to
the Cognos server as a package for users
to create and run reports.
multidimensional data source
See dimensional data source.
Glossary 253

Multidimensional Expression Language (MDX)
A query language for dimensional
sources.
N
named set
See predefined set.
namespace
A part of the model in which the names
may be defined and used. Within a
namespace, each name has a unique
meaning.
news item
A single entry in a Really Simple
Syndication (RSS) compatible format. It
can include a headline, text, and a link to
more information. A news item task in an
agent can be used to create news items
for display in a Cognos Connection
portlet.
O
object In Report Studio, an empty information
container that can be dragged to a report
from the Toolbox tab and then filled with
data. Reports are made up of objects,
which include crosstabs, text items,
calculations, graphics, and tables.
object extract
An extract that defines the metadata for a
Metric Studio object, such as a user
defined column, a scorecard, or a data
source.
P
package
A subset of a model, which can be the
whole model, to be made available to the
Cognos server. See also metric package.
page set
In Report Studio, a set of one or more
designed pages which repeat in the report
output for each instance of a chosen
query item. See also set.
passport
Session-based information, stored and
encrypted in Content Manager memory,
regarding authenticated users. A passport
is created the first time a user accesses
Cognos 8, and it is retained until a
session ends, either when the user logs off
or after a specified period of inactivity.
personal identification number (PIN)
In Cryptographic Support, a unique
number assigned by an organization to an
individual and used as proof of identity.
PINs are commonly assigned by financial
institutions to their customers.
PIN See personal identification number.
portlet
A reusable component that is part of a
web application that provides specific
information or services to be presented in
the context of a portal.
predefined set
A set of members defined inside an OLAP
data source as a list or by an expression.
Predefined sets can be used in analysis
and report authoring. See also custom set,
set.
product locale
The code or setting that specifies which
language, regional settings, or both to use
for parts of the product interface, such as
menu commands.
project
1. In Metric Designer, a group of
extracts. Each extract contains the
metadata that is used to populate the
Metric Studio data store or to create
applications.
2. In Metric Studio, a task or set of tasks
undertaken by a team and monitored
on a scorecard. A project tracks dates,
resources, and status.
prompt
A report element that asks for parameter
values before the report is run.
properties pane
Within a studio, a pane that provides an
overview of the properties for selected
data. The properties pane can also be
used to make several changes and apply
them at the same time, instead of
repeating several different commands.
publish
In Cognos Business Intelligence, to expose
information to the Cognos server so that
the data can be used to create reports and
other content.
254 IBM Cognos Workspace Advanced Version 10.2.2: User Guide

Q
query A business question formulated in Cognos
Business Intelligence in a studio or
modeling tool that retrieves data from a
data source.
query item
A named reference in a model or report to
a database column, a calculation, or a
query item in another query subject.
query subject
A named collection of query items that
are functionally related. This is
conceptually similar to a query which is
defined to a database or view.
R
Rapidly Adaptive Visualization Engine (RAVE)
A system for the general visualization of
all forms of data. RAVE is embedded
within IBM Cognos Business Intelligence,
and provides the ability for innovative
and interactive visualizations.
RAVE See Rapidly Adaptive Visualization
Engine.
Really Simple Syndication (RSS)
An XML file format for syndicated web
content that is based on the Really Simple
Syndication specification (RSS 2.0). The
RSS XML file formats are used by Internet
users to subscribe to websites that have
provided RSS feeds. See also Rich Site
Summary.
repeater
In Report Studio, a cell container that
repeats values within itself with no
predefined internal structure.
repeater table
In Report Studio, a table-like container
that repeats cells across and down the
page or row in the associated query.
report A set of data deliberately laid out to
communicate business information. See
also report specification.
report output
The output produced as a result of
executing a report specification against a
data set.
report specification
An executable definition of a report,
including query and layout rules, which
can be combined with data to produce a
report output. See also report.
report view
A reference to another report that has its
own properties, such as prompt values,
schedules, and results. Report views can
be used to share a report specification
instead of making copies of it.
response file
A file that can be customized with the
setup and configuration data that
automates an installation. During an
interactive installation, the setup and
configuration data must be entered, but
with a response file, the installation can
proceed without any intervention.
reverse proxy
An IP-forwarding topology where the
proxy is on behalf of the back-end HTTP
server. It is an application proxy for
servers using HTTP.
Rich Site Summary (RSS)
An XML-based format for syndicated web
content that is based on the RSS 0.91
specification. The RSS XML file formats
are used by Internet users to subscribe to
websites that have provided RSS feeds.
See also Really Simple Syndication.
RSS
1. See Rich Site Summary.
2. See Really Simple Syndication.
S
score A number or ranking that expresses
applicability in relation to a standard.
scorecard
A collection of metrics representing the
performance of one unit or aspect of an
organization.
scorecard structure
The hierarchy of scorecards that reflects
how an enterprise organizes its metrics.
Secure Sockets Layer (SSL)
A security protocol that provides
communication privacy. With SSL,
client/server applications can
communicate in a way that is designed to
Glossary 255

prevent eavesdropping, tampering, and
message forgery. See also certificate
authority.
security provider
See authentication provider.
selection-based set
A collection of individual items that the
user has explicitly selected. The items or
members may be selected from one or
more levels of the same hierarchy. See
also set.
session
The time during which an authenticated
user is logged on.
set A collection of related items or members.
Members in a set may be specifically
chosen, or selected by one or more filter
rules. In relational query processing, a set
is produced by several operations, such as
UNION, INTERSECT, and EXCEPT. See
also custom set, details-based set, page
set, predefined set, selection-based set,
stacked set.
SSL See Secure Sockets Layer.
stacked set
Two or more sets arranged one above
another in rows or side-by-side in
columns. See also set.
strategy
The overall plan of action (such as for a
brand unit, business unit, channel, or
company) to achieve a stated goal.
Strategies normally cover a period of
more than one year.
strategy map
In Metric Studio, a visual representation
of the strategy and the objectives of that
strategy for an organization. For example,
a strategy map may show employees how
their jobs are aligned to the overall
objectives of the organization.
summary
In reporting and analysis, an aggregate
value that is calculated for all the values
of a particular level or dimension.
Examples of summaries include total,
minimum, maximum, average, and count.
T
task An action performed by an agent if the
event status meets the task execution
rules. For example, an agent can send an
email, publish a news item, or run a
report.
task execution rule
A user-specified option within an agent
that determines which statuses and values
cause a task to be run. It determines
which tasks to execute for each event
instance.
template
In report authoring, a reusable report
layout or style that can be used to set the
presentation of a query or report.
thumbnail
An icon-sized rendering of a larger
graphic image that permits a user to
preview the image without opening a
view or graphical editor.
TLS See Transport Layer Security.
Transport Layer Security (TLS)
A set of encryption rules that uses
verified certificates and encryption keys
to secure communications over the
Internet. TLS is an update to the SSL
protocol.
tuple An ordered collection of two or more
members from different dimensions. For
example, the tuple (2007, Camping
Equipment, Japan) returns the value for
the intersection of the three members:
2007, Camping Equipment, and Japan.
Tuples can be used to filter and sort data,
and to create calculations.
U
union set
See stacked set.
user Any individual, organization, process,
device, program, protocol, or system that
uses the services of a computing system.
user-defined column
In metric management, a column used to
represent a value other than the actual or
target. It may be an industry benchmark
or any other useful additional numerical
information for a period, including a
calculation based on the other values of
256 IBM Cognos Workspace Advanced Version 10.2.2: User Guide

the metric. User-defined columns may be
different for each metric type.
user interface profile
A profile that defines the default behavior,
set of features, and the functionality that
is available to a user in the Report Studio
and Cognos Workspace Advanced user
interfaces.
V
virtual private network (VPN)
An extension of a company intranet over
the existing framework of either a public
or private network. A VPN ensures that
the data that is sent between the two
endpoints of its connection remains
secure.
visualization bundle
A compressed file that contains
information required for report authors to
add an extensible visualization to reports.
visualization library
A collection of extensible visualizations
that are imported into IBM Cognos
Administration for use in Report Studio
and Cognos Workspace Advanced.
VPN See virtual private network.
W
watch list
A list of metrics that each user has chosen
to monitor closely. If notification is
enabled in Metric Studio, the user will
receive email notification of changes to
these metrics. Users can also choose to
display their watch list as a portlet within
Cognos Connection.
watch rule
A user-defined condition that determines
whether a report is delivered to the user.
When the rule is run, the output is
evaluated and, if it satisfies the condition
or rule, the report is delivered by email or
news item. Watch rules limit report
delivery to those reports containing data
of significance to the user.
Web Services for Remote Portlets
A standard for creating
presentation-oriented web services so that
they can be easily integrated within other
applications, such as web portals.
widget
A portable, reusable application or piece
of dynamic content that can be placed
into a web page, receive input, and
communicate with an application or with
another widget.
work area
The area within a studio that contains the
report, analysis, query, or agent currently
being used.
workspace
See dashboard.
Glossary 257
258 IBM Cognos Workspace Advanced Version 10.2.2: User Guide

Index
Special characters
-- error characters 111, 141
! characters 207
* units of measure in dimensional reporting 136
% calculations
in dimensional reporting 146
in relational reporting 108
Numerics
100% stacked charts 66
3-D charts 67
A
absolute charts 65
accessibility
adding alternate text 203
adding summary text 204
specifying cell headers in tables 204
accessibility features 201
keyboard shortcuts 201
accessible reports 202
report output options 203
aggregating
limitations with measures 147
aggregation
setting in filters 120, 156
aligning objects 165
alternate text
accessibility 203
annotations
chart baselines 82
area charts 56
automating IBM Cognos BI using the SDK 40
averages
in dimensional reporting 141
in relational reporting 111
axes
adding titles 71
customizing 78
scales 78
B
backgrounds 162
adding colors 160
applying to charts 72
applying to progressive charts 73
in charts 75
bar charts 55
base text direction 169
baselines
adding to charts 82
bevels
adding to charts 75
bidirectional support 169
digit shaping 114, 138
enabling 33
bidirectional support (continued)
reports 5
blocks
inserting 164
borders 162
adding to charts 75
adding to objects 159
bottom filtering 153
boundary lines
showing or hiding 23
bubble charts 58
bullet charts 59
customizing 91
burst reports
Microsoft Excel format 214
C
calculations
adding in dimensional reporting 143
adding in relational reporting 105
building in dimensional reporting 147
building query calculations in relational reporting 108
creating simple in dimensional reporting 146
creating simple in relational reporting 108
function quality of service indicators in dimensional
reporting 148
function quality of service indicators in relational
reporting 108
limitations in dimensional reporting 144
limitations in relational reporting 105
solve order in dimensional reporting 143
solve order in relational reporting 105
using quotation marks in dimensional reporting 148
using quotation marks in relational reporting 109
cascading style sheets
classes 179
changed features
in version 10.1.0 16
chart configurations
100% stacked 66
3-D 67
stacked 65
standard 65
chart types
area charts 56
bar charts 55
bubble charts 58
bullet charts 59
column charts 53
combination charts 57
gauge charts 60
line charts 53
Marimekko charts 63
Pareto charts 60
pie charts 54
point charts 56
polar charts 64
progressive column charts 61
quadrant charts 62
radar charts 64
© Copyright IBM Corp. 2005, 2014
259
chart types (continued)
scatter charts 58
charts 49
adding alternate text 203
adding backgrounds 75
axes scales 78
bands of color in the background 79
baselines 82
choosing color palettes 72
choosing color palettes for progressive charts 73
colored regions 77
configurations 52
converting to a matrix 87
converting types 68
creating 49
customizing 70
customizing axes 78
customizing legends 79
defining colors by values 89
drop shadows 75
generated backgrounds 72
generated backgrounds for progressive charts 73
gridlines 79
interactive 3
notes 80
regression lines 83
resizing 71
sections 167
showing data points 85
showing data values 84
showing data values in bar, column, line, and area
charts 83
showing data values in pie and donut charts 84
showing value markers 85
tick marks 78
titles 71
types 52
circle charts 54
classes 179
clipboards
copying reports 183
opening reports 184
Cognos Business Insight
changed name 5
Cognos Business Insight Advanced
changed name 5
Cognos Report Studio
support for Cognos Theme Designer 2
Cognos Statistics
object missing from a report 210
removal in version 10.2.1 5
Cognos Theme Designer
supported by Cognos Report Studio and Cognos
Workspace Advanced 2
Cognos Workspace
naming objects for workspaces 40
Cognos Workspace Advanced
support for Cognos Theme Designer 2
colored regions
adding to charts 77
colors
adding to charts 89
adding to objects 160
choosing chart palettes 72
choosing color palettes for progressive charts 73
column charts 53
columns 32
columns (continued)
calculated in dimensional reporting 143
calculated in relational reporting 105
grouping in relational reporting 104
renaming 169
swapping with rows 47
width limitations in Microsoft Excel 213
combination charts 57
conditional palettes
creating 74
conditional styles
creating 175
container direction 169
container selectors
showing or hiding 23
content pane 21
context filters
area 22
creating 152
converting
lists to crosstabs 48
visualizations 101
copying
analysis results into Microsoft Excel spreadsheets 6, 183
reports 184
reports to the clipboard 183
counts
in dimensional reporting 141
in relational reporting 111
creating
report specifications 29
reports 29
crosstabs 43
applying table styles 166
creating single-edge 45
inherited table styles 6
inserting 164
nesting data 45
nodes 43
sections 167
showing values as percentages 46
CSV format
importing your own files 186
producing reports 35
currencies
data format limitations in Microsoft Excel output 213
formatting disappearing in SSAS 2005 210
formatting in dimensional reporting 136
custom groups
creating 117, 142
D
dashboards
using bullet charts 59
using gauge charts 60
data
adding 31
formatting in dimensional reporting 136
formatting in relational reporting 112
sorting dimensional 134
sorting relational 111
data containers
inserting from the Toolbox tab 30
data formats
locale-sensitive in dimensional reporting 137
locale-sensitive in relational reporting 113
260 IBM Cognos Workspace Advanced Version 10.2.2: User Guide
data formats (continued)
Microsoft Excel limitations 213
data items
adding 31
extended 156
data packages
managing changes 185
refreshing 30
data points
showing in charts 85
data sources
dimensionally-modeled relational 123
OLAP 123
data trees
customizing 124
dates
formatting in dimensional reporting 136
formatting in relational reporting 112
inserting 164
decimals
rounding in dimensional reporting 137
rounding in relational reporting 113
design mode 23
dial charts 60
digit shaping 169
in charts 114, 138
dimensional 142
dimensional data sources 123
running reports against 35
dimensional reporting
best practices 17
summarizing data 141
dimensionally-modeled relational data sources 123
limitations when aggregating measures 147
dimensions 32
overlapping named set levels 206
Don't Print class 180
drill options
creating drill-up/drill-down reports 157
drilling
on members 150
drop shadows 162
adding to charts 75
E
empty cells
specifying what appears for empty data containers 179
suppressing in dimensional reporting 139
suppressing in relational reporting 120
error messages
MSR-PD-0001 190
MSR-PD-0012 209
MSR-PD-0013 210
OP-ERR-0201 206
errors
troubleshooting error cells in reports 147
escape characters
in calculations in dimensional reporting 148
in calculations in relational reporting 109
Excel 2000 format
deprecation notices 17
Excel 2007 worksheet tabs 1
extended data items 156
extensible visualizations 93
converting 2
in standard reports 3
extensible visualizations (continued)
optional category fields 2
properties 2
external data
importing your own files 186
MSR-PD-0012 error when importing 209
MSR-PD-0013 error when importing 210
reporting 185
supported data sources 9
F
facts 32
fills 162
adding to charts 75
filtering
members in a set 153
to top or bottom values 153
using context filters 152
using slicers 152
filters
adding simple filters 116
based on data items not in the report 119
combining 120, 156
combining conditions 118, 155
dimensional data 151
editing 120, 156
floating point numbers 151
floating objects 174
floating point numbers
filtering 151
fonts
specifying for reports 160
footers
adding 159
footers and headers
showing or hiding 23
foreground colors 160
formatting
disappearing in SSAS 2005 210
functions
quality of service indicators in dimensional reporting 148
quality of service indicators in relational reporting 108
G
gauge charts 60
customizing 88
glossary 249
gridlines
customizing 79
grouping
data in relational reporting 104
sorting columns 111
groups
custom 3, 117, 142
H
headers
adding 159
creating for sets 46
headers and footers
showing or hiding 23
heatmap visualizations 96
height of objects 174
Index
261
hierarchies 32
inserting 127
highlighting
using conditional styles 175
horizontal charts,
See bar charts
HTML format
producing reports 33
hyperlinks
buttons are not supported for Microsoft Excel 214
inserting buttons 164
I
IBM Cognos BI Software Development Kit 40
icons 32
images
adding alternate text 203
adding as backgrounds 162
inserting in reports 161
Microsoft Excel limitations 211
indenting
objects 168
interactive charts 3
intersections of members
in dimensional reporting 149
J
Japanese
Microsoft Excel limitations 213
justification
setting for objects 172
L
labels
specifying in gauge charts 88
layout
laying out financial reports 40
laying out report pages 165
using tables 165
layouts
choosing 30
legends
adding titles 71
customizing 79
level hierarchies 123
levels 32, 123
limitations
aggregating measures in dimensionally-modeled relational
or relational data sources 147
line breaking 173
line charts 53
line spacing 173
lineage information 41
lines
adding regression lines to charts 83
lists 103
applying table styles 166
converting to crosstabs 48
grouping data 104
inherited table styles 6
sections 167
single-edge crosstabs 45
literal strings
in calculations in dimensional reporting 148
in calculations in relational reporting 109
live data
viewing 23
locales
locale-sensitive properties 113
locale-sensitive properties in dimensional reporting 137
M
Manage External Data tool
overview 185
margins
setting 168
Marimekko charts 63
matrix charts 87
matrix reports 43
maximum
in dimensional reporting 141
in relational reporting 111
measures 32
member properties 123
inserting 127
member sets
creating 128
joining 132
members 32
creating from existing members 129
drilling on 150
excluding 128
expanding and collapsing 130
inserting properties 127
intersections in dimensional reporting 149
moving 128
replacing 129
searching for 126
members folders 123
Microsoft Excel
copying analysis results into spreadsheets 183
grouping and ungrouping repeating cells 37
limitations of nested report objects 213
producing reports in 36
report limitations 211
minimum
in dimensional reporting 141
in relational reporting 111
missing values
suppressing in dimensional reporting 139
suppressing in relational reporting 120
models 32
using design filters 33
MSR-PD-0001 errors 190
MSR-PD-0012 errors 209
MSR-PD-0013 errors 210
My Data Sets
overview 186
My Data Sets tool
overview 185
N
named sets
nested or parallel sets overlapping 206
nested report objects
Microsoft Excel limitations 213
262 IBM Cognos Workspace Advanced Version 10.2.2: User Guide
nested sets
unexpected summary values 206
nesting
data in crosstabs 45
new features
in version 10.1.0 9
in version 10.1.1 7
in version 10.2.0 5
in version 10.2.1 3
in version 10.2.1.1 3
in version 10.2.2 1
no data
specifying what appears 179
No Data Contents 179
notes
adding to charts 80
number data formats
Microsoft Excel limitations 213
numeric shaping
See digit shaping
O
objects 23
aligning 165
indenting 168
inserting 164
setting margins 168
specify how other objects flow around 174
OLAP
data sources 123
OLAP data sources
limitations with relational functions 207
OP-ERR-0201 errors 206
options
setting 24
Oracle Essbase
changes 205
overflow 174
P
packages 32, 123
managing changes 185
refreshing 30
specifying 29
packed bubble visualizations 98
padding
applying 168
page breaks
creating with page layers 133
page layers 133
area 22
page numbers
adding 162
pages 23
palettes
conditional 74
Pareto charts 60
PDF format
producing reports 33
PDF page options
setting 39
percent calculations
in dimensional reporting 146
in relational reporting 108
pie charts 54
converting to donut charts 90
exploding slices 90
point charts 56
polar charts 64
PowerCubes
incorrect results 209
preview mode 23
printing
not printing objects 180
progressive column charts 61
properties pane 22
Q
quadrant charts 62
quadrants
adding to charts 77
query calculations
creating in dimensional reporting 147
creating in relational reporting 108
quotation marks
in calculations in dimensional reporting 148
in calculations in relational reporting 109
R
radar charts 64
rebranding
Cognos Report Studio 2
Cognos Workspace Advanced 2
refreshing packages 30
regression lines 83
relational data
working with 105
relational functions
limitations when used with OLAP data sources 207
relational reporting
best practices 17
grouping data 104
summarizing data 111
removed features
in version 10.1.0 16
in version 10.2.1 5
renaming
rows and columns 169
repeating cells
grouping and ungrouping in Excel 2007 output 37
report formats
Excel 36
XML 39
report layouts 23
report outputs
accessibility options 203
Microsoft Excel 2007 8
report specifications 40
creating 29
report types
crosstab 43
reports
creating 29
producing in CSV format 35
properties 179
supporting bidirectional content 169
resizing
charts 71
Index
263
resizing objects 174
reusing
styles 161
rollup calculations
in dimensional reporting 146
in relational reporting 108
rounding numbers
in dimensional reporting 137
in relational reporting 113
row numbers
inserting 164
rows
renaming 169
swapping with columns 47
rows per page 33
run options
accessibility options 203
setting 33
running reports 33
against dimensional data sources 35
against SAP BW 35
format restrictions 2
S
Sample Outdoors Company
samples 199
samples 199
GO Data Warehouse (analysis) package 199
GO Data Warehouse (query) package 200
SAP BW data sources
running reports against 35
units of measure notation 35
scatter charts 58
screen resolution requirements 20
searching
members 126
tab 22
sections
creating 167
creating for dimensional data 133
sector charts 54
Secure Socket Layer
Microsoft Excel limitations 213
set definitions 132
set expressions
building in dimensional reporting 147
set members
moving 128
sets
editing 132
filtering 153
reusing 130, 131
sharing 3, 130, 131
sets of members
creating 128
joining 132
nested or parallel sets overlapping 206
shared sets
copying 131
creating 130
managing 131
sharing
sets 130, 131
single-edge crosstabs 45
sizes of objects 174
slicers
creating 152
sorting
advanced 135
dimensional data 134
grouped columns 111
lists based on data items not in the report 112
members in sets 134
multiple rows or columns 111
relational data 111
sets by value 135
source tab 21
source trees
customizing 124
spacing between objects 168
spider charts 64
SSAS 2005 cubes
troubleshooting 207
SSAS 2005 data sources
disappearing data formats 210
stacked charts 65
standard charts 65
star charts 64
studios
Oracle Essbase changes 205
styles
applying to tables 166
changing default classes 179
conditional 175
reusing 161
summarizing data
in dimensional reporting 141
in relational reporting 111
summary text
adding to tables 204
summary values
unexpected when using nested sets 206
supporting bidirectional content 5
T
table styles
inherited 6
tables
adding summary text 204
applying styles 166
inserting 165
Microsoft Excel width limitations 213
specifying cell headers 204
using for layout 165
tabular data
viewing 33
templates
choosing 30
text
adding 160
specifying flow in objects 172
specifying justification 172
textures
adding to charts 75
tick marks
showing in charts 78
times
inserting 164
titles
adding to charts 71
264 IBM Cognos Workspace Advanced Version 10.2.2: User Guide
TM1 data sources
order of metadata tree 209
report differences 208
toolbox tab 21
top filtering 153
totals
in dimensional reporting 141
in relational reporting 111
treemap visualizations 95
trend lines 83
tuples
in dimensional reporting 149
TXT data
importing your own files 186
U
units of measure
notation for SAP BW data sources 35
upgrading reports
overview 195
report styles 197
user interface 20
user interface profiles 1, 21
V
validating
reports 33
value markers
showing in charts 85
values
showing crosstab values as percentages 46
visual aids 23
visualizations
adding 93
converting 101
extensible 93
resizing 100
sections 167
visualizations (continued)
specifying the categorical data to display 100
specifying the range of values to display 100
updating 101
working with visualization properties 100
W
waterfall charts 61
web browsers
settings 27
Web-safe
color palettes 160
width of objects 174
widths
Microsoft Excel limitations 213
word breaks 173
work area 21
worksheet tabs in Excel 2007 output 1
workspaces
Cognos Workspace 40
X
XLS format
importing your own files 186
limitations 211
XML
importing your own files 186
producing a report 39
report specifications 40
XY charts,
See scatter charts
Z
zeros
suppressing in dimensional reporting 139
suppressing in relational reporting 120
Index
265
