

Executive Summary 2Fayetteville-Springdale-Rogers, Arkansas-Missouri Comprehensive Housing Market Analysis as of August 1, 2022
Comprehensive Housing Market Analysis Fayetteville-Springdale-Rogers, Arkansas-Missouri
U.S. Department of Housing and Urban Development, Office of Policy Development and Research
Executive Summary
Housing Market Area Description
The Fayetteville-Springdale-Rogers Housing Market
Area (hereafter, Fayetteville HMA) includes Benton,
Madison, and Washington Counties in northwest
Arkansas and McDonald County in southwest Missouri.
The HMA, in the Ozark Mountains, is coterminous
with the Fayetteville-Springdale-Rogers, AR-MO
Metropolitan Statistical Area (MSA). The HMA draws
residents and visitors for its numerous state parks,
more than 500 miles of lake shoreline, and a wide
array of entertainment and sports events, including
University of Arkansas (UA) football games and shows
at several local art centers.
The current population of the HMA is estimated
at 600,000.
Tools and Resources
Find interim updates for this metropolitan area, and select geographies nationally, at PD&R’s
Market-at-a-Glance tool.
Additional data for the HMA can be found in this report’s supplemental tables.
For information on HUD-supported activity in this area, see the Community Assessment Reporting Tool.

Executive Summary 3Fayetteville-Springdale-Rogers, Arkansas-Missouri Comprehensive Housing Market Analysis as of August 1, 2022
Comprehensive Housing Market Analysis Fayetteville-Springdale-Rogers, Arkansas-Missouri
U.S. Department of Housing and Urban Development, Office of Policy Development and Research
Market Qualifiers
The Fayetteville HMA economy expanded at a
fast pace during the past year and has completely
recovered from severe job losses that occurred
during April 2020 from the COVID-19 pandemic.
By September 2021, the HMA economy recovered
all the 26,100 jobs lost in April 2020, and since
May 2020, nonfarm payrolls have increased
by 40,100 jobs (monthly data, not seasonally
adjusted). During the 12 months ending July 2022,
nonfarm payrolls increased in all 11 job sectors.
The professional and business services sector led
job growth, with gains that accounted for nearly
one-third of the total increase in nonfarm payrolls
during the period. During the 3-year forecast
period, nonfarm payrolls are expected to increase
an average of 2.6 percent annually.
The home sales vacancy rate is currently
estimated at 1.2 percent, down from 3.8 percent
in April 2010 when conditions were soft. The
current supply of homes for sale is down
considerably compared with April 2010, when
the supply of home inventory was 12.9 months.
During the 12 months ending July 2022, new
and existing home sales in the HMA totaled
17,550, down 5 percent compared with a year
earlier (CoreLogic, Inc., with adjustments by the
analyst). The average price for a home increased
23 percent to $325,900, representing the
largest increase in the average sale price since
at least 2001. During the next 3 years, demand
is estimated for 14,000 new homes. The 4,400
homes currently under construction will satisfy
a portion of that demand.
Rental market conditions are tight in the HMA as of
August 1, 2022, compared with soft conditions in
April 2010. The apartment market is also tight, with
an average vacancy rate of 2.3 percent during the
second quarter of 2022, down from 2.5 percent a
year earlier and from a second-quarter peak of 7.8
percent during the second quarter of 2009 (CoStar
Group). The average apartment rent during the
second quarter of 2022 increased 12 percent to
$970 from a year earlier, representing the fastest
increase in the average apartment rent since at
least 2001. During the forecast period, demand is
estimated for 6,475 new rental units. The 4,300
units currently under construction are expected to
satisfy part of that demand.
Economy
Strong: During the 12 months
ending July 2022, nonfarm payrolls
in the Fayetteville HMA increased
by 14,600, or 5.5 percent, to
281,200 jobs.
Rental Market
Tight: The rental vacancy rate is
currently estimated at 6.5 percent,
down from 13.9 percent in 2010.
Sales Market
Tight: The HMA had a 1.5-month
supply of homes for sale in July
2022, up from 1.2 months a year
earlier but still down from 3.7 months
in July 2019, when conditions were
balanced (CoreLogic, Inc.).
TABLE OF CONTENTS
Economic Conditions 4
Population and Households 10
Home Sales Market 14
Rental Market 19
Terminology Definitions and Notes 23
3-Year Housing Demand Forecast
Sales Market Rental Market
Fayetteville HMA
Total Demand 14,000 Homes 6,475 Units
Under Construction 4,400 Homes 4,300 Units
Notes: Total demand represents estimated production necessary to achieve a balanced market at the end of the forecast period. Units under
construction as of August 1, 2022. The forecast period is August 1, 2022, to August 1, 2025.
Source: Estimates by the analyst
Economic Conditions 4Fayetteville-Springdale-Rogers, Arkansas-Missouri Comprehensive Housing Market Analysis as of August 1, 2022
Comprehensive Housing Market Analysis Fayetteville-Springdale-Rogers, Arkansas-Missouri
U.S. Department of Housing and Urban Development, Office of Policy Development and Research
Economic Conditions
Largest Sector: Professional and Business Services
Nonfarm payroll growth, led by gains in the professional and business
services sector, has been strong in the Fayetteville HMA during most
of the past two decades, with annual increases in nonfarm payrolls of
2.0 percent or greater during 16 of the past 21 years.
Primary Local Economic Factors
The economy of the Fayetteville HMA benefits considerably from its largest
employers—Walmart Inc. (Walmart), Tyson Foods, Inc. (Tyson), and UA, which
account for a combined 15 percent of jobs in the HMA (Table 1). Walmart,
the largest retailer in the world with a workforce of 2.30 million worldwide,
employs 29,600 workers throughout the HMA; 15,000 of those employees
work at its corporate headquarters in the city of Bentonville in Benton County.
In addition, an estimated 1,600 Walmart suppliers maintain corporate offices
locally and employ an estimated combined workforce of more than 10,000
people in the HMA. Tyson, one of the largest food manufacturing companies
in the nation, is the second largest employer in the HMA, with 7,500 workers,
of which 2,000 are employed at its corporate headquarters in the city of
Springdale, which straddles Benton and Washington Counties. Along with
their headquarters facilities, Walmart and Tyson have various support,
distribution, data processing, and operational facilities (retail stores and
manufacturing plants, respectively) throughout the HMA, with jobs distributed
among numerous sectors. With 4,775 full-time employees at its main campus
in the city of Fayetteville, UA is the third largest employer. UA generates
$1.4 billion in economic activity in the HMA annually (University of Arkansas).
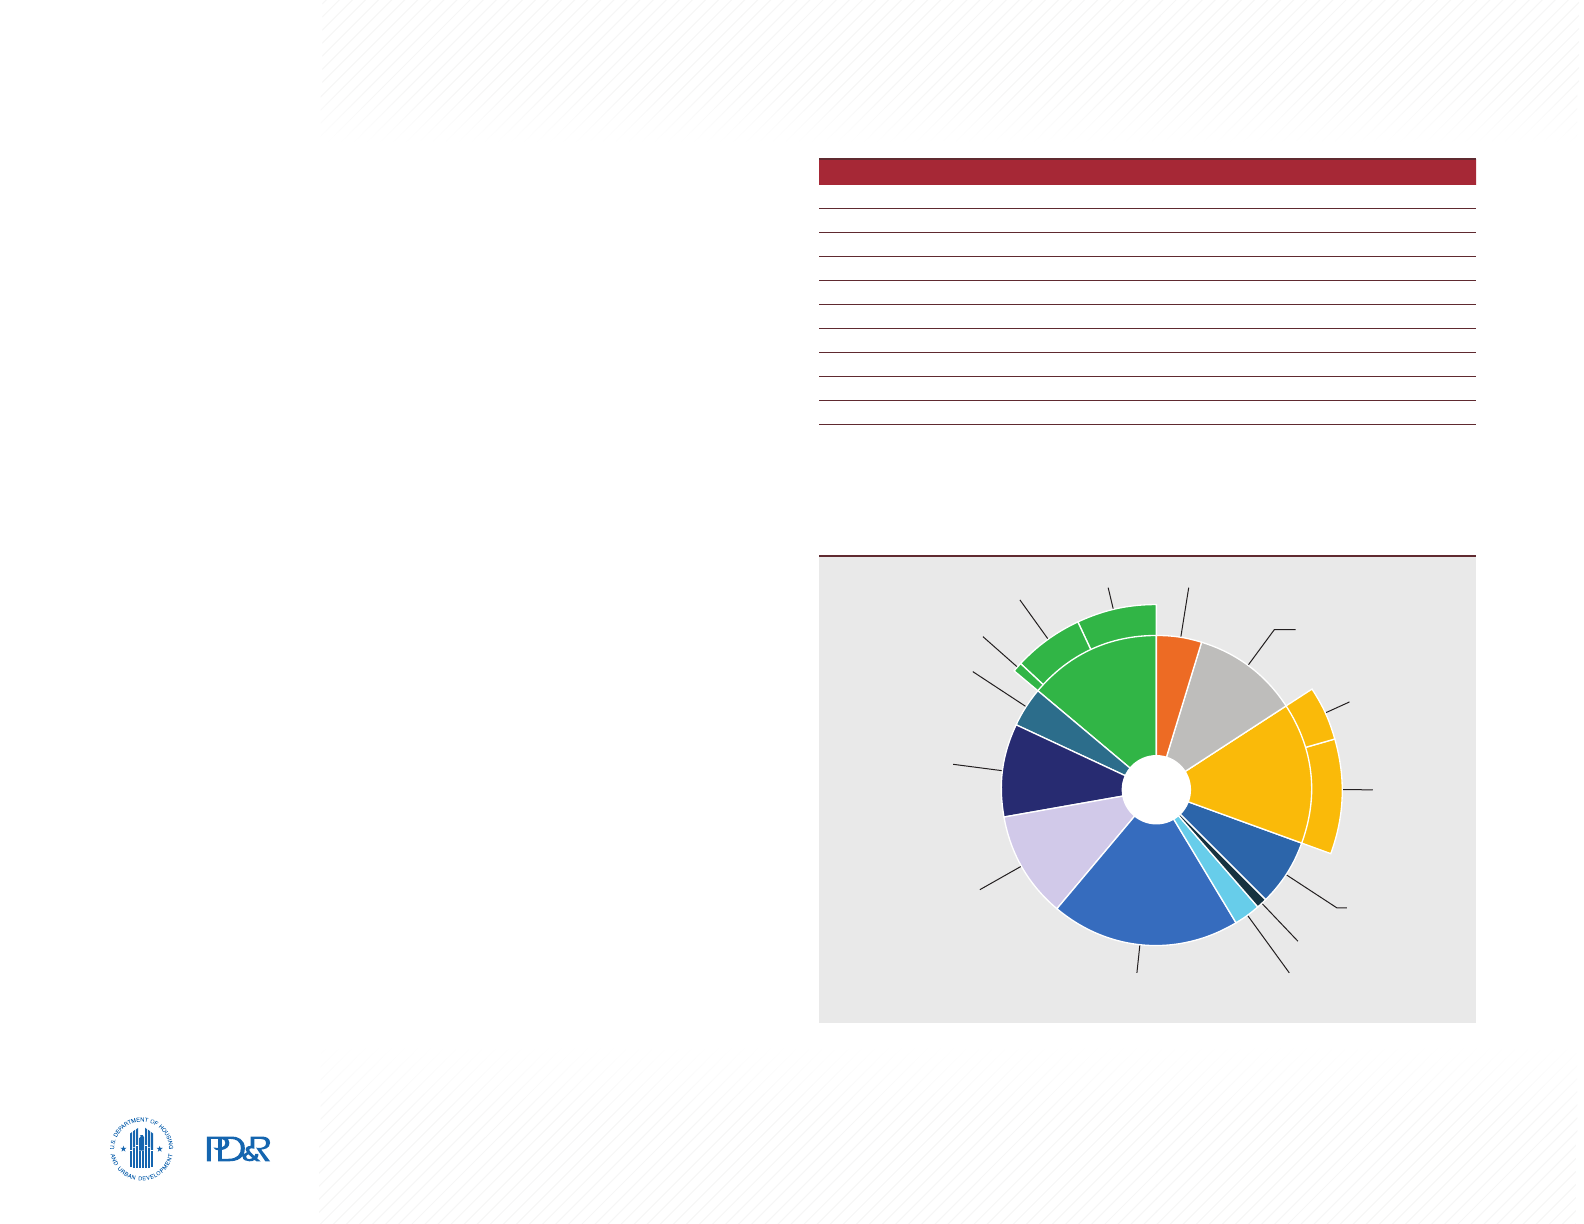
The professional and business services sector in the HMA significantly
impacts the local economy. The sector was the largest during the 12 months
ending July 2022, with 56,100 jobs, or one-fifth of all nonfarm payroll jobs,
compared with 15 percent nationally (Figure 1). Corporate headquarters for
many companies are often included in this sector, even if those firms have
essential activities carried out at other facilities that are in one or more other
Education & Health
Services 11%
Mining, Logging, & Construction 5%
Manufacturing 11%
Transportation
& Utilities 7%
Information 1%
Financial Activities 3%
Professional & Business
Services 20%
Leisure &
Hospitality 10%
Other Services 4%
Federal 1%
State 6%
Local 7%
Total
281.2
Government
14%
Wholesale 5%
Retail 10%
Trade 15%
Figure 1. Share of Nonfarm Payroll Jobs in the Fayetteville HMA, by Sector
Notes: Total nonfarm payroll is in thousands. Percentages may not add to 100 percent due to rounding.
Based on 12-month averages through July 2022.
Source: U.S. Bureau of Labor Statistics
Table 1. Major Employers in the Fayetteville HMA
Name of Employer Nonfarm Payroll Sector Number of Employees
Walmart Inc. Multiple Sectors 29,600
Tyson Foods, Inc. Multiple Sectors 7,500
University of Arkansas Government 4,775
Washington Regional Medical Center Education & Health Services 3,200
J.B. Hunt Transport Services, Inc. Transportation & Utilities 3,000
Simmons Foods, Inc. Manufacturing 2,600
Mercy Northwest Arkansas Education & Health Services 2,300
Northwest Health Education & Health Services 2,200
McKee Foods Corporation Manufacturing 1,800
Arvest Bank Financial Activities 1,800
Notes: The U.S. Bureau of Labor Statistics classifies headquarters and support facilities of large corporations
into nonfarm payroll sectors that may differ from those of the corporations’ main line of business. Excludes
local school districts.
Sources: Employers; local chambers of commerce

Economic Conditions 5Fayetteville-Springdale-Rogers, Arkansas-Missouri Comprehensive Housing Market Analysis as of August 1, 2022
Comprehensive Housing Market Analysis Fayetteville-Springdale-Rogers, Arkansas-Missouri
U.S. Department of Housing and Urban Development, Office of Policy Development and Research
sectors. The sector has added the greatest
number of jobs since 2001, accounting for
27 percent of all new jobs during the period; it
was also the fastest growing sector since
2001 (Figure 2). The strong job growth in the
professional and business services sector, which
offers higher wages than most other sectors,
contributed to an average annual increase in
wages in the HMA of 4.0 percent from 2002
through 2010 and 3.7 percent from 2011 through
2021 (Bureau of Labor Statistics Quarterly Census
of Employment and Wages). Nationally, wages
increased an average of 2.9 percent annually
from 2002 through 2010 and an average of
3.4 percent annually from 2011 through 2021
by comparison. The average annual wage of
workers in the professional and business services
sector in the HMA was $112,100 in 2021, up
an average of 4.2 percent annually compared
with 2010. By comparison, the average wage
nationally in the sector was $90,100 in 2021,
an average increase of 3.7 percent annually
compared with 2010. The high concentration
of corporate headquarters and offices in the
HMA contributed to a higher annual wage in
the professional and business services sector
compared with the nation.
2020 Recession and Recovery
The effects of COVID-19 were significant in the
HMA. On a monthly basis, nonfarm payrolls
declined by 26,100 jobs, or 9.6 percent, during
Note: Current data are based on the 12 months ending July 2022.
Source: U.S. Bureau of Labor Statistics
April 2020, a period that partly coincided with the recent national recession (not seasonally adjusted).
Although job losses occurred in every sector, declines were greatest in sectors in which jobs could not be
performed remotely. Nonfarm payroll decreases were greatest in the leisure and hospitality sector, which
declined by 10,600 jobs, or 39.1 percent, accounting for 41 percent of all job losses during April 2020.
Contributing to the job losses in the sector, local municipalities implemented numerous measures to slow
the spread of COVID-19, including restrictions on business hours and capacity limits at restaurants and
retail stores. These restrictions were lifted by the spring of 2021, which contributed to the HMA economy
regaining all the jobs lost during April 2020 by September 2021. Monthly job growth from May 2020 to
September 2021 was greatest in the leisure and hospitality sector, which gained 10,700 jobs, or 64.8
percent, compared with April 2020. The HMA recovered from COVID-19-related job losses much faster
than the nation, which did not fully recover job losses until May 2022.
Total Nonfarm Payroll Jobs
Goods-Producing Sectors
Mining, Logging, & Construction
Manufacturing
Service-Providing Sectors
Wholesale & Retail Trade
Transportation & Utilities
Information
Financial Activities
Professional & Business Services
Education & Health Services
Leisure & Hospitality
Other Services
Government
-20.00 0.00 20.00 40.00 60.00 80.00 100.00 120.00 140.00
Change in Jobs (%)
Figure 2. Sector Growth in the Fayetteville HMA, 2001 to Current

Economic Conditions 6Fayetteville-Springdale-Rogers, Arkansas-Missouri Comprehensive Housing Market Analysis as of August 1, 2022
Comprehensive Housing Market Analysis Fayetteville-Springdale-Rogers, Arkansas-Missouri
U.S. Department of Housing and Urban Development, Office of Policy Development and Research
Current Conditions—
Nonfarm Payrolls
During the 12 months ending July 2022, nonfarm
payrolls in the HMA increased by 14,600, or
5.5 percent, to 281,200 jobs compared with
a 1.3-percent increase a year earlier (Table 2).
Although job growth occurred in every sector
during the period, gains were greatest in the
professional and business services sector, up by
4,700, or 9.1 percent, compared with an increase
of 1.0 percent a year earlier. Widespread hiring
in back-office and corporate-level positions
contributed to job growth in the sector. Job growth
was also strong in the leisure and hospitality
and the wholesale and retail trade sectors,
which increased by 2,500 and 2,300 jobs, or
10.1 and 5.8 percent, to 27,200 and 41,700 jobs,
respectively. Two-thirds of the increase in the
wholesale and retail trade sector occurred in the
retail trade subsector, which increased by 1,500,
or 5.6 percent, to 28,500 jobs compared with a
Table 2. 12-Month Average Nonfarm Payroll Jobs (1,000s) in the Fayetteville HMA, by Sector
12 Months Ending
July 2021
12 Months Ending
July 2022
Absolute Change Percentage Change
Total Nonfarm Payroll Jobs 266.6 281.2 14.6 5.5
Goods-Producing Sectors 44.4 45.4 1.0 2.3
Mining, Logging, & Construction 13.6 13.9 0.3 2.2
Manufacturing 30.8 31.5 0.7 2.3
Service-Providing Sectors 222.2 235.8 13.6 6.1
Wholesale & Retail Trade 39.4 41.7 2.3 5.8
Transportation & Utilities 18.4 19.6 1.2 6.5
Information 1.9 2.1 0.2 10.5
Financial Activities 8.8 9.0 0.2 2.3
Professional & Business Services 51.4 56.1 4.7 9.1
Education & Health Services 29.9 30.7 0.8 2.7
Leisure & Hospitality 24.7 27.2 2.5 10.1
Other Services 9.8 9.9 0.1 1.0
Government 37.9 39.5 1.6 4.2
Notes: Based on 12-month averages through July 2021 and July 2022. Numbers may not add to totals due to rounding. Data are in thousands.
Source: U.S. Bureau of Labor Statistics
4.8-percent increase a year earlier. Gains in both the leisure and hospitality and the wholesale and retail
trade sectors generally followed national trends. Nationally, the leisure and hospitality and the wholesale
and retail trade sectors increased 13.9 and 2.9 percent, respectively, and the gains in the retail trade
subsector accounted for 73 percent of job growth in the wholesale and retail trade sector.

Economic Conditions 7Fayetteville-Springdale-Rogers, Arkansas-Missouri Comprehensive Housing Market Analysis as of August 1, 2022
Comprehensive Housing Market Analysis Fayetteville-Springdale-Rogers, Arkansas-Missouri
U.S. Department of Housing and Urban Development, Office of Policy Development and Research
Economic Periods of Significance
2001 Through 2006
From 2001 through 2006, the HMA economy
expanded at a strong pace, with nonfarm payrolls
increasing by an average of 7,200 jobs, or 4.0
percent, annually to 205,400 jobs (Figure 3).
The professional and business services and the
wholesale and retail trade sectors led job growth
during this period. The professional and business
services sector gained an average of 1,300 jobs,
or 4.9 percent, annually because of widespread
hiring at corporate offices. The wholesale and
retail trade sector also increased by an average
of 1,300 jobs, or 4.8 percent, annually. Job
growth was also strong in the transportation
and utilities sector, which gained an average
of 1,100 jobs, or 7.8 percent, annually during
the same period. Several Walmart distribution
center expansions near the city of Bentonville
contributed to gains in the sector.
2007 Through 2009
During 2007, job growth in the HMA slowed
to an increase of 2,800, or 1.4 percent, before
nonfarm payrolls declined during 2008 and
2009 by an average of 4,300, or 2.1 percent,
annually because of the effects of the Great
Recession. Job declines during 2008 and 2009
were greatest in the transportation and utilities
sector, which decreased by an average of 1,600,
or 9.7 percent, annually, and widespread layoffs
resulted in a decrease in the manufacturing sector by an average of 1,500 jobs, or 4.9 percent, annually.
In addition, significant declines in home construction resulted in fewer jobs in the mining, logging,
and construction sector, which also decreased by an average of 1,500 jobs, or 13.5 percent, annually.
Reflecting national trends, an increase in the education and health services sector, which gained an
average of 1,000 jobs, or 4.9 percent, annually, partially offset nonfarm payroll losses during the period.
2010 Through 2016
In 2010, the economy in the HMA began to recover, and nonfarm jobs surpassed prerecession payroll
levels by late 2012. From 2010 through 2013, nonfarm payrolls increased by an average of 3,800 jobs,
or 1.9 percent, annually to 214,800. The professional and business services sector led job gains with
an average annual increase of 2,000, or 5.5 percent, partly because of an increase in back-office and
corporate-level positions. Economic expansion was strong from 2014 through 2016, when nonfarm payrolls
increased by an average of 10,300 jobs, or 4.6 percent, annually, with job growth occurring in every
National Recession Nonfarm Payrolls
Jul-00
Jul-01
Jul-02
Jul-03
Jul-04
Jul-05
Jul-06
Jul-07
Jul-08
Jul-09
Jul-10
Jul-11
Jul-12
Jul-13
Jul-14
Jul-15
Jul-16
Jul-17
Jul-18
Jul-19
Jul-20
Jul-21
Jul-22
300
275
250
225
200
175
150
Nonfarm Payrolls (in Thousands)
Note: 12-month moving average.
Sources: U.S. Bureau of Labor Statistics; National Bureau of Economic Research
Figure 3. 12-Month Average Nonfarm Payrolls in the Fayetteville HMA

Economic Conditions 8Fayetteville-Springdale-Rogers, Arkansas-Missouri Comprehensive Housing Market Analysis as of August 1, 2022
Comprehensive Housing Market Analysis Fayetteville-Springdale-Rogers, Arkansas-Missouri
U.S. Department of Housing and Urban Development, Office of Policy Development and Research
Unemployment Trends
The average unemployment rate in the HMA has been less than the
national rate since at least 2000 (Figure 4). From 2000 through 2008,
the unemployment rate averaged 3.5 percent in the HMA compared with
5.1 percent nationally. During 2009 and 2010, the average unemployment
rate increased considerably and reached 6.5 percent by the end of 2010
compared with the national rate of 9.6 percent. The unemployment rate
subsequently declined during each of the next 9 years to 2.5 percent in
2019. Nationally, the unemployment rate decreased from 2011 through
2019 to reach 3.7 percent. During the 12 months ending July 2022, the
average unemployment rate in the HMA was 2.4 percent. By comparison,
the average rate a year earlier was 3.7 percent, and the recent peak of
4.8 percent occurred during the 12 months ending February 2021 due to
widespread layoffs stemming from the effects of COVID-19. Nationally, the
unemployment rate during the 12 months ending July 2022 was 4.0 percent,
down from a recent peak of 8.7 percent during the 12 months ending
March 2021. Relatively strong resident employment growth in the HMA,
payroll sector. The professional and business services sector led job growth,
increasing by an average of 2,700, or 6.1 percent, annually. An expansion
in 2014 at Serco Inc. in the city of Rogers resulted in 1,000 new back-office
positions and contributed to the sector gain. Serco Inc., with 1,600 employees,
provides contract services for the federal government. Job growth was also
strong from 2014 through 2016 in the wholesale and retail trade sector, which
increased by an average of 1,800, or 5.0 percent, annually. The opening of
16 new Walmart stores during the period contributed to the increase. The
leisure and hospitality and the education and health services sectors each
increased by an average of 1,100 jobs, or 4.9 and 4.3 percent, respectively.
Widespread hiring at 11 new hospitals in the HMA contributed to an increase
in the education and health services sector during the period.
2017 Through 2019
The HMA economy continued to expand from 2017 through 2019, albeit at a
slower pace compared with the previous period. Nonfarm payrolls increased
by an average of 6,300 jobs, or 2.5 percent, annually. The government sector
led job growth during the period, with an average annual increase of 1,100,
or 3.2 percent. More than 80 percent of the gains in the sector occurred in
the state government subsector, which increased by an average of 900, or
6.2 percent, annually. Gains were also strong in the manufacturing sector,
which increased by an average of 1,000 jobs, or 3.4 percent, annually.
Simmons Foods, Inc., the sixth largest employer in the HMA with 2,600
workers, opened a new processing facility in 2019, resulting in 700 new
jobs, contributing to the gains in the manufacturing sector.
10.0
9.0
8.0
7.0
6.0
5.0
4.0
3.0
2.0
1.0
0.0
Jul-00
Jul-01
Jul-02
Jul-03
Jul-04
Jul-05
Jul-06
Jul-07
Jul-08
Jul-09
Jul-10
Jul-11
Jul-12
Jul-13
Jul-14
Jul-15
Jul-16
Jul-17
Jul-18
Jul-19
Jul-20
Jul-21
Jul-22
Unemployment Rate (%)
Fayetteville HMA Nation
Note: Based on the 12-month moving average.
Source: U.S. Bureau of Labor Statistics
Figure 4. 12-Month Average Unemployment Rate in the
Fayetteville HMA and the Nation

Economic Conditions 9Fayetteville-Springdale-Rogers, Arkansas-Missouri Comprehensive Housing Market Analysis as of August 1, 2022
Comprehensive Housing Market Analysis Fayetteville-Springdale-Rogers, Arkansas-Missouri
U.S. Department of Housing and Urban Development, Office of Policy Development and Research
which has averaged 2.4 percent annually since 2001 compared with an
average annual increase of 0.6 percent nationally, has contributed to
relatively low unemployment rates compared with the nation.
Forecast
During the 3-year forecast period, nonfarm payrolls are expected to increase
by an average of 2.6 percent annually. Job growth is expected to be slower
during the first year of the forecast period, partly because of expected adverse
impacts on the local economy from high inflation and increased interest rates,
including reduced business and consumer spending. Job growth is expected
to strengthen each year during the second and third years of the forecast
period and is expected to be strong in several sectors, including the education
and health services sector. In July 2022, Mercy Northwest Arkansas, the
seventh largest employer in the HMA, announced expansion plans totaling
$500 million that include several new hospitals and clinics throughout the
HMA. The professional and business services sector is expected to increase
partly because of several planned expansions, including the relocation of
Tyson corporate staff from several offices in other areas of the nation to its
corporate headquarters in 2023 that will result in 1,000 new jobs in the HMA.
Walmart is currently building a new corporate headquarters campus in the city
of Bentonville. The new campus is expected to be complete in 2024 and will
include 12 office buildings on 350 acres.

Population and Households 10Fayetteville-Springdale-Rogers, Arkansas-Missouri Comprehensive Housing Market Analysis as of August 1, 2022
Comprehensive Housing Market Analysis Fayetteville-Springdale-Rogers, Arkansas-Missouri
U.S. Department of Housing and Urban Development, Office of Policy Development and Research
Population and
Households
Current Population: 600,000
Population growth has been strong in
the Fayetteville HMA during the past
2 decades, averaging 2.5 percent annually
since 2000, with net in-migration occurring
every year and accounting for 69 percent
of the increase.
Current Population Facts
The current population of the Fayetteville HMA
is an estimated 600,000, reflecting an average
increase of 11,100, or 2.1 percent, annually
since 2010 (Table 3). During this period, net
in-migration accounted for 69 percent of the
population growth (Figure 5). The growing
economy, scenic vistas, numerous recreational
lakes, and the relatively affordable cost of living
have drawn residents to the HMA, which ranked
seventh in the U.S. News & World Report Best
Places to Live in 2022–2023 and eighth in the
U.S. News & World Report Most Affordable Places
to Live in 2022–2023.
Population Trends
During the 2000s, the population in the HMA
increased by an average of 11,600, or 2.9 percent,
annually, with an average annual net in-migration
of 7,875 people, or 68 percent of the population
2000–2001
2001–2002
2002–2003
2003–2004
2004–2005
2005–2006
2006–2007
2007–2008
2008–2009
2009–2010
2010–2011
2011–2012
2012–2013
2013–2014
2014–2015
2015–2016
2016–2017
2017–2018
2018–2019
2019–2020
2020–2021
2021–Current
Current–Forecast
18,000
16,000
14,000
12,000
10,000
8,000
6,000
4,000
2,000
0
Population Change
Net Natural Change Net Migration Population Growth
Figure 5. Components of Population Change in the Fayetteville HMA, 2000 Through the Forecast
Notes: Data displayed are average annual totals. The forecast period is from the current date (August 1, 2022) to August 1, 2025.
Sources: U.S. Census Bureau; current to forecast—estimates by the analyst
Table 3. Fayetteville HMA Population and Household Quick Facts
Population
Quick Facts
2010 Current Forecast
Population 463,204 600,000 642,900
Average Annual Change 11,600 11,100 14,300
Percentage Change 2.9 2.1 2.3
Household
Quick Facts
2010 Current Forecast
Households 173,054 224,250 241,100
Average Annual Change 4,100 4,150 5,625
Percentage Change 2.7 2.1 2.4
Notes: Average annual changes and percentage changes are based on averages from 2000 to 2010, 2010 to current, and current to forecast.
The forecast period is from the current date (August 1, 2022) to August 1, 2025.
Sources: 2000 and 2010—2000 Census and 2010 Census; current and forecast—estimates by the analyst

Population and Households 11Fayetteville-Springdale-Rogers, Arkansas-Missouri Comprehensive Housing Market Analysis as of August 1, 2022
Comprehensive Housing Market Analysis Fayetteville-Springdale-Rogers, Arkansas-Missouri
U.S. Department of Housing and Urban Development, Office of Policy Development and Research
growth (U.S. Census Bureau decennial census
counts). Population growth was strong from 2002
to 2007, averaging 13,800 people, or 3.5 percent,
annually because of strong job growth during
most of the period (U.S. Census Bureau population
estimates as of July 1). Net in-migration accounted
for 72 percent of the population growth during
that period, averaging 9,975 people a year. From
2007 to 2010, the population increased by an
average of 9,700, or 2.2 percent, annually. Net
in-migration accounted for approximately 56
percent of the population growth, or an average
of 5,400 people annually, even though nonfarm
payrolls declined during much of the period. Job
seekers were drawn to the HMA during the period
because of the relatively low unemployment rate
compared with the nation. Increased enrollment at
UA—which grew by an average of 640 students,
or 3.5 percent, annually, of which 92 percent
relocated from outside the HMA—also contributed
to population growth from 2007 to 2010 (UA
enrollment data; Figure 6). From 2010 to 2017, the
population increased by an average of 10,500, or
2.1 percent, annually. Net in-migration averaged
6,850 people and accounted for 65 percent of
the population growth during the period. Strong
job growth in the HMA during most of the period
and increased enrollment at UA—which gained
an average of 1,050 students, or 4.6 percent,
annually, with 86 percent of those students having
relocated from outside the HMA—contributed
to population growth. Relatively slower job
2000–2001
2001–20 02
2002–2003
2003–2004
2004– 2005
2005–2006
2006–2007
2007–2008
2008–2009
2009–2010
2010–2011
2011–2012
2012–2013
2013–2014
2014–2015
2015–2016
2016–2017
2017–2018
2018–2019
2019– 2020
2020–2021
2021–Current
12,000
10,000
8,000
6,000
4,000
2,000
0
Change in Non-HMA Student Enrollment Non-Student Net In-Migration Net In-Migration
Note: Enrollment changes are based on fall semester enrollments.
Sources: U.S. Census Bureau; University of Arkansas
Figure 6. University of Arkansas Student Enrollment and Net Migration Trends in the Fayetteville HMA
growth contributed to population growth moderating slightly in the HMA from 2017 to 2019 to an average
increase of 9,825 people, or 1.8 percent, annually, with net in-migration averaging 6,150 people annually
and accounting for 63 percent of population growth. Enrollment at UA increased an average of 290, or 1.1
percent, annually, which contributed to the slower population growth compared with the previous period.
Since 2019, population growth in the HMA has been strong, averaging 13,300 people, or 2.3 percent,
annually. Net in-migration averaged 10,550 people annually and accounted for 79 percent of population
growth since 2019. The relatively faster recovery of the local economy and lower unemployment rates in the
HMA compared with the nation contributed to strong net in-migration during the period. Net natural increase
slowed to average 2,750 people annually compared with an average increase of 3,650 annually from 2010
to 2019, mostly because of an elevated number of deaths stemming from the effects of COVID-19 during
part of the period.

Population and Households 12Fayetteville-Springdale-Rogers, Arkansas-Missouri Comprehensive Housing Market Analysis as of August 1, 2022
Comprehensive Housing Market Analysis Fayetteville-Springdale-Rogers, Arkansas-Missouri
U.S. Department of Housing and Urban Development, Office of Policy Development and Research
Population by Geography
As of July 2021, Benton County was the most
populous county in the HMA, with 50 percent of
the population (U.S. Census Bureau population
estimates as of July 1). Benton County also
accounted for 60 percent of the population
growth from April 2010 to July 2021, increasing
an average of 2.5 percent annually (U.S. Census
Bureau decennial census counts; U.S. Census
Bureau population estimates as of July 1).
Washington County accounted for 43 percent of
the HMA population in 2021. The population of
Washington County increased an average of 1.9
percent annually from 2010 to 2021, representing
39 percent of the population growth during the
period. The combined population of the remaining
two counties accounted for 7 percent of the
HMA population in 2021 and only 1 percent of
the population growth from 2010 to 2021. The
city of Fayetteville, with a population of 95,200
as of 2021, was the most populous city in the
HMA. Springdale, Rogers, and Bentonville, with
respective populations of 87,600, 71,100, and
56,700, were the second, third, and fourth largest
cities in the HMA. Among the largest cities,
Bentonville had the fastest population growth rate
and the second greatest increase in the number of
people from 2010 to 2021, averaging 4.3 percent,
or 1,900, annually. The city of Fayetteville had
the greatest increase in number of people,
averaging 1,925, or 2.3 percent, annually. From
2010 to 2021, the cities of Fayetteville and
Bentonville accounted for a combined 36 percent
of the HMA population growth.
Household Growth Trends
An estimated 224,250 households are currently in the HMA, representing an average annual increase of
4,150 households, or 2.1 percent, since April 2010, a similar pace to the population growth during the same
period. The number of households increased an average of 2.7 percent annually during the 2000s, a slower
pace compared with population growth during the same period. An increase in households doubling up
and a delay in new household formation in the late 2000s, a result of the Great Recession, contributed to
the slower pace of household growth, reflecting national trends (U.S. Census Bureau).
Households by Tenure
Currently, an estimated 138,700 owner households are in the HMA, representing an average increase of
1.9 percent annually since 2010. By comparison, renter households increased an average of 2.5 percent
annually since 2010 to 85,550. Tighter mortgage lending standards and an increased propensity to rent,
particularly during the early to mid-2010s, contributed to renter households increasing at a faster pace
since 2010 compared with owner households. The current homeownership rate is estimated to be
61.9 percent, down from 63.3 and 66.6 percent in 2010 and 2000, respectively (Figure 7).
75.0
71.0
67.0
63.0
59.0
55.0
250,000
200,000
150,000
100,000
50,000
0
2000 2010 Current
Homeownership Rate (%)
Households
RenterOwner Homeownership Rate
66.6
63.3
61.9
Figure 7. Households by Tenure and Homeownership Rate in the Fayetteville HMA
Note: The current date is August 1, 2022.
Sources: 2000 and 2010—2000 Census and 2010 Census; current—estimates by the analyst

Population and Households 13Fayetteville-Springdale-Rogers, Arkansas-Missouri Comprehensive Housing Market Analysis as of August 1, 2022
Comprehensive Housing Market Analysis Fayetteville-Springdale-Rogers, Arkansas-Missouri
U.S. Department of Housing and Urban Development, Office of Policy Development and Research
University of Arkansas
Student Households
UA has a notable impact on the HMA housing
market. UA provides on-campus housing for
approximately 6,200 students, or 21 percent
of the 29,100 students enrolled as of the fall
2021 semester. The remaining students make
up an estimated 7,650 households, of which
approximately 7,200 are renter households; those
students reside in the local housing market,
primarily in Washington County. Off-campus UA
student households account for an estimated
3 percent of HMA households overall and
8 percent of all renter households in the HMA.
Forecast
During the forecast period, the population of the HMA is expected to increase by an average of 14,300,
or 2.3 percent, annually. Net in-migration is expected to increase during the second and third years, as
the economy expands at a slightly faster pace compared with the first year. The number of households
in the HMA is expected to increase by an average of 5,625, or 2.4 percent, annually during the forecast
period, a slightly faster pace compared with population growth. An increasing proportion of residents
aged 65 and older, who tend to have smaller households, contribute to the slightly faster pace. The
population of residents in the HMA aged 65 and older accounted for 13.3 percent of the total population
in 2021 compared with 11.2 percent in 2010 (U.S. Census Bureau). The proportion of residents aged
65 and older is expected to continue increasing during the forecast period.

Home Sales Market 14Fayetteville-Springdale-Rogers, Arkansas-Missouri Comprehensive Housing Market Analysis as of August 1, 2022
Comprehensive Housing Market Analysis Fayetteville-Springdale-Rogers, Arkansas-Missouri
U.S. Department of Housing and Urban Development, Office of Policy Development and Research
Home Sales Market
Market Conditions: Tight
Increases in home sales during most years
since 2010 and a significant decrease in the
inventory of homes for sale have contributed
to tighter sales market conditions in the
Fayetteville HMA compared with 2010.
Current Conditions
The home sales market in the Fayetteville HMA
is currently tight, with an estimated vacancy rate
of 1.2 percent, down from 3.8 percent in April
2010, when conditions were soft (Table 4). The
home sales vacancy rate had decreased before
the onset of the pandemic, partly because of
increased home sales demand stemming from net
in-migration and job growth each year during the
2010s. Recently, home sales market conditions
have tightened further, partly because of a
significant decline in the number of homes for
sale. During July 2022, the number of available
homes for sale represented a 1.5-month supply
compared with 1.2 months a year earlier and
1.5 months in July 2020 (CoreLogic, Inc.). By
comparison, the supply of homes available
for sale was 3.7 months in July 2019 and 12.9
months in April 2010. Tighter home sales market
conditions in the past 2 years have also been due
to increased home sales demand during most of
the period stemming partly from low mortgage
interest rates. The average interest rate for a 30-year fixed-rate mortgage was 3.0 and 3.1 percent during
2021 and 2020, representing the lowest and second lowest average rates for any year during the past
50 years, respectively (Freddie Mac). However, that rate has increased significantly during the past
several months, reaching 5.4 percent during July 2022 and contributing to diminished home sales
demand in the HMA during the most recent months.
Current Home Sales and Prices
During the 12 months ending July 2022, new and existing home sales totaled 17,550 homes in the HMA
(CoreLogic, Inc., with adjustments by the analyst). That number was down 5 percent compared with
a year earlier, when home sales increased 14 percent from the previous year to 18,550, a level that
represents the largest number of home sales during a 12-month period in the HMA since at least 2000.
The average home sales price during the 12 months ending July 2022 was $325,900, representing an
increase of $60,350, or 23 percent, the greatest increase in the average home price since at least 2001.
By comparison, the average home price increased 14 percent during the 12 months ending July 2021. The
decreased inventory of homes for sale placed upward pressure on home prices, which contributed to
strong increases in the average home price during the past 2 years. New home sales decreased 8 percent
to 2,925 during the 12 months ending July 2022 compared with a 7-percent increase a year earlier. The
Table 4. Home Sales Quick Facts in the Fayetteville HMA
Home Sales
Quick Facts
Fayetteville HMA Nation
Vacancy Rate 1.2% NA
Months of Inventory 1.5 2.0
Total Home Sales 17,550 7,050,000
1-Year Change -5% -7%
New Home Sales Price $348,700 $465,600
1-Year Change 23% 15%
Existing Home Sales Price $321,400 $395,300
1-Year Change 23% 12%
Mortgage Delinquency Rate 0.9% 1.4%
NA = data not available.
Notes: The vacancy rate is as of the current date; home sales and prices are for the 12 months ending July 2022; and months of inventory and
mortgage delinquency data are as of July 2022. The current date is August 1, 2022.
Sources: Vacancy rate—estimates by the analyst; months of inventory, mortgage delinquency rate, home sales, and prices—CoreLogic, Inc.

Home Sales Market 15Fayetteville-Springdale-Rogers, Arkansas-Missouri Comprehensive Housing Market Analysis as of August 1, 2022
Comprehensive Housing Market Analysis Fayetteville-Springdale-Rogers, Arkansas-Missouri
U.S. Department of Housing and Urban Development, Office of Policy Development and Research
average price for a new home increased 23 percent to $348,700 compared
with a 4-percent increase a year earlier. The greatest portion of new homes
sold was at prices ranging from $251,000 to $350,000 (Zonda; Figure 8).
Existing home sales decreased 5 percent to 14,650 homes compared with
a gain of 16 percent a year earlier (CoreLogic, Inc., with adjustments by the
analyst). The average existing home price increased 23 percent to $321,400
compared with a 17-percent increase a year earlier. Distressed sales accounted
for nearly 3 percent of existing home sales during the 12 months ending
July 2022, nearly unchanged from a year earlier but down from a peak of
33 percent during the 12 months ending October 2009.
Because of increases in mortgage interest rates since the beginning of 2022
and record-level home price growth, home sales have declined at a much faster
pace most recently. During the 3 months ending July 2022, new and existing
30
25
20
15
10
5
0
$150k or
Below
$151k to
$250k
$251k to
$350k
$351k to
$450k
$451k to
$650k
$651k or
Above
Share of Sales (%)
Existing Home Sales New Home Sales
Note: New and existing sales include single-family homes, townhomes, and condominium units.
Source: Zonda
Figure 8. Share of Overall Sales by Price Range During the 12 Months
Ending July 2022 in the Fayetteville HMA
home sales declined 15 percent compared with the same period a year earlier.
New home sales decreased 10 percent during the most recent 3 months, and
existing home sales decreased 16 percent. Of existing home sales, resales
declined 18 percent, and distressed sales increased 51 percent. During the
3 months ending July 2022, distressed sales accounted for nearly 4 percent
of existing home sales, up from 2 percent in the same period a year earlier.
Home Sales Trends
New and existing home sales were strong from 2001 through 2005 in the
HMA, increasing by an average of 1,900, or 18 percent, annually to 16,800
homes (Figure 9). New home sales were particularly strong during the period,
increasing an average of 50 percent annually compared with an average
annual increase in existing home sales of 15 percent. Strong job and population
growth contributed to increased home sales demand in the HMA during the
20,000
18,000
16,000
14,000
12,000
10,000
8,000
6,000
4,000
2,000
0
Jul-01
Jul-02
Jul-03
Jul-04
Jul-05
Jul-06
Jul-07
Jul-08
Jul-09
Jul-10
Jul-11
Jul-12
Jul-13
Jul-14
Jul-15
Jul-16
Jul-17
Jul-18
Jul-19
Jul-20
Jul-21
Jul-22
Sales Totals
Existing Home Sales New Home Sales
Source: CoreLogic, Inc., with adjustments by the analyst
Figure 9. 12-Month Sales Totals by Type in the Fayetteville HMA

Home Sales Market 16Fayetteville-Springdale-Rogers, Arkansas-Missouri Comprehensive Housing Market Analysis as of August 1, 2022
Comprehensive Housing Market Analysis Fayetteville-Springdale-Rogers, Arkansas-Missouri
U.S. Department of Housing and Urban Development, Office of Policy Development and Research
period. Relaxed mortgage lending standards also
contributed to the increase in home sales. In 2005,
adjustable-rate mortgages, which can be used as
a tool to qualify more borrowers, accounted for 22
percent of all home mortgages in the HMA (Zonda).
Home sales declined from 2006 through 2010
by an average of 1,925, or 16 percent, annually
to 7,100 (CoreLogic, Inc., with adjustments by
the analyst). During the period, new home sales
decreased an average of 23 percent annually, and
existing home sales declined an average of 15
percent annually. The significant decrease in home
sales during the period resulted from the housing
crisis, a slowing local economy in 2007, and job
losses during 2008 and 2009. Tighter mortgage
lending standards also contributed to declining
home sales during the period. The portion of
adjustable-rate mortgages decreased each year
from 2006 through 2009 to reach 3 percent of
all home loans in the HMA during 2009, before
increasing slightly to 4 percent by 2010 (Zonda).
Strong job and population growth, increased
wages, and somewhat easier access to credit
contributed to an average increase in home sales
of 1,300, or 13 percent, annually from 2011 through
2016 to 14,900 (CoreLogic, Inc., with adjustments
by the analyst). Demand for new homes was strong
during the period, resulting in an average increase
in new home sales of 19 percent annually. Slower
job and population growth contributed to home
sales easing during 2017 to an increase of 420, or
3 percent, to 15,350, with no increase in new home
sales and existing home sales increasing 3 percent.
Home sales slowed further during 2018 and 2019 to an average increase of 210, or 1 percent, annually.
However, new home sales increased an average of 12 percent annually during the period, while existing
home sales were relatively unchanged. Increased home sales demand, stemming from decreasing mortgage
interest rates and strong population growth, contributed to an increase in home sales during 2020 of 1,950,
or 12 percent, to 17,700. New home sales demand was especially strong, with an increase in new home sales
of 23 percent compared with a 10-percent increase in existing home sales.
Home Sales Price Trends
The average price for new and existing homes in the HMA increased nearly every year from 2001 through
2006, with an average increase of $10,850, or 8 percent, annually (Figure 10). Decreased home sales
demand contributed to the average home sales price declining from 2007 through 2009 by an average
of $7,700, or 5 percent, annually to $148,100. A growing portion of lower priced distressed sales, which
increased from 1 percent of total home sales in 2006 to 29 percent in 2009, also contributed to the
decrease in the average home price. The average distressed sales price in 2009 was 24 percent less
than the average price for resales and 41 percent below the average price for new homes. During 2010
and 2011, the average home price fluctuated but was generally stable compared with 2009. During 2010
350,000
300,000
250,000
200,000
150,000
100,000
Jul-01
Jul-02
Jul-03
Jul-04
Jul-05
Jul-06
Jul-07
Jul-08
Jul-09
Jul-10
Jul-11
Jul-12
Jul-13
Jul-14
Jul-15
Jul-16
Jul-17
Jul-18
Jul-19
Jul-20
Jul-21
Jul-22
Average Sales Price ($)
New Home Sales Existing Home Sales
Figure 10. 12-Month Average Sales Price by Type of Sale in the Fayetteville HMA
Source: CoreLogic, Inc., with adjustments by the analyst
Home Sales Market 17Fayetteville-Springdale-Rogers, Arkansas-Missouri Comprehensive Housing Market Analysis as of August 1, 2022
Comprehensive Housing Market Analysis Fayetteville-Springdale-Rogers, Arkansas-Missouri
U.S. Department of Housing and Urban Development, Office of Policy Development and Research
and 2011, the average home price increased an
average of less than 1 percent annually, before
increasing from 2012 through 2019 an average of
5 percent annually to $222,100. The average home
price increased every year from 2012 through
2019. During the period, increases ranged from
a 9-percent increase in 2016, when home sales
demand was strong, to an increase of 1 percent in
2017, when home sales demand had moderated.
Reflecting strong home sales demand and a
significant decrease in the inventory of homes
available for sale, the average price for a home
increased 10 percent during 2020 to $244,800.
Delinquent Mortgages and
Real Estate Owned Properties
In July 2022, 0.9 percent of home loans in
the HMA were seriously delinquent (90 or
more days delinquent or in foreclosure) or had
transitioned into real estate owned (REO) status;
that percentage is down from 1.8 percent a
year earlier and below the 7.0-percent peak in
January 2010 (CoreLogic, Inc.). The percentage
of seriously delinquent mortgages and REO
properties increased significantly during the
early stages of the COVID-19 pandemic, as
weakened economic conditions made it more
difficult for many homeowners to stay current
on their mortgage payments, and a large number
of home mortgages were placed in forbearance.
By October 2020, the percentage reached a
recent peak of 2.6 percent. Improved local
economic conditions contributed to the decrease in the percentage of seriously delinquent mortgages
and REO properties in July 2022 compared with a year earlier.
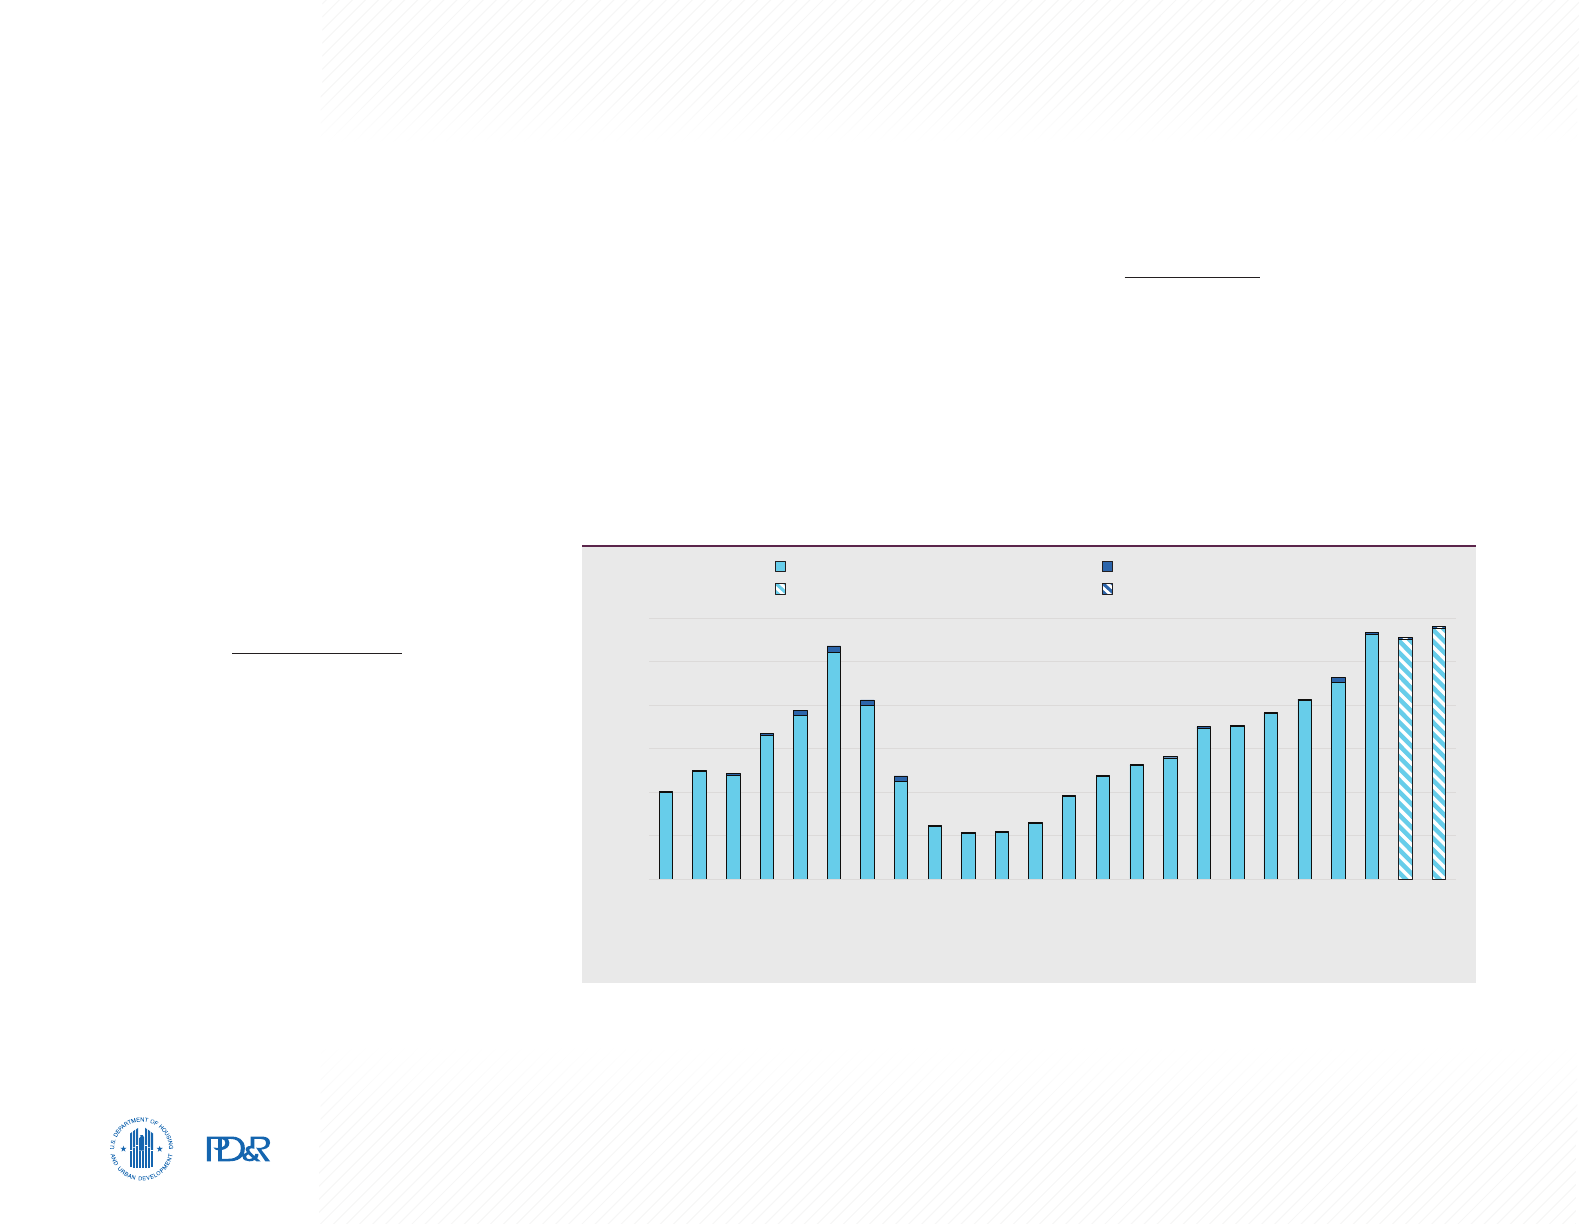
Sales Construction Trends
Home sales construction activity, as measured by the number of building permits issued for sales
housing, including single-family homes, townhomes, and condominiums, was strong in the HMA from
2001 through 2005, when homebuilding increased an average of 22 percent annually to 5,375 homes
permitted (Figure 11). Home builders responded to strong home sales demand during the period, which
stemmed from job and population growth and relaxed mortgage lending standards. Home construction
activity declined an average of 33 percent annually from 2006 through 2009 because of decreased home
sales demand stemming from tightening lending standards and, by 2008, a contracting local economy.
During 2010, home construction activity remained relatively stable, albeit moderate, increasing 2 percent
6,000
5,000
4,000
3,000
2,000
1,000
0
2000
2001
2002
2003
2004
2005
2006
2007
2008
2009
2010
2011
2012
2013
2014
2015
2016
2017
2018
2019
2020
2021
12 ME Jul 2021
12 ME Jul 2022
Single-Family Homes/Townhomes
Single-Family Homes/Townhomes 12 ME
Condominiums
Condominiums 12 ME
Figure 11. Annual Sales Permitting Activity in the Fayetteville HMA
12 ME = 12 months ending.
Sources: U.S. Census Bureau, Building Permits Survey; 2000–21—final data and estimates by the analyst; past 24 months of data—preliminary
data and estimates by the analyst

Home Sales Market 18Fayetteville-Springdale-Rogers, Arkansas-Missouri Comprehensive Housing Market Analysis as of August 1, 2022
Comprehensive Housing Market Analysis Fayetteville-Springdale-Rogers, Arkansas-Missouri
U.S. Department of Housing and Urban Development, Office of Policy Development and Research
to approximately 1,075 homes permitted. Increased home sales demand
stemming from job and population growth contributed to homebuilding
increasing an average of 22 percent annually from 2011 through 2016 to 3,500
homes permitted. During 2017, home construction activity slowed because
of moderating new home sales demand. The number of homes permitted
increased only 1 percent. Home construction activity increased an average
of 8 percent annually during 2018 and 2019, as home builders responded to
increased demand for new homes during the same period. Increased new home
sales demand also contributed to an increase in home construction activity
during 2020. Homebuilding increased by 480, or 12 percent, to 4,625 permits.
Current Sales Construction Activity
Strong home sales demand in the HMA during most of the past 2 years
contributed to a significant increase in home construction activity. During
the 12 months ending July 2022, homebuilding reached a record 5,800
homes permitted, up 5 percent compared with a year earlier, when home
construction activity increased 25 percent from the previous year and was
at that time at a record level (preliminary data). Currently, an estimated 4,400
homes are under construction in the HMA. The Aurora master-planned
community is currently under construction in the city of Bentonville. The
community will include 245 single-family homes on 72 acres at buildout.
Amenities at Aurora will include two community swimming pools, an Elevate
Fitness Course, and a bike repair station. Two-, three-, and four-bedroom
homes, ranging in size from 2,100 to 3,450 square feet, are offered at the
community, with prices ranging from $435,000 to $725,000. Thirty-five
homes have sold in the community, and 9 homes are currently for sale. In
the city of Fayetteville, construction is nearing completion at the Magnolia
Park residential community, which will include approximately 110 single-family
homes at buildout. Since opening in 2021, 85 new three- and four-bedroom
homes have sold in the community. Three homes, ranging in size from 2,100
to 2,350 square feet, are currently for sale starting at $450,200, and an
additional 11 home sites are available for construction.
Forecast
Demand is expected for 14,000 new homes in the HMA during the next 3 years
(Table 5). New home sales demand is expected to increase slightly each year
of the forecast period, partly because of increasing employment and net in-
migration during the second and third years. The 4,400 homes currently under
construction will meet most of the demand during the first year.
Table 5. Demand for New Sales Units in the Fayetteville HMA
During the Forecast Period
New Homes
Demand 14,000 Homes
Under Construction 4,400 Homes
Note: The forecast period is from August 1, 2022, to August 1, 2025.
Source: Estimates by the analyst

Rental Market 19Fayetteville-Springdale-Rogers, Arkansas-Missouri Comprehensive Housing Market Analysis as of August 1, 2022
Comprehensive Housing Market Analysis Fayetteville-Springdale-Rogers, Arkansas-Missouri
U.S. Department of Housing and Urban Development, Office of Policy Development and Research
Rental Market
Market Conditions: Tight
Strong job and population growth during
most years since 2010 have contributed
to currently tight rental market conditions
compared with soft conditions in 2010.
Current Conditions
The rental housing market in the Fayetteville HMA
is tight, with a current overall rental vacancy rate
estimated at 6.5 percent (Table 6). Rental market
conditions have tightened since April 2010, when
the rental vacancy rate was 13.9 percent and
conditions were soft. The apartment rental market
is also currently tight compared with 2010, when
conditions were soft. The average apartment
vacancy rate during the second quarter of 2022
was 2.3 percent, down slightly from 2.5 percent
a year earlier and down from 4.1 percent 2 years
earlier (CoStar Group; Figure 12). By comparison,
the average apartment vacancy rate was 6.8
percent in the second quarter of 2010. In 2021,
occupied single-family rental homes in the HMA
accounted for an estimated 43.1 percent of the total
number of occupied rental units (2021 American
Community Survey 1-year data; estimates by the
analyst). Single-family rental home vacancy rates
are often higher than apartment vacancy rates,
partly because amenities and services—such as
clubhouses, swimming pools, and lawn service—
are typically offered at apartments but not at
single-family rental homes. During July 2022, the
average vacancy rate for professionally
managed
Rental Market
Quick Facts
2010 (%) Current (%)
Rental Vacancy Rate
13.9 6.5
2010 (%) 2021 (%)
Occupied Rental Units by Structure
Single-Family Attached & Detached
40.1 43.1
Multifamily (2–4 Units)
17.7 11.2
Multifamily (5+ Units)
36.3 39.8
Other (Including Mobile Homes)
5.9 5.9
Apartment
Market
Quick Facts
2Q 2022 YoY Change
Apartment Vacancy Rate
2.3 -0.2
Average Rent
$970 12%
Studio
$874 19%
One-Bedroom
$848 12%
Two-Bedroom
$1,001 12%
Three-Bedroom
$1,334 12%
2Q = second quarter. YoY= year-over-year.
Notes: The current date is August 1, 2022. Percentages may not add to 100 due to rounding.
Sources: 2010 vacancy rate—2010 Census; current vacancy rate—estimate by the analyst; occupied rental units by structure—2010 and 2021
American Community Survey, 1-year data and estimates by the analyst; apartment data—CoStar Group
Table 6. Rental and Apartment Market Quick Facts in the Fayetteville HMA
2Q = second quarter.
Source: CoStar Group
Average Monthly Rent Vacancy Rate
8.0
7.0
6.0
5.0
4.0
3.0
2.0
1.0
1,000
950
900
850
800
750
700
650
2Q 2007
2Q 2008
2Q 2009
2Q 2010
2Q 2011
2Q 2012
2Q 2013
2Q 2014
2Q 2015
2Q 2016
2Q 2017
2Q 2018
2Q 2019
2Q 2020
2Q 2021
2Q 2022
Vacancy Rate (%)
Average Monthly Rent ($)
Figure 12. Apartment Rents and Vacancy Rates in the Fayetteville HMA

Rental Market 20Fayetteville-Springdale-Rogers, Arkansas-Missouri Comprehensive Housing Market Analysis as of August 1, 2022
Comprehensive Housing Market Analysis Fayetteville-Springdale-Rogers, Arkansas-Missouri
U.S. Department of Housing and Urban Development, Office of Policy Development and Research
single-family rental units was 6.1 percent, up 0.2 percentage points from
July 2021 (CoreLogic, Inc.). During the same period, the average rent for
professionally managed two-bedroom, single-family homes increased
14 percent to $1,355. The average apartment rent during the second quarter
of 2022 increased 12 percent to $970 compared with a 5-percent increase a
year earlier (CoStar Group). The current level of apartment rent growth in the
HMA represents the fastest pace since at least 2001. Tight apartment market
conditions stemming from a relatively fast recovery of the local economy
and strong net in-migration contributed to the strong rent growth during the
past year. A limited inventory of homes for sale, strong home price growth,
and by 2022, increasing mortgage interest rates, also contributed to strong
apartment demand and rent growth during the past year.
Current Apartment Conditions by Geography
The average apartment vacancy rates during the second quarter of 2022
among the four most populous cities in the HMA ranged from 2.1 percent
in the city of Fayetteville to 4.0 percent in the city of Bentonville. Average
apartment rents ranged from $851 in the city of Fayetteville to $1,130 in the
city of Bentonville. Rent growth during the second quarter of 2022 ranged
from 7 percent in the city of Fayetteville to 14 percent each in the cities of
Bentonville, Springdale, and Rogers. The average apartment vacancy rate
at properties within 1 mile of the UA main campus, excluding off-campus
student apartments, was 1.7 percent, and the average rent increased
4 percent to $1,002.
Apartment Vacancy Trends
Apartment market conditions in the HMA were generally slightly tight to
tight during the early to mid-2000s because of an expanding local economy
and net in-migration during the period. The average apartment vacancy rate
began to increase by the second quarter of 2007, however, and reached
a second-quarter peak of 7.8 percent by the second quarter of 2009, as
apartment market conditions softened partly because of a slowing local
economy in 2007 and job losses during 2008 and 2009. From the second
quarter of 2010 to the second quarter of 2016, increased UA student
enrollment, population growth, and an expanding local economy—combined
with moderate apartment construction activity during most of the period—
contributed to a significant decline in the average apartment vacancy rate,
which reached 2.4 percent by the second quarter of 2016, when apartment
market conditions were tight. An increased preference to rent among residents
during the period also contributed to the decrease in the average apartment
vacancy rate. Moderating job and population growth and a significant number
of new apartment units added to the existing apartment supply contributed
to apartment market conditions transitioning to slightly tight during the late
2010s. Although the average apartment vacancy rate remained relatively low,
it increased to 3.7 percent by the second quarter of 2019. Nearly 5,500 new
apartment units were completed and added to the existing apartment supply
from the second quarter of 2017 through the second quarter of 2019, which
contributed to the increased rate. During the second quarter of 2020, the
average apartment vacancy rate increased slightly to 4.1 percent, partly due
to job losses that occurred because of the effects of COVID-19. Apartment rent
growth in the HMA was generally steady albeit moderate during the 2010s,
with the average apartment rent increasing an average of 2 percent annually to
$813 by the second quarter of 2019 compared with $681 in the second quarter
of 2010. Rent growth slowed to 1 percent in the second quarter of 2020,
reflecting a slight decline in apartment demand during the same period.
Off-Campus Student Apartments
The supply of off-campus student apartments in the HMA increased
significantly during the past decade. Although UA has added on-campus
housing to accommodate an additional 850 students since 2010, UA
enrollment increased by 9,200 students during the same period. Since
2010, private developers have responded to strong enrollment growth at
UA during most of the period by building 16 off-campus student apartment
communities in the HMA, with a combined 7,975 beds in 2,525 units,

Rental Market 21Fayetteville-Springdale-Rogers, Arkansas-Missouri Comprehensive Housing Market Analysis as of August 1, 2022
Comprehensive Housing Market Analysis Fayetteville-Springdale-Rogers, Arkansas-Missouri
U.S. Department of Housing and Urban Development, Office of Policy Development and Research
accounting for 14 percent of rental construction
activity. As of the second quarter of 2022, off-
campus student apartments had an average
vacancy rate of 9.6 percent compared with a
vacancy rate of 12.0 percent a year earlier and an
average rate of 12.1 percent from 2010 through
2020 (CoStar Group). The off-campus student
apartment average rent increased 4 percent
to $671 per bed in the second quarter of 2022
compared with a 1-percent increase a year earlier
and an average increase of 1 percent annually
from 2011 to 2020. By comparison, the average
off-campus student apartment vacancy rate
nationally was 8.8 percent in the second quarter
of 2022, down from 12.6 percent a year earlier,
and the average rent also increased 4 percent
to $758 per bed.
Rental Construction Activity
Rental construction activity during the 2000s in
the HMA, as measured by the number of rental
units permitted, was strongest from 2003 through
2006, averaging 2,425 units annually (Figure 13).
Weakening apartment market conditions from
2007 through 2009 and job losses in 2008 and
2009 contributed to rental construction activity
decreasing by an average of 51 percent annually
from 2007 through 2011 to only 55 units permitted.
Rental construction activity occurred at a moderate
pace from 2012 through 2014, averaging 740
units permitted annually, as builders were slow to
respond to improving economic and rental market
conditions. Off-campus student apartment construction accounted for 58 percent of rental construction
activity during the period. From 2015 through 2017, rental construction activity increased compared with
the previous period, averaging 1,450 units permitted each year, as builders responded to strong demand
stemming from strong job and population growth during most of the period. Rental construction activity
surged during 2018 and 2019 in the HMA, when an average of 2,925 units were permitted annually, as
builders responded to relatively low average apartment vacancy rates and consistent rent growth. Nearly
20 percent of rental construction activity in the HMA occurred at two large apartment developments, with a
combined 1,100 units, in the city of Bentonville.
Also, 600 off-campus student apartment units were built in
the city of Fayetteville, accounting for 10 percent of rental construction activity in the HMA during the period.
Rental construction activity in the HMA remained strong in 2020 but slowed compared with the previous
2 years. In 2020, rental construction activity totaled
2,100 units permitted, three-fourths of which occurred
in Benton County in the cities of Bentonville and Rogers.
3,500
3,000
2,500
2,000
1,500
1,000
500
0
2000
2001
2002
2003
2004
2005
2006
2007
2008
2009
2010
2011
2012
2013
2014
2015
2016
2017
2018
2019
2020
2021
12 ME Jul 2021
12 ME Jul 2022
Rental Units Rental Units 12 ME
Figure 13. Annual Rental Permitting Activity in the Fayetteville HMA
12 ME = 12 months ending.
Note: Includes apartments and units intended for rental occupancy.
Sources: U.S. Census Bureau, Building Permits Survey; 2000–21—final data and estimates by the analyst; past 24 months of data—preliminary
data and estimates by the analyst

Rental Market 22Fayetteville-Springdale-Rogers, Arkansas-Missouri Comprehensive Housing Market Analysis as of August 1, 2022
Comprehensive Housing Market Analysis Fayetteville-Springdale-Rogers, Arkansas-Missouri
U.S. Department of Housing and Urban Development, Office of Policy Development and Research
New Construction Activity
During the 12 months ending July 2022, rental construction activity in the
HMA increased 20 percent to an estimated 2,400 units permitted compared
with a 16-percent decrease a year earlier (preliminary data; estimates by
the analyst). A low average apartment vacancy rate and strong rent growth
contributed to the increase in rental construction activity during the past
year. Currently, an estimated 4,300 rental units are under construction.
Construction on Dodson Pointe Apartment Homes in the city of Rogers is
expected to be completed in the fall of 2022. The development is expected
to include 240 market-rate one- and two-bedroom units. Rents are expected
to start at $1,040 and $1,340 for one- and two-bedroom units, respectively.
The Reserve at Springdale apartment community is also slated to open in the
fall of 2022 in the city of Springdale and is expected to include 170 market-
rate one-, two-, and three-bedroom units. Rents at The Reserve at Springdale
are expected to start at $899 for one-bedroom units, $1,019 for two-bedroom
units, and $1,179 for three-bedroom units. The Retreat at Fayetteville, an off-
campus student apartment community near the UA main campus, is currently
under construction and expected to be completed in the fall of 2023. The
community is expected to offer 585 beds in 140 two-, four-, and five-bedroom
units when complete. Anticipated amenities at The Retreat at Fayetteville will
include an academic lounge, group study rooms, and an outdoor theater.
Forecast
During the forecast period, demand is estimated for 6,475 new rental units in the
HMA (Table 7). Demand is expected to increase slightly in the second and third
years of the forecast period because of greater net in-migration. The 4,300 units
currently under construction are expected to satisfy a portion of demand.
Note: The forecast period is August 1, 2022, to August 1, 2025.
Source: Estimates by the analyst
Rental Units
Demand 6,475 Units
Under Construction 4,300 Units
Table 7. Demand for New Rental Units in the Fayetteville HMA
During the Forecast Period

Terminology Definitions and Notes 23Fayetteville-Springdale-Rogers, Arkansas-Missouri Comprehensive Housing Market Analysis as of August 1, 2022
Comprehensive Housing Market Analysis Fayetteville-Springdale-Rogers, Arkansas-Missouri
U.S. Department of Housing and Urban Development, Office of Policy Development and Research
Terminology Definitions and Notes
A. Definitions
Building Permits
Building permits do not necessarily reflect all residential building activity that occurs in a housing market area. Some units are constructed or created
without a building permit or are issued a different type of building permit. For example, some units classified as commercial structures are not reflected
in the residential building permits. As a result, the analyst, through diligent fieldwork, makes an estimate of this additional construction activity. Some
of these estimates are included in the discussions of single-family and multifamily building permits.
Demand
The demand estimates in the analysis are not a forecast of building activity. They are the estimates of the total housing production needed to achieve
a balanced market at the end of the 3-year forecast period given conditions on the as-of date of the analysis, growth, losses, and excess vacancies.
The estimates do not account for units currently under construction or units in the development pipeline.
Distressed Sales Short sales and real estate owned (REO) sales.
Existing Home
Sales
Include resales, short sales, and REO sales.
Forecast Period 8/1/2022–8/1/2025—Estimates by the analyst.
Home Sales/
Home Sales
Prices
Includes single-family, townhome, and condominium sales.
Net Natural
Increase
Resident births minus resident deaths.

Terminology Definitions and Notes 24Fayetteville-Springdale-Rogers, Arkansas-Missouri Comprehensive Housing Market Analysis as of August 1, 2022
Comprehensive Housing Market Analysis Fayetteville-Springdale-Rogers, Arkansas-Missouri
U.S. Department of Housing and Urban Development, Office of Policy Development and Research
Rental Market/
Rental Vacancy
Rate
Includes apartments and other rental units, such as single-family, multifamily, and mobile homes.
Resales
Resales are home closings that have no ties to either new home closings (builders) or foreclosures. They are homes that were previously constructed
and sold to an unaffiliated third party.
Seriously
Delinquent
Mortgages
Mortgages 90+ days delinquent or in foreclosure.
B. Notes on Geography
1.
The metropolitan statistical area definition noted in this report is based on the delineations established by the Office of Management and Budget (OMB)
in the OMB Bulletin dated April 10, 2018.
2. Urbanized areas are defined using the U.S. Census Bureau 2010 Census Urban and Rural Classification and the Urban Area Criteria.
C. Additional Notes
1.
This analysis has been prepared for the assistance and guidance of HUD in its operations. The factual information, findings, and conclusions may
also be useful to builders, mortgagees, and others concerned with local housing market conditions and trends. The analysis does not purport to
make determinations regarding the acceptability of any mortgage insurance proposals that may be under consideration by the Department.
2.
The factual framework for this analysis follows the guidelines and methods developed by the Economic and Market Analysis Division within HUD.
The analysis and findings are as thorough and current as possible based on information available on the as-of date from local and national sources.
As such, findings or conclusions may be modified by subsequent developments. HUD expresses its appreciation to those industry sources and state
and local government officials who provided data and information on local economic and housing market conditions.

Terminology Definitions and Notes 25Fayetteville-Springdale-Rogers, Arkansas-Missouri Comprehensive Housing Market Analysis as of August 1, 2022
Comprehensive Housing Market Analysis Fayetteville-Springdale-Rogers, Arkansas-Missouri
U.S. Department of Housing and Urban Development, Office of Policy Development and Research
Contact Information
Randall Goodnight, Economist
Oklahoma City HUD Field Office
405–609–8525
D. Photo/Map Credits
Cover Photo Adobe Stock
